Anisotropic magnetic properties of the ferromagnetic semiconductor CrSbSe3
Abstract
Single crystals of CrSbSe3, a structurally pseudo-one-dimensional ferromagnetic semiconductor, were grown using a high-temperature solution growth technique and were characterized by x-ray diffraction, anisotropic, temperature- and field-dependent magnetization, temperature-dependent resistivity and optical absorption measurements. A band gap of 0.7 eV was determined from both resistivity and optical measurements. At high temperatures, CrSbSe3 is paramagnetic and isotropic with a Curie-Weiss temperature of 145 K and an effective moment of 4.1 /Cr. A ferromagnetic transition occurs at = 71 K. The -axis, perpendicular to the chains in the structure, is the magnetic easy axis, while the chain axis direction, along , is the hard axis. Magnetic isotherms measured around do not follow the behavior predicted by simple mean field critical exponents for a second order phase transition. A tentative set of critical exponents is estimated based on a modified Arrott plot analysis, giving 0.25, 1.38 and 6.6.
I Introduction
Magnetic semiconductors have been studied for several decades for their potential applications in spintronicsŽutić et al. (2004). Bulk materials like europium and chromium chalcogenidesDietl (2002) are early examples of a ferromagnetic-semiconducting state, while ferromagnetism has also been successfully induced in well-developed semiconductors by magnetic dopingFurdyna (1988); Ohno (1998). Another approach in spintronics is to deposit thin layers of a semiconducting ferromagnetic material on top of a non-magnetic material. Recently, there have been many attempts to control magnetism in 2-dimensional (2D) materials or topological insulators by proximitizing a ferromagnetic semiconductorWang et al. (2015); Ji et al. (2013). Several 2D magnetic semiconductors, CrGeTe3 and CrI3 in particular, have even been shown to maintain their ferromagnetism at an atomic-layer levelLin et al. (2016); Gong et al. (2017); Huang et al. (2017).
In the Cr ternary chromium tri-chalcogenides (where is a non-transition-metal and = S, Se, Te), the crystal structure varies depending on how Cr octahedra are arranged. CrTe3 for = Si, Ge and Sn, for example, have layered structure, with CrTe6 octahedra forming a honeycomb lattice. When = Sb, Ga, on the other hand, Cr compounds exhibit a pseudo-one-dimensional crystal structure, with Cr octahedra forming infinite, edge-sharing, double rutile chains, and atoms linking neighboring chains; for different atoms, the relative angle between double rutile chains changesVolkov et al. (1997). Among these pseudo-one-dimensional compounds, CrSbSe3 is of interest due to its semiconducting ferromagnetic ground state. Previously, structural and magnetic properties have been reported for polycrystalline samplesOdink et al. (1993); Volkov et al. (1997). Those studies showed that Cr in CrSbSe3 appears as high-spin Cr3+, with = 3/2 and that the material becomes ferromagnetic below 70 K. To better understand the ferromagnetic properties of CrSbSe3 and inspect the influence of structural low dimensionality on its magnetism, we present here electric transport and anisotropic magnetic properties of single crystalline CrSbSe3.
II Experimental Methods
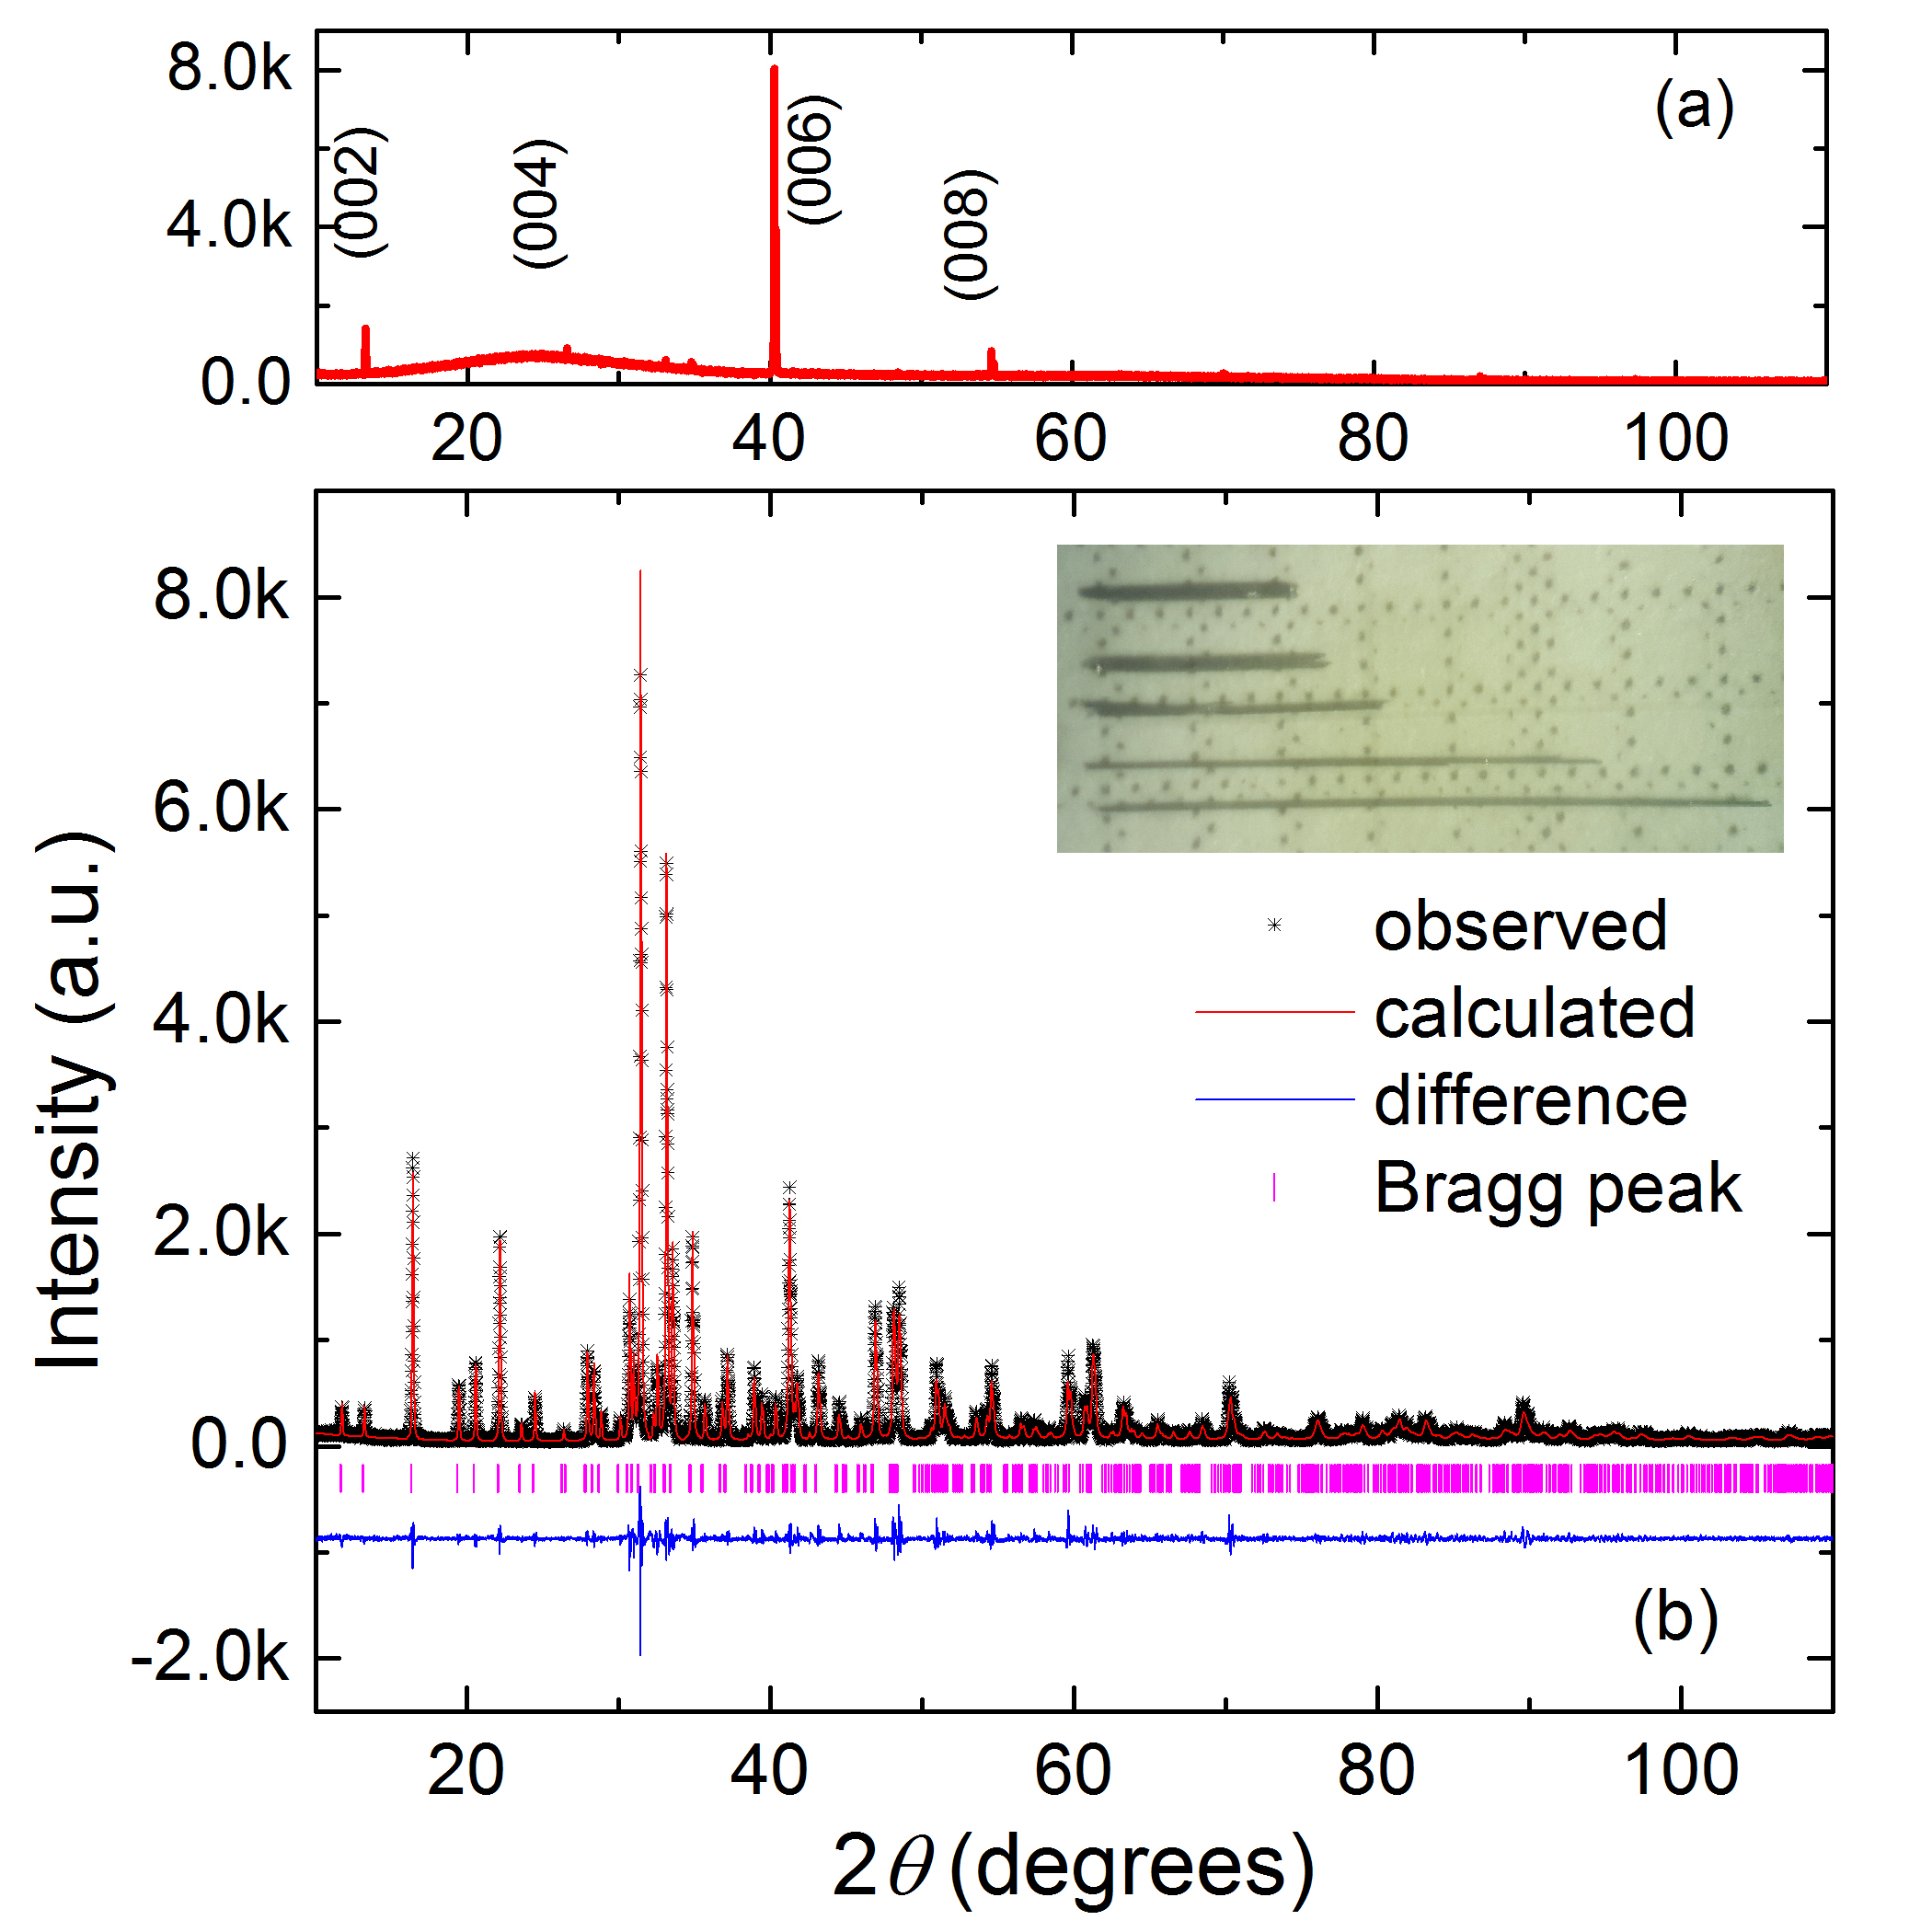
CrSbSe3 single crystals were grown by crystallization from a Se-rich solution. Starting bulk elements were mixed in a molar ratio of Cr:Sb:Se = 7:33:60 and were sealed in an evacuated silica tube. The ampoule was then heated to 800 ∘C and slowly cooled to 680 ∘C, where the molten liquid was separated from the crystals in a centrifuge with silica wool serving as a filter. Remaining flux that attached to the surface of crystals were removed by keeping the crystal at 500 ∘C for 3 days in a sealed silica tube while leaving the cold end of the tube at room temperature. Millimeter-long single crystals of CrSbSe3 are blade-like and malleable (see Fig.1(b)). Polycrystalline CrSbSe3 was also synthesized, via solid state reaction. Starting elements in powder form were mixed in a stoichiometric ratio and sealed in an evacuated silica tube and were kept at 600 ∘C for 2 days.
Magnetization data were measured using a Quantum Design (QD) physical property measurement system (PPMS) Dynacool, equipped with a VSM option. Anisotropic magnetization data were obtained on selective pieces of single crystals. For field-dependent magnetization, when and , single crystals were mounted on a silica sample holder with GE varnish. For b and for polycrystalline sample, the standard QD plastic capsule was used. Because the mass of each single crystal is small, anisotropic magnetization measurements were normalized to the saturation magnetization values obtained on polycrystalline sample (which has a much larger mass) at 1.8 K. Anisotropic, temperature-dependent magnetization were measured on a shaft of samples, which only distinguish between and . Temperature-dependent resistivity was measured on a polycrystalline CrSbSe3 pellet sample using the QD electrical transport option (ETO). Pt wires were attached to the sample via DuPont 4922N silver paint, using a two-probe configuration, suitable due to the very high resistance of the material.
Diffuse reflectance spectra were collected by a Cary 6000i UV-VIS-NIR spectrometer with an integrating sphere and were converted from reflectance to absorbance using Kubelka-Munk method. KBr was employed as the substrate. The sample for band gap measurement was mixed with KBr powder (sample to KBr, mass ratio 1:20) and pressed into a pellet. A pure KBr pellet with the same mass was prepared as the blank reference. Powder x-ray diffraction data were collected using a Bruker D8 Advance Eco, Cu Kα radiation ( = 1.5406 Å), equipped with a LynxEye-XE detector. The crystal structure of CrSbSe3 was further determined by single-crystal x-ray diffraction (SXRD), which is presented in the Appendix.
III Results and Discussion
Powder x-ray diffraction data for CrSbSe3 are shown in Fig. 1(b). All peaks can be indexed by the previously reported crystal structure, in agreement with our SXRD dataOdink et al. (1993); Volkov et al. (1997). For single crystalline samples, the -axis, is along the long crystal dimensionVolkov et al. (1997). The -axis direction relative to the crystal morphology was determined from a single crystal laying on its flat face on a glass slide on a powder diffractometer. As shown in Fig. 1(a), these data show predominantly (00) peaks, indicating the -axis is perpendicular to the blade-shaped sample. Minor peaks from other orientations may due to an imperfect alignment of the crystal on the glass slide.
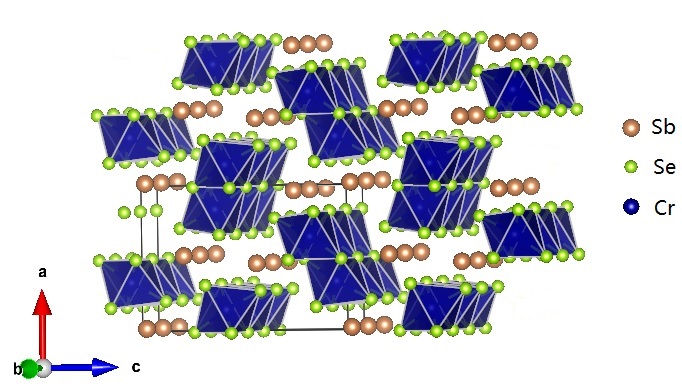
The crystal structure of CrSbSe3 is shown in Fig. 2. Edge sharing, slightly distorted, CrSe6 octahedra form chains that extend along the -axis. Each chain is composed of two parallel, edge sharing columns of CrSe6 octahedra, forming double rutile chains. Between the chains, the Cr atoms are linked by two Se atoms; both Cr-Se-Cr angles are 92∘. Sb atoms are located in between the double chains. Crystallographic data obtained from SXRD are summarized in Table 1 , final atomic parameters are listed in Table 2 and 3 in the Appendix.
The temperature-dependent resistivity of CrSbSe3 is shown in Fig. 3. At 300 K, the resistivity is around 0.1 M cm and increases with decreasing temperature. When plotting resistivity as a function of inverse temperature on a semi-log plot, the resistivity shows a linear behavior, consistent with semiconducting behavior and a band gap of 0.7 eV. This band gap was also confirmed with optical obsorbance measurements. In the inset of Fig. 3, the optical absorption coefficient as a function of wavelength is shown. A clear absorption edge is seen at around 1700 nm. The size of the band gap is estimated from this data to be 0.6 eV based on an indirect band gapJain et al. (2013) modelTarasova et al. (2012), in agreement with our resistivity result. The measured band gap is slightly larger than the value calculated by DFTJain et al. (2013).

Fig. 4 shows the anisotropic magnetization of CrSbSe3 as a function of temperature. In the paramagnetic state, the magnetic susceptibility of CrSeSe3 appears to be nearly isotropic. A linear fit to the high temperature inverse magnetic susceptibility of the polycrystalline data gives an effective moment of 4.1 /Cr, which is slightly larger than the expected value for Cr3+ (3.9 /Cr). The Curie-Weiss temperature extrapolated from the paramagnetic state is 145 K. A ferromagnetic transition occurs at around 70 K. Both the effective moment and Curie-Weiss temperature obtained in the current study agree with previously reported data for polycrystalline CrSbSe3 samplesOdink et al. (1993); Volkov et al. (1997).
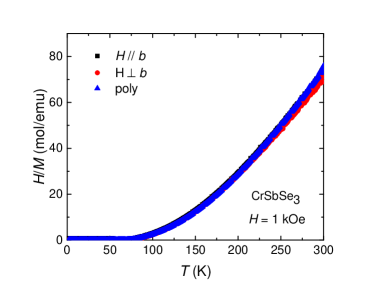
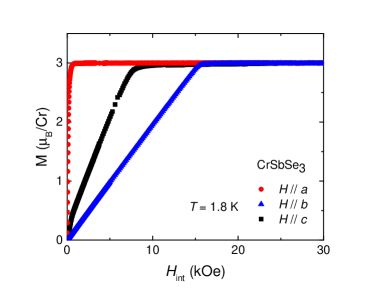
Fig. 5 shows the anisotropic magnetization isotherm measured at 1.8 K. The demagnetization factor was estimated by assuming the geometry of the sample is close to a rectangular shapeAharoni (1998). The internal field, , was calculated from the relation , where is the demagnetization factor. For , which is the easy axis, the demagnetization factor was also confirmed with the Arrott plot measured at around 2 KArrott (1957); Lamichhane et al. (2016). Both demagnetization factor values are numerically similar. The value obtained from the Arrott plot along the -axis was used to correct the calculated values for the other two orientations. As shown in Fig. 5, the -axis, which is perpendicular to the chains, is the easy axis and the -axis, the direction of the chains, is the hard axis, which saturates at 15 kOe. The magnetization value saturates at 3 /Cr, consistent with expectations for = 3/2 Cr3+.
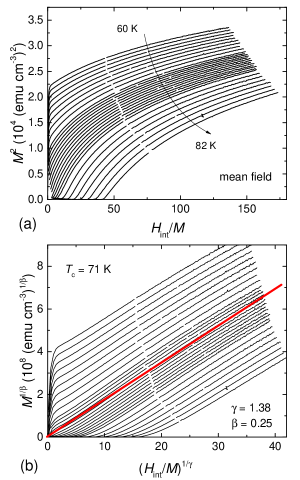
To better determine the ferromagnetic transition temperature, we first considered the well-known Arrott plotArrott (1957). Magnetization isotherms along the easy axis were measured at various temperatures in the vicinity of the ferromagnetic transition temperature. as a function of is displayed in Fig. 6(a). Because the Arrott plot describes the magnetic behavior at low fields in the proximity of , only magnetization data below 25 kOe were considered. In the mean field description of the magnetization near , curves in the Arrott plot should be a set of parallel straight lines with the one passing the origin indicating the ferromagnetic transition temperature. It is clear that the mean field critical exponent does not work for CrSbSe3, as illustrated by a set of curved lines shown in Fig. 6(a).
For a second order phase transition, the spontaneous magnetization () below , the initial magnetic susceptibility () above and the field-dependent magnetization () at are:
| (1) |
| (2) |
| (3) |
where ; , , D are critical amplitudes; and are critical exponentsFisher (1967). For the original Arrott plot, = 0.5 and = 1Arrott (1957). In a more general case with different critical exponents, a modified Arrott plot is often considered, which formulates as:Arrott and Noakes (1967).
| (4) |
where a and b are fitting constants. Since the mean field values apparently do not agree with our experimental data, we adopt the modified Arrott plot in order to better understand the nature of this ferromagnetic transition. In Fig. 6(b), we thus show the modified Arrott plot with a set of parameters ( = 1.38, = 0.25) that produces a set of straight lines satisfying the Arrott criteria. The ferromagnetic transition temperature, as depicted by the data that passes through the origin, is 71 K.
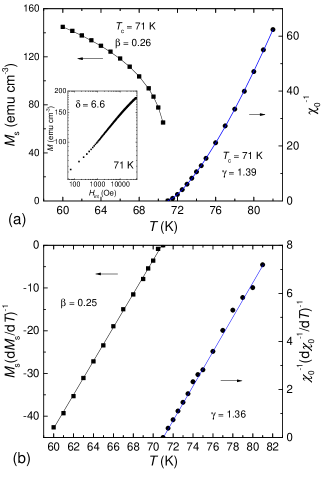
In order to double-check the self-consistency of obtained critical exponentsPramanik and Banerjee (2009), we extract the spontaneous magnetization and initial magnetic susceptibility from Fig. 6(b). The linearly extrapolated and are plotted as a function of temperature in Fig. 7(a). The solid curves are fitted lines according to Equation 1 and 2. The fitted critical exponent values are = 1.39 and = 0.26, which are similar to the starting values. In the inset of Fig. 7(a), the field-dependent magnetization of CrSbSe3 at = 71 K is drawn on a log-log plot. According to Equation 3, the field dependence yield = 6.6. In comparison to the theoretical prediction based on the Widom relationWidom (1964):
| (5) |
the calculated value of , using experimentally obtained critical exponents = 1.38 and = 0.25, is 6.5, which agrees with what is obtained in Fig. 7(a).
The self-consistency can also be checked via the Kouvel-Fisher (KF) methodKouvel and Fisher (1964). According to the KF method,
| (6) |
| (7) |
both and are linear function of temperature, with their slopes equal to the inverse of critical exponents. As seen in Fig. 7(b), linear lines are fitted to the experimental data and yield = 1.36, = 0.25, again, very similar to the starting critical exponent values.
The self-consistency of these critical exponents indicates a good fit of the data with theoretical formalism. The set of critical exponents obtained is not close to any of the well-known theoretical values for various models. The values are also quantitatively different from that obtained for layered ternary chromium tri-chalcogenidesLin et al. (2017); Liu and Petrovic (2017). The use of the modified Arrott plot for fitting critical exponents is known to yield significant standard errors in some cases, which arises when choosing different field and temperature ranges for consideration. As a consequence, the standard errors are usually difficult to estimate, as has been discussed recently, for example, in CrGeTe3Lin et al. (2017); Liu and Petrovic (2017), where slightly different criteria result in different critical exponent values. For the current study on CrSbSe3, it is clear that the mean field critical exponents cannot describe the experimental data. The obtained critical exponents serve as a set of self-consistent values that matches our data, and may direct further detailed studies to a range around these values.
Finally, according to the Mermin-Wagner theorem, ferromagnetic or antiferromagnetic ordering cannot happen in ideal one- or two-dimensional systems at finite temperature within an isotropic Heisenberg modelMermin and Wagner (1966). In the case where magnetic anisotropy exists, however, this conclusion does not necessarily hold. In the case of CrSbSe3, despite the fact that the magnetic-bearing sublattice of Cr3+ appears to be quasi-one-dimensional, the observed magnetic anisotropy in the ordered ferromagnetic state may contribute to its stability. Nevertheless, the obtained critical exponents still likely reflect the influence of low-dimensionality of the Cr3+ sublattice; further, more detailed investigation may be of interest.
IV Conclusions
In summary, we have synthesized CrSbSe3 single crystals in a high-temperature, Se-rich solution and carried out a study on the structural, electrical and magnetic properties of that material. Structurally, CrSbSe3 shows a pseudo-one-dimensional structure with magnetic-moment-bearing Cr sublattice forming double rutile chains. Electronically, CrSbSe3 is a semiconductor with a band gap of 0.7 eV. In its paramagnetic state, it appears to be magnetically isotropic with an effective moment of 4.1 /Cr and a Curie-Weiss temperature of 145 K. The ferromagnetic transition temperature was determined from a modified Arrott plot as = 71 K. In the ferromagnetic state, CrSbSe3 is anisotropic with the -axis being the easy axis. Based on the modified Arrott plot and the Kouvel-Fisher method, we arrived at a set of critical exponents for second order phase transition that describe our experimental data: = 1.38, = 0.25 and = 6.6. These values could serve as a starting point for further theoretical studies on magnetism at low-dimensions.
Acknowledgements
We would like to thank Valentin Taufour for insightful discussions and Tia S. Lee for experimental assistance. This work was supported by the Gordon and Betty Moore EPiQS initiative, grant number GBMF-4412.
Appendix
The SXRD data was collected at 296 K with a Kappa APEX DUO diffractometer equipped with a CCD detector (Bruker) using graphite-monochromatized Mo-Kα radiation ( = 0.71073 Å). The raw data were corrected for background, polarization, and the Lorentz factor using APEX2 softwareBru (2013), and a multi-scan absorption correction was appliedSheldrick (2014). The structure was solved using the charge flipping methodOszlányi and Süto (2004) and subsequent difference Fourier analyses with Jana2006Oszlányi and Süto (2008); Petříček et al. (2014a, b). Structure refinement against F was performed with Shelxl-2017/1Sheldrick (2015, 2017).
| Sum Formula | CrSbSe3 |
|---|---|
| Formula weight/(g mol-1) | 410.63 |
| Crystal system | orthorhombic |
| Space group | (no. 62) |
| Formula units per cell, | 4 |
| Lattice parameter a/ Å | 9.1388(3) |
| / Å | 3.7836(1) |
| / Å | 13.3155(4) |
| Cell volume/ () | 463.88(2) |
| Radiation | (Mo- = 0.71073 Å) |
| 2 82.23∘ | |
| Data range | -16h16, -6k6, -23l23 |
| Absorption coefficient/mm-1 | 31.5 |
| Measured reflections | 30213 |
| Independent reflections | 1527 |
| Reflections with 2() | 1379 |
| (int) | 0.040 |
| () | 0.015 |
| No. of parameters | 31 |
| (obs) | 0.017 |
| (all ) | 0.022 |
| (all ) | 0.030 |
| Residual electron density (e-/) | 1.12 to -0.98 |
| Atom | Wyck. site | Occ. | ||||
| Sb1 | 4 | 0.47058(2) | 1/4 | 0/65793(2) | 1 | 0.01332(3) |
| Cr1 | 4 | 0.15547(4) | 3/4 | 0.54468(3) | 1 | 0.00701(5) |
| Se1 | 4 | 0.28484(3) | 3/4 | 0.71314(2) | 1 | 0.01009(4) |
| Se2 | 4 | 0.00186(2) | 3/4 | 0.39112(2) | 1 | 0.00784(4) |
| Se3 | 4 | 0.32801(2) | 1/4 | 0.48446(2) | 1 | 0.00918(4) |
| Atom | ||||
|---|---|---|---|---|
| Sb1 | 0.01182(6) | 0.00899(6) | 0.01915(7) | -0.00246(5) |
| Cr1 | 0.00735(12) | 0.00616(12) | 0.00752(13) | -0.00026(10) |
| Se1 | 0.01217(9) | 0.00866(8) | 0.00946(9) | -0.00064(7) |
| Se2 | 0.00848(8) | 0.00777(8) | 0.00726(8) | 0.00029(7) |
| Se3 | 0.00937(8) | 0.00815(8) | 0.01001(9) | 0.00127(7) |
References
- Žutić et al. (2004) I. Žutić, J. Fabian, and S. Das Sarma, Rev. Mod. Phys. 76, 323 (2004).
- Dietl (2002) T. Dietl, Semicond. Sci. Technol. 17, 377 (2002).
- Furdyna (1988) J. K. Furdyna, J. Appl. Phys. 64, R29 (1988).
- Ohno (1998) H. Ohno, Science 281, 951 (1998).
- Wang et al. (2015) Z. Wang, C. Tang, R. Sachs, Y. Barlas, and J. Shi, Phys. Rev. Lett. 114, 016603 (2015).
- Ji et al. (2013) H. Ji, R. A. Stokes, L. D. Alegria, E. C. Blomberg, M. A. Tanatar, A. Reijnders, L. M. Schoop, T. Liang, R. Prozorov, K. S. Burch, N. P. Ong, J. R. Petta, and R. J. Cava, J. Appl. Phys. 114, 114907 (2013).
- Lin et al. (2016) M.-W. Lin, H. L. Zhuang, J. Yan, T. Z. Ward, A. A. Puretzky, C. M. Rouleau, Z. Gai, L. Liang, V. Meunier, B. G. Sumpter, P. Ganesh, P. R. C. Kent, D. B. Geohegan, D. G. Mandrus, and K. Xiao, J. Mater. Chem. C 4, 315 (2016).
- Gong et al. (2017) C. Gong, L. Li, Z. Li, H. Ji, A. Stern, Y. Xia, T. Cao, W. Bao, C. Wang, Y. Wang, Z. Q. Qiu, R. J. Cava, S. G. Louie, J. Xia, and X. Zhang, Nature 546, 265 (2017).
- Huang et al. (2017) B. Huang, G. Clark, E. Navarro-Moratalla, D. R. Klein, R. Cheng, K. L. Seyler, D. Zhong, E. Schmidgall, M. A. McGuire, D. H. Cobden, W. Yao, D. Xiao, P. Jarillo-Herrero, and X. Xu, Nature 546, 270 (2017).
- Volkov et al. (1997) V. Volkov, G. V. Tendeloo, J. V. Landuyt, S. Amelinckx, E. Busheva, G. Shabunina, T. Aminov, and V. Novotortsev, J. Solid State Chem. 132, 257 (1997).
- Odink et al. (1993) D. A. Odink, V. Carteaux, C. Payen, and G. Ouvrard, Chem. Mater. 5, 237 (1993).
- Jain et al. (2013) A. Jain, S. P. Ong, G. Hautier, W. Chen, W. D. Richards, S. Dacek, S. Cholia, D. Gunter, D. Skinner, G. Ceder, and K. a. Persson, APL Materials 1, 011002 (2013).
- Tarasova et al. (2012) A. Tarasova, L. Isaenko, V. Kesler, V. Pashkov, A. Yelisseyev, N. Denysyuk, and O. Khyzhun, J. Phys. Chem. Solids 73, 674 (2012).
- Aharoni (1998) A. Aharoni, J. Appl. Phys. 83, 3432 (1998).
- Arrott (1957) A. Arrott, Phys. Rev. 108, 1394 (1957).
- Lamichhane et al. (2016) T. N. Lamichhane, V. Taufour, S. Thimmaiah, D. S. Parker, S. L. Bud’ko, and P. C. Canfield, J. Magn. Magn. Mater. 401, 525 (2016).
- Fisher (1967) M. E. Fisher, Rep. Prog. Phys. 30, 615 (1967).
- Arrott and Noakes (1967) A. Arrott and J. E. Noakes, Phys. Rev. Lett. 19, 786 (1967).
- Pramanik and Banerjee (2009) A. K. Pramanik and A. Banerjee, Phys. Rev. B 79, 214426 (2009).
- Widom (1964) B. Widom, J. Chem. Phys. 41, 1633 (1964).
- Kouvel and Fisher (1964) J. S. Kouvel and M. E. Fisher, Phys. Rev. 136, A1626 (1964).
- Lin et al. (2017) G. T. Lin, H. L. Zhuang, X. Luo, B. J. Liu, F. C. Chen, J. Yan, Y. Sun, J. Zhou, W. J. Lu, P. Tong, Z. G. Sheng, Z. Qu, W. H. Song, X. B. Zhu, and Y. P. Sun, Phys. Rev. B 95, 245212 (2017).
- Liu and Petrovic (2017) Y. Liu and C. Petrovic, Phys. Rev. B 96, 054406 (2017).
- Mermin and Wagner (1966) N. D. Mermin and H. Wagner, Phys. Rev. Lett. 17, 1133 (1966).
- Bru (2013) APEX2, Version v2013.10,, Bruker AXS Inc., Madison, Wisconsin, USA (2013).
- Sheldrick (2014) G. M. Sheldrick, Sadabs: Area-Detector Absorption Correction, Version 2014/5, Bruker AXS Inc. (2014).
- Oszlányi and Süto (2004) G. Oszlányi and A. Süto, Acta Crystallogr A 60, 134 (2004).
- Oszlányi and Süto (2008) G. Oszlányi and A. Süto, Acta Crystallogr A 64, 123 (2008).
- Petříček et al. (2014a) V. Petříček, M. Dušek, and L. Palatinus, Jana2006, The crystallographic computing system, Institute of Physics, Praha, Czech Republic (2014a).
- Petříček et al. (2014b) V. Petříček, M. Dušek, and L. Palatinus, Z. Kristallog. – Cryst. Mater. 229, 345 (2014b).
- Sheldrick (2015) G. M. Sheldrick, Acta Crystallogr C 71, 3 (2015).
- Sheldrick (2017) G. M. Sheldrick, SHELX2017, Programs for crystal structure determination, Universität Göttingen, Germany (2017).