Detection of HC5N and HC7N Isotopologues in TMC-1 with the Green Bank Telescope
Abstract
We report the first interstellar detection of DC7N and six 13C-bearing isotopologues of HC7N toward the dark cloud TMC-1 through observations with the Green Bank Telescope, and confirm the recent detection of HC515N. For the average of the 13C isotopomers, DC7N, and HC515N, we derive column densities of 1.9(2)1011, 2.5(9)1011, and 1.5(4)1011 cm-2, respectively. The resulting isotopic ratios are consistent with previous values derived from similar species in the source, and we discuss the implications for the formation chemistry of the observed cyanopolyynes. Within our uncertainties, no significant 13C isotopomer variation is found for HC7N, limiting the significance CN could have in its production. The results further show that, for all observed isotopes, HC5N may be isotopically depleted relative to HC3N and HC7N, suggesting that reactions starting from smaller cyanopolyynes may not be efficient to form HCnN. This leads to the conclusion that the dominant production route may be the reaction between hydrocarbon ions and nitrogen atoms.
1 Introduction
Carbon-chain molecules are a critically important family within the interstellar medium (ISM); they represent 40% of all detected species and play a major role in the formation of more complex chemistry. Carbon chains with interstellar detections include: carbenes (McCarthy et al., 1997), polyynes (Irvine et al., 1981; Bell et al., 1997; Snyder et al., 2006; Remijan et al., 2006), unsaturated hydrocarbons (Cernicharo et al., 2001), and the newly detected HCnO family (McGuire et al., 2017). Furthermore, it has been suggested that they may be important precursors to the formation of polycyclic aromatic hydrocarbons (PAHs) (Guzman-Ramirez et al., 2011), which are likely to be routine targets of observation when the James Webb Space Telescope is launched in 2019 (Kirkpatrick et al., 2017).
Reactions of unsaturated carbon-chain molecules (i.e. species whose available carbon valence electrons are not all bonded to atoms so that the chain contains more double and triple carbon-carbon bonds) are often efficient in the ISM, but have many product channels for which branching ratios are not known. Because of the lack of available laboratory measurements of the dominant reaction mechanisms and rate coefficients for these branching fractions, the ability to directly investigate these pathways through interstellar observations is therefore appealing. One way to probe the underlying chemistry is through the study of the isotopologues (molecules that differ only in isotopic composition (e.g. HCCCN vs H13CCCN)) and isotopomers (molecules that contain the same isotopic composition, but differ in the isotope positions (e.g. H13CCCN vs HCC13CN)) of a species. For many molecules, specific relative isotopic fractions or isotopomer configurations can possibly constrain the dominant production method or precursors.
TMC-1, one of the prototypical dark cloud cold cores, has been the subject of intense astrochemical study. Observationally, it has been the source of many new molecular detections, including a large fraction of the known unsaturated carbon-chains (Kaifu et al., 2004; Snyder et al., 2006; McCarthy et al., 2006; Remijan et al., 2006; McGuire et al., 2017). Furthermore, TMC-1 is dynamically stable, characterized by narrow line widths (0.3 km s-1), cold excitation temperatures (5-10 K), and a low line density (1 line per 200 km s-1 for reasonable integration times with the GBT), making it ideal for the unambiguous detection of new molecules. Finally, because of its simple physical history, it is an ideal source to test chemical network models (Hasegawa et al., 1992; Herbst & Millar, 2008; Ruaud et al., 2016; Majumdar et al., 2017).
Cyanopolyynes, a family of linear molecules of the form HCnN (where = 3, 5, 7, etc., henceforth) with alternating single and triple-bonded carbon atoms, have been detected in cold dark clouds (Broten et al., 1978), the expanding envelopes of evolved stars (Bell et al., 1992), and even external galaxies (Mauersberger et al., 1990). It has been shown that, unlike many carbon-chains, the 12C/13C ratio for HC5N is constant even into subsequent stages of star formation through observations of warm carbon-chain chemistry in the low-mass star-forming region L1527 (Araki et al., 2016; Taniguchi et al., 2016b). This finding implies that the formation of cyanopolyynes may occur primarily under dark cloud conditions. These species then remain as relics in subsequent stages of star formation, and have a unique underlying chemistry compared with other carbon-chain molecules. However, recent observations of a more evolved core, L134N, suggest that other formation pathways may dominate at later times (Taniguchi et al., 2017).
Of particular interest, Loomis et al. (2016) recently discussed the non-detection of HC11N, which deviates from the log-linear abundance vs molecular size trend seen for smaller cyanopolyynes (Bujarrabal et al., 1981; Bell et al., 1997; Ohishi & Kaifu, 1998; Remijan et al., 2006). Although this trend was previously thought to arise from a consistent set of gas-phase reactions that add carbons directly to smaller HCnN species (Remijan et al., 2005; Winnewisser & Walmsley, 1979; Bujarrabal et al., 1981; Fukuzawa et al., 1998), it was proposed by Loomis et al. (2016) that cyclisation processes may need to be considered to accurately explain this deviation. It is clear, therefore, that the chemistry of this family of species is not fully understood, especially at larger molecular sizes, and further study is needed.
For the cyanopolyyne family, Takano
et al. (1998) and Taniguchi
et al. (2016a) discussed the potential prominence of three formation routes, among others, for a given molecule (HCnN), which could each result in different 12C/13C fractionations. Each of these numbered mechanisms is discussed below, and, for clarity, sources of carbon atoms which could result in 13C fractionation are traced from reactants to products in example reactions in red.
Mechanism 1 - The reaction between hydrocarbon molecules and the CN radical, including
| (1) |
Here, the difference between the isotopic fractions of the CN carbon atom and the carbene CnH2 carbon atoms results in asymmetric fractionation along the chain (Herbst & Leung, 1990; Fukuzawa et al., 1998).
Mechanism 2 - Reactions of the next-smallest cyanopolyyne (e.g. HC5N vs HC3N) with hydrocarbons, such as
| (2) |
For this case, many of the isotopomers would have similar 12C/13C ratios to their corresponding isotopomer of the precursor cyanopolyyne, with potentially some small variations depending on the precursor hydrocarbon (Schiff & Bohme, 1979; Huntress, 1977).
Mechanism 3 - Reactions of nitrogen atoms and hydrocarbon ions containing the same number of carbon atoms. One such example is
| (3) |
In this scenario, 12C/13C fractionation would be set by this precursor ion. Assuming the ion’s carbon atoms are sufficiently scrambled, this manifests as no significant variations among the isopotomers’ ratios (Herbst, 1983; Herbst et al., 1984; Knight et al., 1986).
Previously, the 12C/13C fractionation had only been studied for cyanoacetylene (HC3N) and cyanodiacetylene (HC5N). For HC3N, Takano et al. (1998) found that toward TMC-1 there was a 40% abundance enhancement of the isotopomer with the 13C residing next to the nitrogen atom (HC213CN) relative to the other two species, suggesting that the primary formation route could be the neutral reactions between the abundant CN and C2H2 (Mechanism 1). This enhancement in the 13CN is thought to result from the exothermic exchange reaction given by
| (4) |
Because the reaction is exothermic, only the forward process is efficient at the cold temperatures within dark clouds, which results in an enhanced 13C fractionation in CN compared with the carbene precursors whose exchange reactions are much less efficient (Benson & Myers, 1989; Watson et al., 1976). This enhancement of 13C in CN relative to measured solar system isotopic fractions has been ubiquitously observed in Galactic molecular clouds (Milam et al., 2005).
Meanwhile, Taniguchi et al. (2016a) found that there was no significant difference in the abundance of the 13C-isotopomers of HC5N toward TMC-1, suggesting that the primary formation route for HC5N could be from reactions of N with hydrocarbon ions (such as C5H, C5H, and C5H).
It is also important to compare these results to the dominant formation routes within chemical network models. Significant work has been done for this molecular family by Loomis et al. (2016) and McGuire et al. (2017) who adapted the kida network within nautilus (Ruaud et al., 2016). At the model’s time of best agreement, multiple formation routes significantly contributed (¿30%) to the formation of cyanopolyynes, many of which do not necessarily agree with the observational constraints.
We have recently performed deep observations of TMC-1, which has resulted in the interstellar detection of several new molecules (McGuire et al., 2017). Here, we present the detection of six of the seven possible 13C-bearing isotopomers of HC7N, as well as DC7N. In addition, we confirm the recent detection of HC515N. The observations are presented in §2, a review of the laboratory spectroscopy is given in §3, the results and analysis are discussed in §4, and a discussion of the astrochemical implications is given in §5.
2 Observations
Observations, described previously by McGuire et al. (2017), toward TMC-1 were performed on the 100 m Robert C. Byrd Green Bank Telescope (GBT) in Green Bank, WV with the K-band Focal Plane Array (KFPA) along with the Versatile GBT Astronomical Spectrometer (VEGAS) spectrometer backend. The beam size varied from 32-40″across the observed frequency range, with a beam efficiency of . The VEGAS backend was configured for 187.5 MHz bandwidth and 1.4 kHz (0.02 km s-1) spectral resolution. In two separate frequency setups, a total of ten individual passbands were observed for a total of 1875 MHz of spectral coverage between 18 and 24 GHz. The observations were centred on (J2000) = 04h41m425, (J2000) = 25°41′270, with pointing corrections performed hourly with an estimated uncertainty of 2″. The system temperatures ranged between 40-80 K during the observations.
Position-switching mode was used with a 120 s ON-OFF cadence and a position 1°offset from the target. In total, each of the ten frequency windows were observed between 7.5 and 15 hours on source. Data reduction was performed using the GBTIDL package. The data were placed on the atmosphere-corrected scale (Ulich & Haas, 1976) and averaged. A polynomial fit was used to remove the baseline. Subsequent smoothing to a spectral resolution of 5.7 kHz (0.08 km s-1) improved the signal to noise ratio (SNR) in the weaker features while maintaining at least 3 channels sampling across the narrowest spectral feature observed. This resulted in final RMS noises of 3-5 mK (Table 1)
3 Spectroscopy
For the new species detected here, McCarthy et al. (2000) measured the pure rotational spectra of the isotopologues of several cyanopolyynes, including HC7N, between 6 and 17 GHz, and resolved the nitrogen hyperfine splitting. The rotational spectrum for HC515N was measured by Bizzocchi et al. (2004). The corresponding quantum transitions, frequencies (MHz), line strengths (D2), and upper-level energies (K) for transitions falling within our observational coverage are shown in Table 1.
| Species | Frequencya | c | |||||
|---|---|---|---|---|---|---|---|
| (MHz) | (km s-1) | (mK) | (km s-1) | (Debye2) | (K) | ||
| HC7N | 1716 | 19175.959 | 5.81 | 909(3) | 0.474(2) | 394.9 | 8.283 |
| 1817 | 20303.946 | 5.83 | 978(2) | 0.458(1) | 418.2 | 9.257 | |
| HC613CN | 1817 | 20071.326 | 5.84 | 12(1) | 0.36(5) | 418.2 | 9.151 |
| 1918 | 21186.389 | 5.86 | 13.2(9) | 0.46(3) | 441.4 | 10.168 | |
| 2019 | 22301.449 | 5.84 | 19(3) | 0.31(6) | 464.7 | 11.238 | |
| HC513CCN | 1716 | 19102.044 | 5.84 | 16(1) | 0.52(5) | 394.9 | 8.251 |
| HC413CC2N | 1817 | 20294.271 | 5.89 | 12(1) | 0.54(8) | 418.3 | 9.253 |
| HC313CC3N | 1716 | 19165.136 | 5.70 | 9.9(4) | 0.50(2) | 394.9 | 8.278 |
| HC213CC4N | 1716 | 19097.498 | 5.81 | 12.8(3) | 0.48(1) | 394.9 | 8.249 |
| 1817 | 20220.870 | 5.76 | 14(3) | 0.32(8) | 418.2 | 9.219 | |
| HC13CC5N | 1817 | 20063.864 | 5.80 | 9(1) | 0.51(7) | 418.1 | 9.148 |
| 2019 | 22293.157 | 5.76 | 18(3) | 0.42(8) | 464.6 | 11.234 | |
| H13CC6N | 2120 | 23168.899 | -d | 14.8d | 0.4d | 487.4 | 12.231 |
| DC7N | 1918 | 20721.873 | 5.97 | 15(3) | 0.34(7) | 441.4 | 9.945 |
| 2019 | 21812.486 | 5.84 | 12.2(6) | 0.62(4) | 464.7 | 10.992 | |
| 2120 | 22903.097 | 5.92 | 16(1) | 0.49(6) | 487.9 | 12.091 | |
| HC5N | 87, =88 | 21299.750 | 5.82 | 32(3) | 0.43(4) | 0.781 | 4.600 |
| 87, =76 | 21301.245 | 43.3 | 4.600 | ||||
| 87, =87 | 21301.261 | 5.82 | 2489(11) | 0.650(3) | 49.2 | 4.600 | |
| 87, =98 | 21301.272 | 55.9 | 4.600 | ||||
| 87, =77 | 21302.970 | 5.85 | 25(2) | 0.54(6) | 0.781 | 4.600 | |
| HC515N | 87 | 20778.180 | 5.78 | 16.9(9) | 0.46(3) | 150.0 | 4.487 |
| HC413CN | 76 | 18454.489 | 5.80 | 28(1) | 0.76(4) | 131.2 | 3.543 |
| HC313CCN | 87 | 21281.792 | 5.82 | 40(2) | 0.59(3) | 151.4 | 4.596 |
| HC213CC2N | 87 | 21279.200 | 5.81 | 42(2) | 0.67(4) | 150.0 | 4.596 |
| HC13CC3N | 76 | 18447.612 | 5.81 | 20(1) | 0.79(5) | 130.0 | 3.541 |
| H13CC4N | 87 | 20746.761 | 5.81 | 42(1) | 0.59(2) | 150.0 | 4.481 |
| DC5N | 87 | 20336.870 | 5.82 | 52(2) | 0.47(2) | 150.001 | 4.392 |
| 98 | 22878.963 | 5.86 | 59(2) | 0.54(2) | 168.729 | 5.490 | |
| aMcCarthy et al. (2000) had a 1 experimental uncertainty of 2 kHz. | |||||||
| Bizzocchi et al. (2004) had a 1 experimental uncertainty of 15 kHz. | |||||||
| b1 uncertainties from Gaussian fits are 0.5 kHz (0.08 km s-1). Given the SNR of the detected lines (3-5) | |||||||
| and the linewidth, we estimate the uncertainty in the observed line centres to be 3.7 kHz. | |||||||
| c1 uncertainty of the Gaussian fit to each line given. | |||||||
| dUpper limit of line peak set by 3RMS at transition frequency. | |||||||
| For purposes of calculations, was estimated to be 0.4 km s-1. | |||||||
4 Results and Analysis
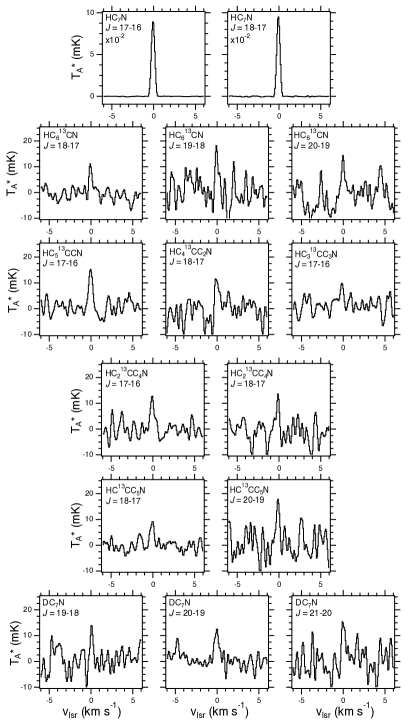
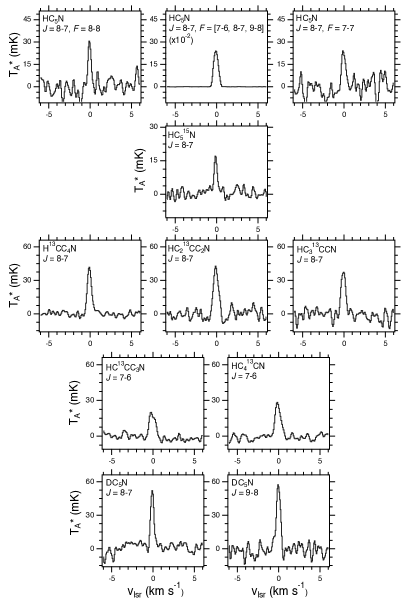
We detected, for the first time, emission from DC7N and six 13C-bearing isotopologues of HC7N. In addition, we confirm the recent detection of HC515N (Taniguchi & Saito, 2017) with the observation of the =87 transition, which was not reported in that work. For the 13C-isotopomers, at least one transition between 1716 and 2019 was detected for six of the seven isotopomers. In addition, two transitions of DC5N, two transitions of HC7N, and a set of 5 hyperfine components of a single for HC5N were also detected. Spectra for these species are shown in Figures 1 and 2. The lines are seen at a 5.8 km s-1, typical of molecules in this source (Kaifu et al., 2004). For the one non-detected isotopomer, H13CC6N, an upper limit on the column density was derived whose value is consistent with the other detected isotopomers.
In TMC-1, the molecular emission can be well described by a single excitation temperature between 5-10 K (Remijan et al., 2006; Loomis et al., 2016). To calculate the column density, we use the formalism described in Hollis et al. (2004) and given by
| (5) |
Here is the column density (cm-2), is the partition function (see below), is the upper state energy of a given transition (K), is the excitation temperature (K), is the transition rest frequency (Hz), is the intrinsic line strength, is the transition dipole moment squared (J cm3), is the peak intensity (K), is the fitted FWHM linewidth (cm s-1), is the beam efficiency ( at 20 GHz for the GBT), and is the continuum background temperature (2.73 K). Because of the narrow range of upper level energies of the observed transitions, we assume that K for all species.
The total partition function accounts for both the rotational and vibrational contributions, as described by
| (6) |
While the rotational component dominates at interstellar conditions, cyanopolyynes can have values that can be affected by the vibrational component at even modest excitation temperatures. We utilised the calculated harmonic stretching vibrational wavenumbers () for HC7N by Botschwina et al. (1997), with the assumption that the partition function will not be significantly impacted by the presence or location of 13C or D in the molecule. The lowest three energy levels for HC7N are 62, 163, and 280 cm-1 (92, 241, and 415 K, respectively). At 7 K, the change from the vibrational contribution is negligible ; this correction becomes 1% at K. Similar behavior is seen for HC5N isotopologues.
Values of and were determined by Gaussian fits to the lines (see Table 1). For species with more than one transition, a single column density was obtained based on a least-squares fit to reproduce the integrated line intensities, with a weighting based on the SNR of the lines. The calculated column densities are summarized in Table 2.
| Species | Isotopic Ratio† | ‡ | ||
|---|---|---|---|---|
| ( cm-2) | () | |||
| HC7N | 139(36) | 139(36) | - | - |
| HC613CN | 1.7(6) | 1.7(6) | 83(34) | 85(35) |
| HC513CCN | 2.6(7) | 2.6(7) | 52(20) | 53(20) |
| HC413CC2N | 2.1(7) | 2.1(7) | 66(27) | 67(28) |
| HC313CC3N | 1.6(4) | 1.6(4) | 88(32) | 90(33) |
| HC213CC4N | 1.8(5) | 1.8(5) | 78(31) | 79(32) |
| HC13CC5N | 2.0(7) | 2.0(7) | 71(31) | 73(31) |
| H13CC6N | 2.2 | 2.2 | 63 | 64 |
| DC7N | 2.5(9) | 2.5(9) | 56(24) | 61(29) |
| Weighted 13C Average Value | 1.9(2) | 1.9(2) | 73(21) | 75(21) |
| Total 13C-isotopologue⋆ | 13.3(1.8) | 13.3(1.8) | 9.6(2.7)%⊖ | 9.4(2.7)%⊖ |
| HC5N | 492(122) | 492(122) | - | - |
| HC515N | 1.5(4) | 1.5(4) | 326(109) | 344(114) |
| HC413CN | 4.6(9) | 4.6(9) | 107(35) | 108(36) |
| HC313CCN | 4.4(9) | 4.4(9) | 111(37) | 113(38) |
| HC213CC2N | 5.3(1.2) | 5.3(1.2) | 93(31) | 94(32) |
| HC13CC3N | 3.4(7) | 3.4(7) | 144(47) | 146(49) |
| H13CC4N | 4.8(1.0) | 4.8(1.0) | 102(33) | 103(34) |
| DC5N | 5.3(1.2) | 5.3(1.2) | 92(30) | 96(32) |
| Weighted 13C Average Value | 4.4(4) | 4.4(4) | 111(30) | 113(31) |
| Total 13C-isotopologue⋆ | 22(3) | 22(3) | 4.5(1.2)%⊖ | 4.4(1.2)%⊖ |
| † Column density ratio of most common isotopologue vs less common species given | ||||
| (e.g. 12C/13C; H/D; 14N/15N) | ||||
| ‡ Isotope ratio, including the all other singly-substituted isotopologues (see section 4.2) | ||||
| ⋆ Calculated by 7 times the weighted average of 13C values | ||||
| ⊖ Percent of total molecular density of HCnN containing a single 13C substitution | ||||
To calculate the uncertainties, we considered both the measurements and analysis. The absolute flux calibration procedure for the GBT is estimated to have 20% uncertainty. We include 1 uncertainties in and derived from the Gaussian fits. Due to our assumption of a single excitation temperature of = 7 K, we find that variations of previously calculated excitation temperatures (5-10 K) result in between 15-20% uncertainty in the resulting column densities for HC7N isotopologues and 5% for HC5N isotopologues. We assume that the source is significantly extended beyond the GBT beam, and thus the contributions to the uncertainty from pointing are trivial, and no beam filling correction is applied. The resulting column densities, with all uncertainties added in quadrature, are given in Table 2.
For the purposes of calculating the molecular abundances, we used the H2 column density derived by Gratier et al. (2016) from observations from Kaifu et al. (2004) of =1022 cm-2, with the caveat that the beam size of the survey performed with the Nobeyama 45m dish telescope is about twice that of the GBT, and thus a non-isotropic distribution of H2, or any molecular species, may result in different column densities derived between the observations. These abundances are also given in Table 2. In addition to comparing the relative column densities of the isotopomers, an average value across all detected 13C-isotopomers is also calculated. The column density for each detected species was averaged, weighted by the error of each value, and are also tabulated in Table 2. These calculated values are compared to previous observations in Table 3.
4.1 Treatment of Hyperfine Splitting
For HC5N, the brightest detected signal is a blend of three hyperfine components. Two additional, weaker =0 hyperfine components are resolved. The central, bright feature has been shown to be slightly optically thick (Gratier et al., 2016). Our calculation of the column density was therefore derived using the two, optically-thin hyperfine components, yielding a value of 5(1)1013 cm-2, in agreement with the previous work (MacLeod et al., 1981; Gratier et al., 2016; Taniguchi et al., 2016a).
For all other species studied here, the hyperfine components are unresolved. As such, for the purposes of calculating column densities, the hyperfine splitting is not considered and the integrated intensity is used instead. This likely slightly overestimates the linewidths due to the blending of hyperfine components. However, this is still a reasonable assumption, as the lines are well-modeled by a single Gaussian lineshape, and thus will not significantly impact the resulting column densities, which are calculated via the integrated intensity in Equation 5.
4.2 Calculation of Line Ratios and Total Values
Relative isotopic ratios calculated for H/D, 12C/13C, and 14N/15N are tabulated in Table 2. It should be noted that none of the uncertainties described above for determining the column densities should cancel out in the calculation of the ratios, as the uncertainty in the absolute flux calibration comes from the time and frequency variability of the calibrator source. For HC7N, where we lack a detection of H13CC6N, we calculate a total column density of all 13C-substituted isotopomers by scaling the average column density for the isotopologue by the number of isotopomers, which is equal to the number of carbon atoms in the molecule..
As discussed in Langston & Turner (2007), the presence of isotopologues affects the observed abundances of the main isotopic species, especially for increasingly complex molecules. As the number of atoms in a species increases, so does the probability that any given molecule will contain at least a single isotope-substituted atom. This would be most apparent in fullerenes like C60, where a Galactic 12C/13C ratio of 68, or 1.5%, (Milam et al., 2005) would result in 60% of all C60 containing, at least one 13C substitution. Similarly, it may be important to consider the size of the molecule when comparing the total isotopologue fraction. Given the same ISM ratio and purely 13C-substitution, and no additional chemical bias, the larger cyanopolyynes would be expected to have the following total singly-substituted 13C fractional abundances: HC5N (7.2%), HC7N (10%), HC9N (12%), HC11N (15%).
![[Uncaptioned image]](/html/1711.07495/assets/x3.png)
Given the non-trival fraction of isotopologues for a given large species, as the observational capabilities improve it will likely be important to consider their abundances when calculating isotopic ratios. For the purposes of comparing to standard ISM values, a more accurate ratio for fractionation would be (taking 15N of HC5N as an example)
| (7) |
Here, it is assumed that doubly-substituted isotopologues do not contribute significantly yet to the ratio, which may not be valid for species as large as C60. In addition to the standard column density ratio given, this additional value is also given in Table 2, even though the relative differences (10%) are still well within the observational uncertainties. As chemical models increase their molecular complexity, it will become increasing important to consider the isotopologues of large molecules, as well as their precursor species. This is already shown by (Majumdar et al., 2017) on the modeling of deuterated species toward TMC-1, where the robust inclusion of deuterated chemistry was found to alter the chemical time-scales by up to a factor of 3. This effect will also be more apparent when species contain at least one atom with a higher natural percentage in non-standard isotopes, such as S and Cl and species common in silicate grain precursors (Mg, Si, Ti, Fe). While the upper limit of this effect will likely decrease the modeled abundances by no more than roughly factor of 2, it is certainly an important effect to consider in the future.
5 Discussion
Constraining the chemistry for larger cyanopolyynes requires the consideration of both the possible formation routes, as described in §1, and the many precursor species, whose isotopic ratios across the literature are summarized in Table 3. The analysed isotopic ratios in this work agree reasonably well with previous observations or lower limits for the same species. The general spread in values for a given species may be attributable to the spread in excitation temperatures used (5-10 K) or inconsistent treatments of both the optical depths and hyperfine structure in the column density calculations for HC5N and HC7N. For HC3N, the relative enhancement of 12C/13C for HC213CN and the agreement of the 14N/15N ratio with Galactic measurements of CN both indicate that this species may be efficiently produced through the reaction containing CN, as described in Mechanism 1 (Takano et al., 1998). Taniguchi et al. (2016a) showed that HC5N does not show this same trend. Through the comparison of the various isotopologues studied here, it is further possible to differentiate among the three mechanisms described in §1 for both HC5N and HC7N.
In contrast to the 40% enhancement of HC213CN over HC13CCN and H13CC2N (Takano et al., 1998), the relative isotopic ratios of all 13C isotopomers for both HC7N and HC5N were all consistent with their respective average values within our uncertainties. The ratio of column densities of the HCn-113CN isotopomers to the weighted average 13C-isotopolouge values can be used to more explicitly test the significance of Mechanism 1 in the formation of larger cyanopolyynes. Specifically the column densities of HC413CN and HC613CN agree with their respective 13C average values to 10%. Because both HC5N and HC7N do not display the HCn-113CN enhancement, this provides evidence that larger cyanopolyynes are not produced from CN to the same extent as HC3N. Even though H13CC6N was not detected here, the formation route from CN should not significantly alter the 12C/13C isotopic ratio of this molecule and so does not conflict with this conclusion. Thus, we can eliminate Mechanism 1 as the dominant pathway for both HC5N and HC7N.
As seen Table 3, while still in agreement within the uncertainties, all isotopologues of HC5N are found to be depleted (i.e. larger isotopic ratios) relative to HC3N and HC7N, showing that this isotopic depletion seen in Taniguchi et al. (2016a) does not continue for HC7N. While the average 12C/13C ratio for HC7N agrees very well with ratios corresponding to HCN, Galactic measurements of CN, and the two non-enhanced isotopomers of HC3N, the average HC5N 12C/13C ratio is 50% larger than any of these values. For HC15N, the 14N/15N ratio is much larger compared to HC3N and Galactic measurements of CN, which have been shown to have enhanced 15N isotopologue abundances relative to average ISM values (Roueff et al., 2015; Ritchey et al., 2015; Hily-Blant et al., 2013). Similarly, the DC5N abundance is diminished by roughly the same percentage relative to HC7N as the 13C-substituted isotopologues in our data. However, large uncertainties due to the SNR of our data and inconsistent treatment of the excitation temperature and hyperfine splitting across the literature results in a large spread of H/D for any given species, making this trend less certain than for the 12C/13C and 14N/15N ratios. Considering all of this, the mixture of formation and destruction methods for cyanopolyynes appears to not be consistent across the molecular family.
More specifically, because the 12C/13C ratio in HC5N is not in agreement with the ratios observed for HC3N and HC7N, the carbon fractionation in these species does not appear to be inherited from the next-smallest cyanopolyyne, as would be predicted by Mechanism 2. Given that Mechanism 2 is inefficient for HC5N and HC7N production, the only remaining formation pathway proposed is the reaction of hydrocarbon ions with nitrogen atoms (Mechanism 3), and thus is the best prediction for the dominant production route for large cyanopolyynes. If the trends discussed here are found to be true, a dedicated investigation of the underlying chemistry of hydrocarbon ions and undetected CnH isotopologues may reveal a unique 13C distribution and provide constraints on the formation of cyanopolyynes and other carbon-chain molecules.
6 Conclusions
The interstellar detections of DC7N, six of the seven 13C-bearing isotopologues of HC7N, and HC515N are reported toward TMC-1 with observations using the GBT. Column densities for each of the detected species and an upper limit for H13CC6N, were calculated, as well as the resulting isotopic ratios for each species. From analysis of these ratios, we find that:
-
•
There are no significant 12C/13C variations among the isotopomers of both HC5N and HC7N, implying that CN is not an important precursor for their formation.
-
•
For all isotopologues studied in this work, while the values still agree within our uncertainties, HC5N is found to be isotopically depleted relative to other HCnN molecules and this trend does not continue onto HC7N. Given also that the 13C and 15N ratios for HC3N and HC7N agree very well, there is evidence that cyanopolyynes are not efficiently formed from their next-smallest molecular family member, HCn-2N
-
•
As a result, the only remaining significant formation route for HC5N and HC7N is the reaction of hydrocarbon ions and nitrogen atoms
Acknowledgements
A.M.B. is a Grote Reber Fellow, and support for this work was provided by the NSF through the Grote Reber Fellowship Program administered by Associated Universities, Inc./National Radio Astronomy Observatory and the Virginia Space Grant Consortium. E. H. thanks the National Science Foundation for support of his astrochemistry program. S.V.K. acknowledges support from Basic Research Program P-7 of the Presidium of the Russian Academy of Sciences. A.M.B. thanks C.N. Shingledecker for helpful discussions on chemical models for cyanopolyynes. B.A.M. thanks K. L. Lee for helpful discussions regarding vibrational energy levels. The National Radio Astronomy Observatory is a facility of the National Science Foundation operated under cooperative agreement by Associated Universities, Inc. The Green Bank Observatory is a facility of the National Science Foundation operated under cooperative agreement by Associated Universities, Inc. The authors thank the anonymous referee for comments that improved the quality of this manuscript.
References
- Araki et al. (2016) Araki M., Takano S., Sakai N., et al., 2016, ApJ, 833, 291
- Bell et al. (1992) Bell M. B., Avery L. W., MacLeod J. M., et al., 1992, ApJ, 400, 551
- Bell et al. (1997) Bell M. B., Feldman P. A., Travers M. J., et al., 1997, ApJ, 483, L61
- Benson & Myers (1989) Benson P. J. & Myers P. C., 1989, ApJS, 71, 89
- Bizzocchi et al. (2004) Bizzocchi L., Degli Esposti C., & Botschwina P., 2004, Journal of Molecular Spectroscopy, 225, 145
- Botschwina et al. (1997) Botschwina P., Horn M., Markey K., et al., 1997, Molecular Physics, 92, 381
- Broten et al. (1978) Broten N. W., Oka T., Avery L. W., et al., 1978, ApJ, 223, L105
- Bujarrabal et al. (1981) Bujarrabal V., Guelin M., Morris M., et al., 1981, A&A, 99, 239
- Cernicharo et al. (2001) Cernicharo J., Heras A. M., Tielens A. G. G. M., et al., 2001, ApJ, 546, L123
- Fukuzawa et al. (1998) Fukuzawa K., Osamura Y., & Schaefer III H. F., 1998, ApJ, 505, 278
- Gratier et al. (2016) Gratier P., Majumdar L., Ohishi M., et al., 2016, ApJS, 225, 25
- Guzman-Ramirez et al. (2011) Guzman-Ramirez L., Zijlstra A. A., Níchuimín R., et al., 2011, MNRAS, 414, 1667
- Hasegawa et al. (1992) Hasegawa T. I., Herbst E., & Leung C. M., 1992, ApJS, 82, 167
- Herbst (1983) Herbst E., 1983, ApJS, 53, 41
- Herbst & Leung (1990) Herbst E. & Leung C. M., 1990, A&A, 233, 177
- Herbst & Millar (2008) Herbst E. & Millar T. J., 2008, The Chemistry of Cold Interstellar Cloud Cores in Low Temperatures and Cold Molecules. World Scientific
- Herbst et al. (1984) Herbst E., Adams N. G., & Smith D., 1984, ApJ, 285, 618
- Hily-Blant et al. (2013) Hily-Blant P., Bonal L., Faure A., et al., 2013, Icarus, 223, 582
- Hollis et al. (2004) Hollis J. M., Jewell P. R., Lovas F. J., et al., 2004, ApJ, 613, L45
- Howe et al. (1994) Howe D. A., Millar T. J., Schilke P., et al., 1994, MNRAS, 267, 59
- Huntress (1977) Huntress Jr. W. T., 1977, ApJS, 33, 495
- Ikeda et al. (2002) Ikeda M., Hirota T., & Yamamoto S., 2002, ApJ, 575, 250
- Irvine et al. (1981) Irvine W. M., Hoglund B., Friberg P., et al., 1981, ApJ, 248, L113
- Kaifu et al. (2004) Kaifu, N., Ohishi, M., Kawaguchi, K., et al., 2004, PASJ, 56, 69
- Kirkpatrick et al. (2017) Kirkpatrick, A., Alberts, S., Pope, A., et al., 2017, PASJ 849, 111
- Knight et al. (1986) Knight J. S., Freeman C. G., McEwan M. J., et al., 1986, MNRAS, 219, 89
- Langston & Turner (2007) Langston G. & Turner B., 2007, ApJ, 658, 455
- Loomis et al. (2016) Loomis, R. A., Shingledecker, C. N., Langston, G., et al., 2016, MNRAS, 463, 4175
- MacLeod et al. (1981) MacLeod J. M., Avery L. W., & Broten N. W., 1981, ApJ, 251, L33
- Majumdar et al. (2017) Majumdar, L., Gratier, P., Ruaud, M., et al., 2017, MNRAS, 466, 4470
- Marty et al. (2011) Marty B., Chaussidon M., Wiens R. C., et al., 2011, Science, 332, 1533
- Mauersberger et al. (1990) Mauersberger R., Henkel C., & Sage L. J., 1990, A&A, 236, 63
- McCarthy et al. (1997) McCarthy M. C., Travers M. J., Kovács A., et al., 1997, ApJS, 113, 105
- McCarthy et al. (2000) McCarthy M. C., Levine E. S., Apponi A. J., et al., 2000, JMoSp, 203, 75
- McCarthy et al. (2006) McCarthy M. C., Gottlieb C. A., Gupta H., et al., 2006, ApJ, 652, L141
- McGuire et al. (2017) McGuire B. A., Burkhardt A. M., Shingledecker C. N., et al., 2017, ApJ, 843, L28
- Meibom et al. (2007) Meibom A., Krot A. N., Robert F., et al., 2007, ApJ, 656, L33
- Milam et al. (2005) Milam S. N., Savage C., Brewster M. A., et al., 2005, ApJ, 634, 1126
- Ohishi & Kaifu (1998) Ohishi M. & Kaifu N., 1998, Faraday Discuss., 109, 205
- Remijan et al. (2005) Remijan A. J., Wyrowski F., Friedel D. N., et al., 2005, ApJ, 626, 233
- Remijan et al. (2006) Remijan A. J., Hollis J. M., Snyder L. E., et al., 2006, ApJ, 643, L37
- Ritchey et al. (2015) Ritchey A. M., Federman S. R., & Lambert D. L., 2015, ApJ, 804, L3
- Roueff et al. (2015) Roueff E., Loison J. C., & Hickson K. M., 2015, A&A, 576, A99
- Ruaud et al. (2016) Ruaud M., Wakelam V., & Hersant F., 2016, MNRAS, 459, 3756
- Schiff & Bohme (1979) Schiff H. I. & Bohme D. K., 1979, ApJ, 232, 740
- Schloerb et al. (1981) Schloerb F. P., Snell R. L., Langer W. D., et al., 1981, ApJ, 251, L37
- Snyder et al. (2006) Snyder L. E., Hollis J. M., Jewell P. R., et al., 2006, ApJ, 647, 412
- Takano et al. (1998) Takano, S., Masuda, A., Hirahara, Y., et al., 1998, A&A, 329, 1156
- Taniguchi & Saito (2017) Taniguchi K. & Saito M., 2017, PASJ, 69, L7
- Taniguchi et al. (2016a) Taniguchi K., Ozeki H., Saito M., et al., 2016a, ApJ, 817, 147
- Taniguchi et al. (2016b) Taniguchi K., Saito M., & Ozeki H., 2016b, ApJ, 830, 106
- Taniguchi et al. (2017) Taniguchi K., Ozeki H., & Saito M., 2017, ApJ, 846, 46
- Turner (2001) Turner B. E., 2001, ApJS, 136, 579
- Ulich & Haas (1976) Ulich B. L. & Haas R. W., 1976, ApJS, 30, 247
- Watson et al. (1976) Watson W. D., Anicich V. G., & Huntress Jr. W. T., 1976, ApJ, 205, L165
- Winnewisser & Walmsley (1979) Winnewisser G. & Walmsley C. M., 1979, Ap&SS, 65, 83