Gemini IFU, VLA and HST observations of the OH Megamaser galaxy IRASF23199+0123: the hidden monster and its outflow
Abstract
We present Gemini Multi-Object Spectrograph (GMOS) Integral field Unit (IFU), Very Large Array (VLA) and Hubble Space Telescope (HST) observations of the OH Megamaser (OHM) galaxy IRASF23199+0123. Our observations show that this system is an interacting pair, with two OHM sources associated to the eastern (IRAS 23199E) member. The two members of the pair present somewhat extended radio emission at 3 and 20 cm, with flux peaks at each nucleus. The GMOS-IFU observations cover the inner 6 kpc of IRAS23199E at a spatial resolution of 2.3 kpc. The GMOS-IFU flux distributions in H and [N ii]6583 are similar to that of an HST [N ii]+H narrow-band image, being more extended along the northeast-southwest direction, as also observed in the continuum HST F814W image. The GMOS-IFU H flux map of IRAS 23199E shows three extranuclear knots attributed to star-forming complexes. We have discovered a Seyfert 1 nucleus in this galaxy, as its nuclear spectrum shows an unresolved broad (FWHM2 170 km s-1) double-peaked H component, from which we derive a black hole mass of MBH= 3.8 M⊙. The gas kinematics shows low velocity dispersions () and low [N ii]/H ratios for the star-forming complexes and higher and [N ii]/H surrounding the radio emission region, supporting interaction between the radio-plasma and ambient gas. The two OH masers detected in IRASF23199E are observed in the vicinity of these enhanced regions, supporting their association with the active nucleus and its interaction with the surrounding gas. The gas velocity field can be partially reproduced by rotation in a disk, with residuals along the north-south direction being tentatively attributed to emission from the front walls of a bipolar outflow.
keywords:
galaxies: ISM – galaxies:ULIRGs – galaxies: dynamics – galaxies: individual (IRASF23199+0123)1 Introduction
(Ultra)luminous infrared galaxies ([U]LIRGs) are among the most luminous objects in the universe showing infrared (IR) luminosities of L L⊙. These objects are believed to represent a key stage in the evolution process of galaxies in which tidal torques associated with mergers drive gas into the galaxy core, leading to the feeding/triggering of nuclear starbursts or the fuelling of embedded active galactic nuclei (AGN - e.g. Sales et al., 2015).
These merging systems provide a conducive environment for OH maser emission and approximately 20% of [U]LIRGs contain extremely luminous OH masers, emitting primarily in the 1667 and 1665 MHz lines with luminosities 102-4 L⊙ (Lo, 2005; Darling & Giovanelli, 2002). The OH megamasers (OHMs) are commonly associated to merging systems, but the environment that produces this phenomenon is still not completely understood. Many OHM hosts present a composite spectrum, showing both AGN and starburst features. A possible explanation for these features is that they originate in a central AGN, contaminated by emission of circum-nuclear star-forming regions, as the sampling of the observations usually corresponds to more than one kpc at the galaxies. Alternatively, the OHM galaxies could represent a transition stage between a starburst and the eruption of an AGN, as suggested by Darling & Giovanelli (2006).
Considering the above scenario, it becomes relevant to investigate the nature of the gas ionization source of OH megamaser galaxies. In this paper, we present Gemini Multi-Object Spectrograph (GMOS) Integral Field Unit (IFU) observations, VLA continuum data and Hubble Space Telescope (HST) narrow and broad band images of the galaxy IRASF23199+0123, which is an interacting pair of ULIRGs that presents OH megamaser emission. This galaxy is part of a sample of 15 OH Megamaser galaxies, for which we have already HST images from a project that has the overall goal of relating the merger state and OH maser properties to AGN and Starburst nuclear activity. We have selected targets for IFU observations from the 15 galaxies observed with HST, on the basis of the morphology revealed by the images. The present paper is a pilot study based on multiwavelength observations, aimed to study the gas kinematics and excitation of one OH Megamaser galaxy and that we hope to extend to the whole sample.
IRASF23199+0123 has a redshift (Darling & Giovanelli, 2006), corresponding to a distance of 558 Mpc for which 1′′ corresponds to 2.7 kpc at the galaxy, assuming a Hubble constant of km s-1 Mpc-1. Its OH maser emission was first detected in the Arecibo survey, that observed 52 objects with (Darling & Giovanelli, 2001). Darling & Giovanelli (2006) used spectroscopic data obtained with the Palomar 5 m telescope with the Double Spectrograph in order to perform an optical spectroscopic study of the properties of the sample of the Arecibo survey and identified the nuclear emission of IRASF23199+0123 as being due to a Seyfert 2 nucleus, based on emission-line ratios.
Our GMOS-IFU data comprise observations of the central region of the eastern galaxy of the IRASF23199+0123 pair and our aim is to map the distribution and kinematics of the optical line emitting gas and investigate the excitation mechanism of the nuclear emission. This is the first time that OH megamaser galaxies have been observed with an Integral Field Spectrograph, allowing a two-dimensional look at the gas excitation and kinematics in detail. This paper is organized as follows. Section 2 describes the observations and data reduction procedure and section 3 explains the emission-line fitting process and present maps for the emission-line flux distributions and kinematics, as well as the HST and VLA radio continuum images, while in section 4 the results are discussed. Finally, the conclusions of this work are presented in section 5.
2 Observations and data reduction
2.1 VLA Radio Continuum data
We observed IRASF23199+0123 with the Karl G. Jansky Very Large Array (VLA) on Apr 20, 2014. The observations included X-band (8–10 GHz) continuum, L-band (1–2 GHz) continuum, and L-band spectral line observations of the redshifted OH (1665/1667 MHz) maser lines. The L-band and X-band observations comprised respectively three and one 10-minutes scans, alternating with 3-minute scans of the phase calibrator, J2320+0513. We observed the source 3C48 in both X-band and L-band for flux and bandpass calibration.
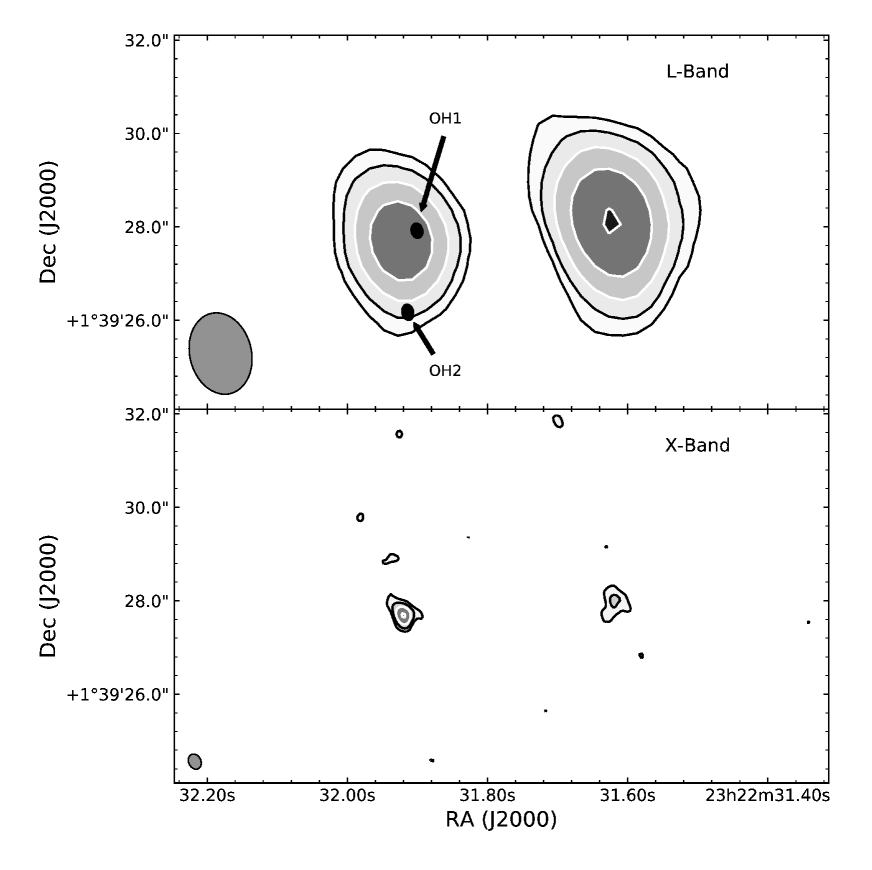
The VLA pipeline in CASA (McMullin et al., 2007), was used for data reduction. This includes initial data flagging and phase, flux and bandpass calibrations. The continuum images were generated using multi-frequency synthesis (e.g. Conway et al., 1990; Rau & Cornwell, 2011) with natural weighting and deconvolved using the Cotton-Schwab variant of the CLEAN algorithm (Schwab, 1984). Imaging included simultaneous deconvolution of neighbouring radio sources within the primary beam. We applied three rounds of phase-only self-calibration based on CLEAN models for the radio continuum (self-calibration is reviewed by Pearson & Readhead (1984)). For the L-band continuum image, the restoring beam is 169 128, PA 14∘, and the background rms is 0.024 mJy beam-1. The restoring beam of the X-band continuum image is 03390260, PA 29∘, and the background rms is 0.0093 mJy beam-1. The radio continuum images are presented in Figure 2.
The spectral line visibilities were continuum subtracted in two steps. First, we produced CLEAN continuum models based on line-free channels, and the CLEAN models were subtracted from the observed visibilities. Second, we removed any residual continuum using the CASA task uvcontsub; the continuum was determined by averaging visibility spectra over line-free channels. The continuum-subtracted, spectral line data cube was produced using standard Fourier inversion and CLEAN deconvolution. The expected line width of the 1667 MHz feature is 0.68 MHz (Darling & Giovanelli, 2001); therefore, to improve the signal-to-noise, we binned the spectral line data to 0.23 MHz channels (roughly line width). The restoring beam of the OH spectral line cube is 177 136, PA 14∘, and the typical background rms for a single 0.23 MHz channel is 0.44 mJy beam-1.
2.2 Hubble Space Telescope data
HST images of IRASF23199+0123 were acquired using the Advanced Camera for Surveys (ACS) with the broad-band filter F814W, the narrow-band filter FR656N and medium-band FR914M filter as part of a snapshot survey program to observe a sample of OHMGs (Program id 11604; PI: D.J. Axon). The total integration time was 600 s in the broad band (I) F814W filter, 200 s in the medium-band filter and 600 s in the narrow band H FR656N filter. The bandpass of the FR656N narrow band filter includes both H and [Nii] emission lines. We have processed the final images in order to remove cosmic rays using IRAF task (van Dokkum, 2001). The continuum free H[Nii] image of IRASF23199+0123 was constructed according to the following the steps: (i) the count rates of a few stars were obtained in both the medium (FR914M) and narrow band (FR656N) ramp filter images; (ii) from the count rate ratios the mean scaling factor was computed and applied to the medium band FR914M image; (iii) the scaled FR914M image was then subtracted from the narrow-band FR656N image. We next visually inspected our continuum subtracted H[Nii] image to assure that the residual fluxes of foreground stars were negligible within the uncertainties. This procedure results in typical flux uncertainties of 5-10% (see Hoopes et al., 1999; Rossa & Dettmar, 2000, 2003).
The HST images (see Fig. 4) show for the first time that IRASF23199+0123 is indeed an interacting pair and we have obtained IFS of the eastern member of the par (hereafter IRAS23199E).
2.3 GMOS IFU data
IRAS23199E was observed using the GMOS (Hook et al., 2004) IFU (Allington-Smith et al., 2002) as part of the program GS-2013B-Q-86 (PI: D. Sales). Only the eastern nucleus was observed, as it presents a steep continuum flux distribution and with bright guide stars available in the GMOS patrol field. The major axis of the IFU was oriented along position angle , approximately along the major axis of the galaxy. The total on source exposure time was 4800 s divided into 4 individual exposures of 1200 s each. The observations were performed on August 29, 2013 using the B600 grating with the IFU in the one slit mode, in combination with the GG455 filter. This setup resulted in an angular coverage of 5035, covering the spectral region from 450 nm to 750 nm at a spectral resolution of 1.7 Å, as obtained from the measurement of the full width at half maximum (FWHM) of typical emission lines of the Ar lamp spectrum used for the wavelength calibration.
The data reduction process was performed using routines of the GEMINI package in the Image Reduction and Analysis Facility (IRAF, Tody, 1986, 1993) software and followed the standard procedure of spectroscopic data reduction (Lena, 2014). First, we subtracted the bias level from each image, performed flat-fielding and trimming. Then, we applied wavelength calibration to the data using the spectra of arc lamps as references and subtracted the sky emission. Finally, we performed flux calibration using a sensitivity function obtained from the spectrum of the H600 photometric standard star observed during the same night of the object observations.
Finally, datacubes for each individual exposures were created at an angular sampling of 0101, which were then median combined using the IRAF gemcombine task to obtain the final datacube for the object. The peak of the continuum emission was used as a reference during the mosaicking of the individual datacubes and we used the avsigclip algorithm for bad pixel/cosmic ray removal. We estimated the angular resolution as 085 from the measurement of the FWHM of the flux distribution of field stars present in the acquisition image of the galaxy. This angular resolution corresponds to 2.3 kpc at the galaxy for its adopted distance (Mpc).
In order to remove noise from the final datacube, we performed a spatial filtering using a Butterworth bandpass filter (Gonzalez & Woods, 2002; Menezes et al., 2014, 2015) via the IDL routine 111The routine is available at , which allows the choice of the cut-off frequency () and the order of the filter . A low value of (e.g. 1) is close to a Gaussian filter, while a high value (e.g. 10) corresponds to an ideal filter. We used and Ny, chosen by comparing the filtered cube with the original one. For lower values of , besides the removal of spatial noise, the filter excludes also emission from the galaxy, while for larger values of the filtering procedure is not efficient. The filtering process does not change the angular resolution of the data and all measurements presented in the forthcoming sections were done using the filtered cube.
3 Results
3.1 H+[N ii] GMOS-IFU spectra
In order to map line fluxes, line-of-sight velocity () and velocity dispersion () of the emitting gas, we fitted the emission-line profiles of H and [N ii]6548,6583 with Gaussian curves. The fitting was performed using modified versions of the line-PROfile FITting (profit) routine (Riffel et al., 2010), which provides as outputs the emission-line flux, the centroid velocity, the velocity dispersion and their corresponding uncertainties. Besides the [N ii]+H emission lines, the nuclear spectrum includes also the [O i]6300.3 emission line, which shows a similar profile to that of the [N ii] and H narrow components, being well reproduced by a single Gaussian curve.
The fitting process for the H and [N ii]6548,6583 emission lines was performed simultaneously. We noticed that in the inner 08 radius (corresponding to about two resolution elements), the fitting of a single Gaussian component for each emission-line does not reproduce the observed profile, while at larger distances from the nucleus a single component provides a good fit. Thus, at locations farther then 08 from the nucleus (defined as the location of the peak of the continuum emission) we fitted the H+[N ii] complex using one Gaussian per line, adopting the following constraints: (i) we kept tied the kinematics of the [N ii] lines, such that the two lines have the same velocity and velocity dispersion, and (ii) fixed the [N ii]/[N ii] intensity ratio to its theoretical value (3). The underlying continuum was fitted by a linear function.
Within 08 from the nucleus, we tested two possibilities for the fit to the H+[N ii] complex. In the first, we fitted the line profiles using four Gaussian curves, in order to include a broad component to represent H. The resulting fit does not reproduce the observed profiles adequately. In the second fit, the [N ii] lines were fitted by a single Gaussian component, while the H profile was fitted by the same narrow component plus two broad components. This procedure resulted in a better fit to the profiles. As the presence of two broad components is restricted to the nucleus and the corresponding emission is not resolved, we propose that they actually represent a single double-peaked line originating in the Broad Line Region (BLR). Such double-peaked components are not uncommon in AGN (e.g. Storchi-Bergmann et al., 2017).
In Figure 1 we show the resulting fit of the nuclear spectrum, where the observed profiles are shown in black, the best fit model in red and the individual components as dotted blue lines. As the emission of the BLR is not resolved, the width and central wavelength of each broad component as well as their relative fluxes were kept fixed for all spaxels, while their amplitudes were allowed to vary to enable for smearing by the seeing. The values of the centroid velocities and velocity dispersions were obtained by fitting an integrated spectrum of the inner 08. The centroid velocities relative to the systemic velocity are 416 km s-1and 668 km s-1for the blueshifted and redshifted components, respectively. The corresponding velocity dispersions are km s-1 for the blue component and km s-1 for the red component. In the hypothesis described above that these two components represent a single double-peaked line, this line profile has a full-width at half maximum of 2 170 km s-1. The systemic velocity adopted in this paper is =37 9472 km s-1 (corrected for the heliocentric rest frame), as derived by the modelling of the gas velocity field as discussed in Sec. 4.3.
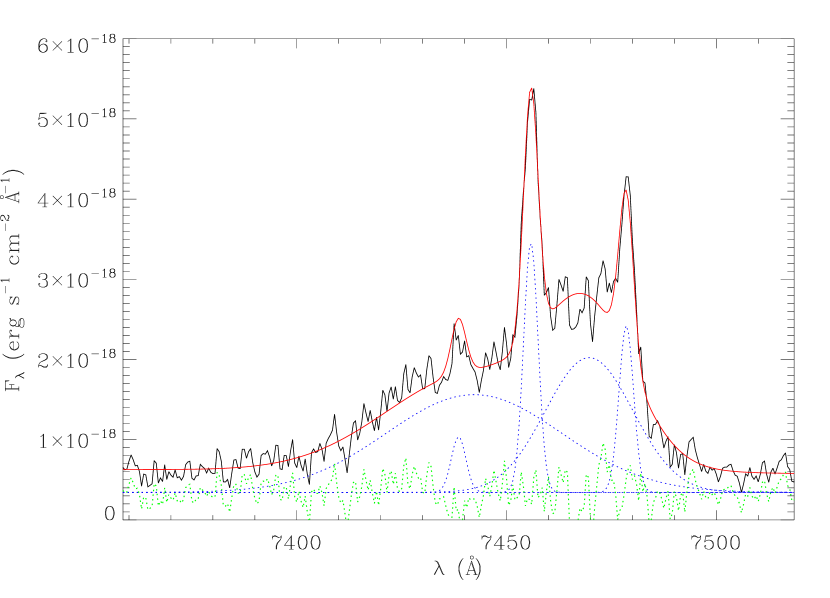
. The observed profile is shown in black, while the blue dotted lines represent the broad and narrow components. The red line is the result of the fit and the green dotted line shows the residual of the fit plus an arbitrary constant.
3.2 OH maser spectra
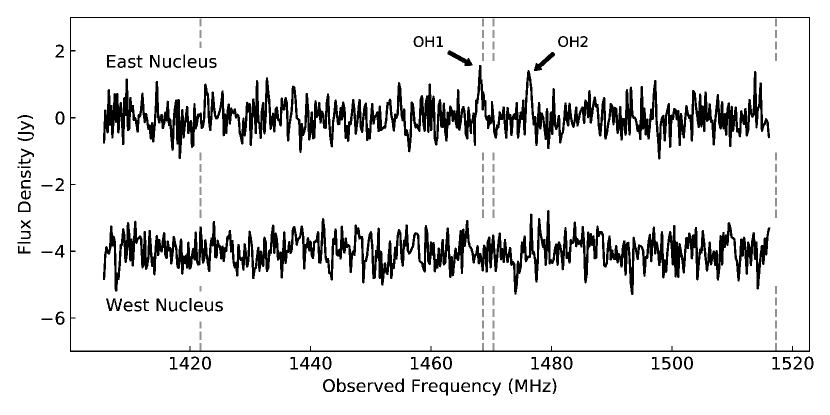
Figure 3 shows the VLA OH spectra extracted at the positions of the eastern (IRAS23199E) and western nuclei. OH masers are detected only towards the eastern nucleus. Two line features appear in the spectrum, which we label ‘OH1’, detected at significance, and ‘OH2’, a detection. To within the measurement uncertainties, OH1 matches the central frequency and peak flux density of the maser feature detected by Darling & Giovanelli (2001). To our knowledge, OH2 has never been detected before; OH2 falls outside the bandpass of the Darling & Giovanelli (2001) Arecibo observations. The position of OH1 and OH2 defections are identified in the top panel of Fig. 2.
Fig. 3 shows that OH1 appears to identify with the 1665 MHz line at the redshift of the eastern nucleus. Assuming OH1 is indeed the 1665 MHz line, its centroid velocity would be km s-1 relative to systemic in the rest frame of the eastern nucleus. OH2 is however significantly offset from the expected heliocentric frequencies of possible emission lines. It may identify either with 1665 MHz line at km s-1 or the 1667 MHz line at km s-1 relative to systemic.
3.3 HST images
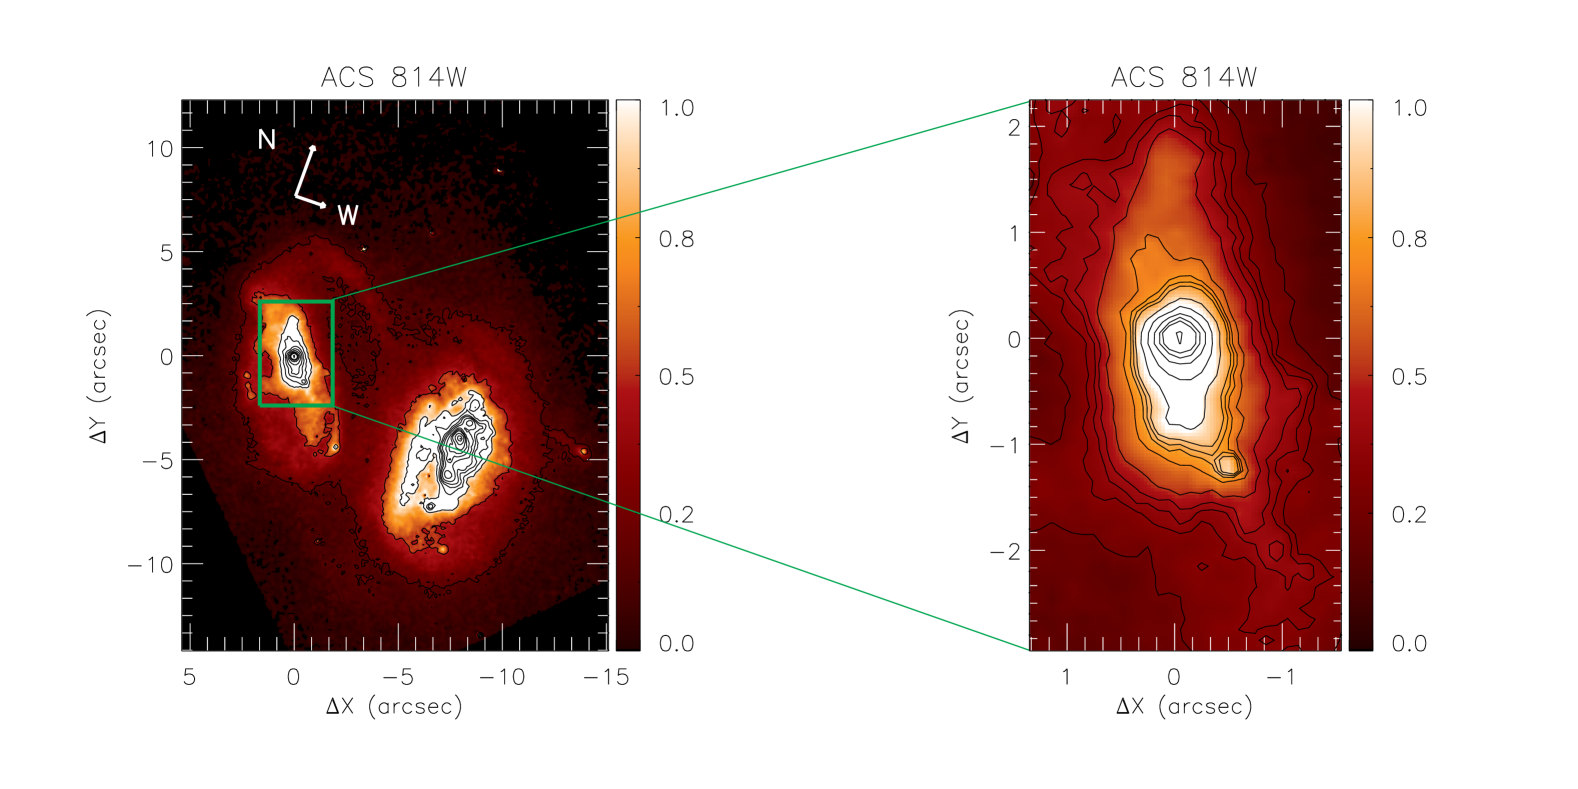
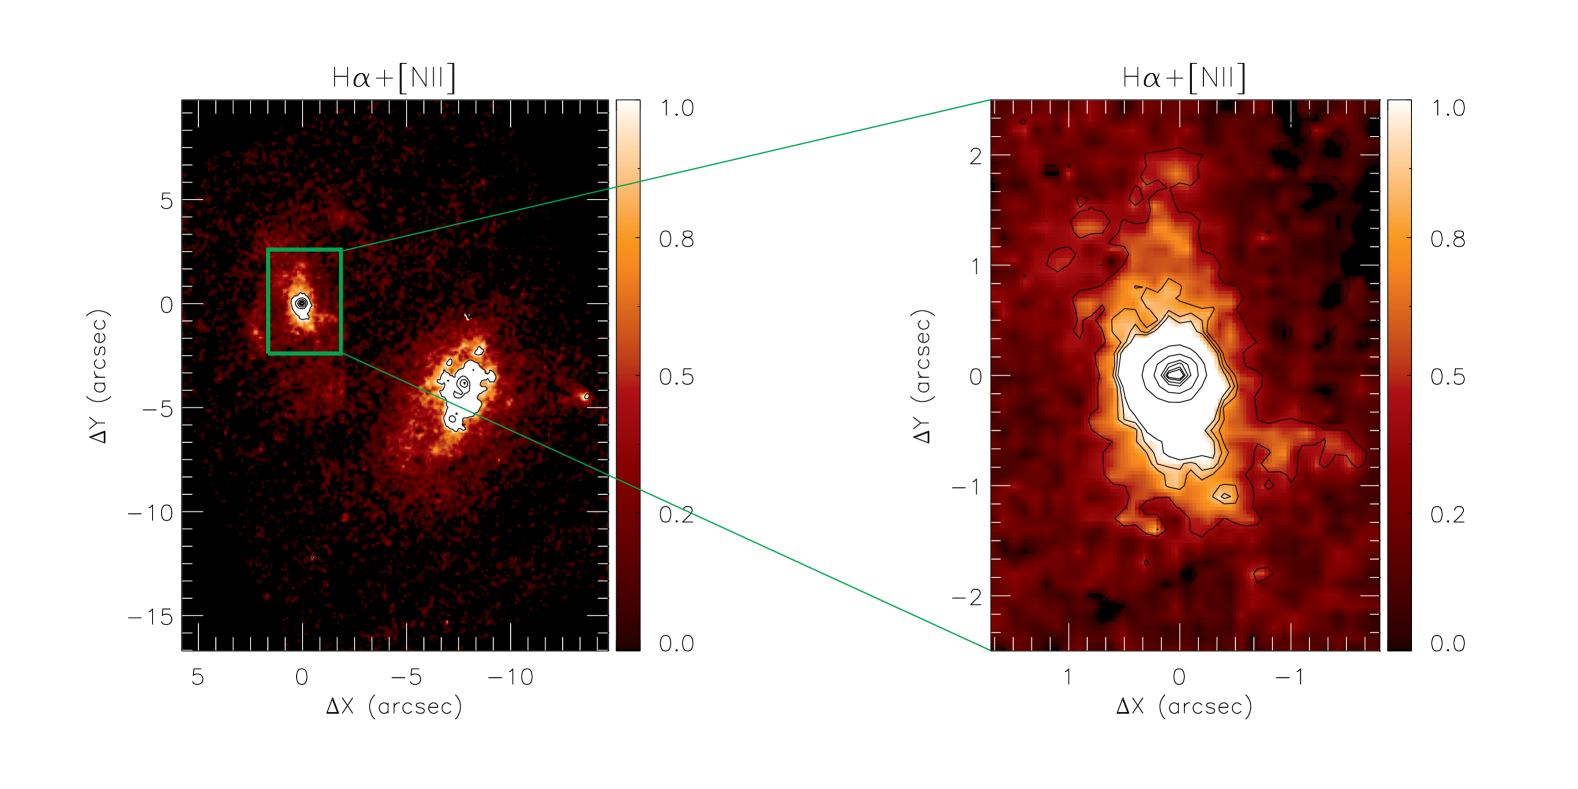
Figure 4 presents the HST broad-band continuum F814W image (top panel) and the narrow-band H+[NII] image (bottom panel) of the inner 2020 arcsec2 of IRASF23199+0123, which reveal that this system is an interacting pair. The images in the left panels show both galaxies of the pair, while the right panels show a zoomed in view of IRAS23188E within the same field of view of the GMOS IFU observations. The green box in the left panels corresponds to the field of view of our GMOS data. The HST images were rotated to the same orientation of the GMOS data.
The F814W continuum image of IRAS23199E presents the highest intensity levels in an elongated structure at suggesting that the galaxy is highly inclined. The western galaxy of the pair shows a less elongated flux distribution, suggesting a more face-on orientation, although the flux distribution towards the center is not uniform, but presents a complex structure. The F814W image also reveals a structure that resembles a spiral arm to the north that seems to connect the two galaxies, that may be a tidal tail connecting the two galaxies. The linear distance between the galaxy nuclei, projected in the plane of the sky is 24 kpc, assuming a distance to the galaxy of 558 Mpc. This is a lower limit as we do not know the orientation of the plane containing both galaxies or their nuclei relative to the plane of the sky.
The bottom left panel of Fig. 4 shows the continuum-free HST H+[N ii] narrow-band image of the two galaxies. The bottom right panel shows a zoom of the region observed with GMOS-IFU, covering the central part of IRAS23199E. The H+[N ii] flux distribution is similar to that of the continuum, and suggests the presence of two tidal tails, one to the northeast and another to the southwest of the nucleus.
3.4 Emission-line flux distributions
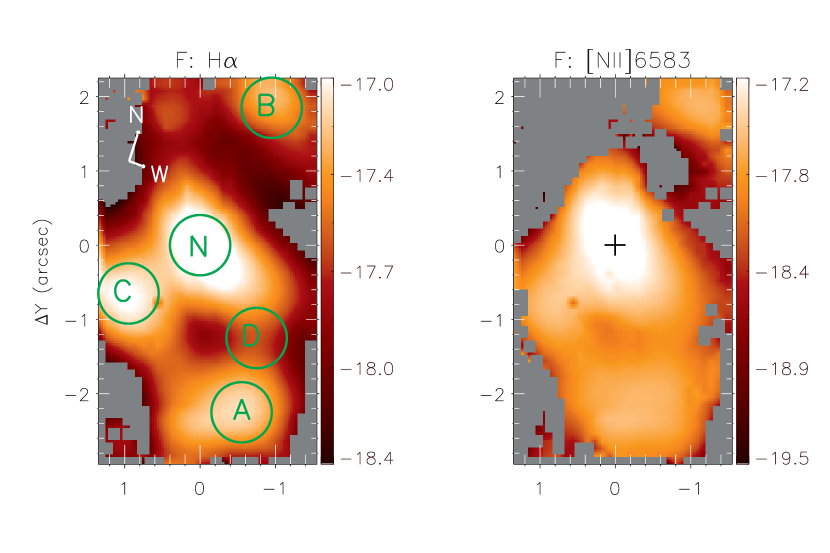
The top panels of Figure 5 present the flux distributions in the narrow components of H (left) and [N ii]6583 (right) emission-lines. The color bars show the flux in logarithmic units of erg s-1 cm2 and the grey regions represent masked locations where the uncertainty in the flux is larger than 30%. The central cross marks the location of the nucleus, defined as the position of the peak of the flux distribution of the broad H component and is labelled with the letter N in Fig. 5. The two lines show similar flux distributions, with the emission within the inner being elongated in the northeast–southwest direction. At least three extranuclear knots of emission, labelled A, B and C in Fig. 5, are observed in the H flux map, at (x,y) angular distances relative to the nucleus of (06,22), (10,18) and (10,06). We note that these knots are not observed in the HST [N ii]+H image.
3.5 Gas velocity fields and velocity dispersion maps
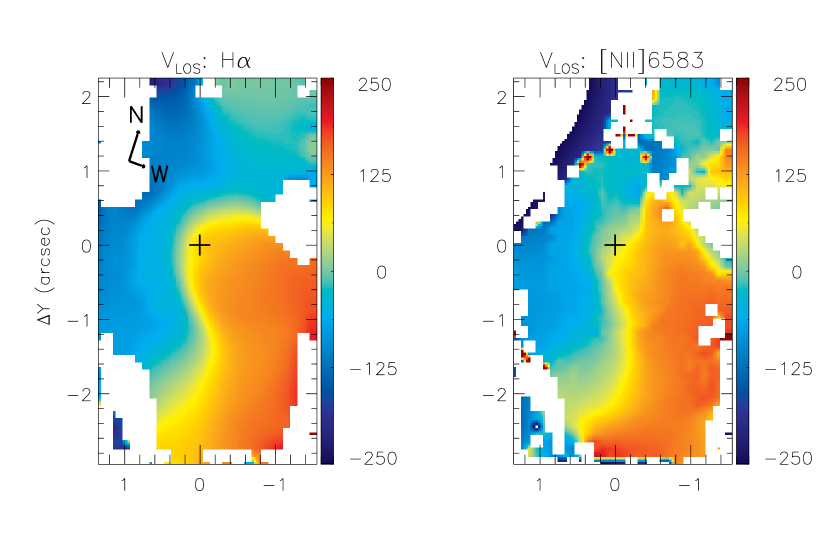
The central panels of Fig. 5 present the line-of-sight velocity () fields for the H (left) and [N ii]6583 (right) emission-lines. White regions were masked following the same criteria used for the flux maps, described above. The systemic velocity of =37 947 km s-1 was subtracted from the observed velocities, as derived from the modelling of the H velocity field with a rotating disk model (see Sec. 4.3).
The velocity fields derived from H and [N ii] emission lines are similar, presenting redshifts to the west and blueshifts to the east of the nucleus with velocities reaching up to 200 km s-1. The zero velocity line presents an shape and values close to the systemic velocity are observed at to the north of the nucleus.
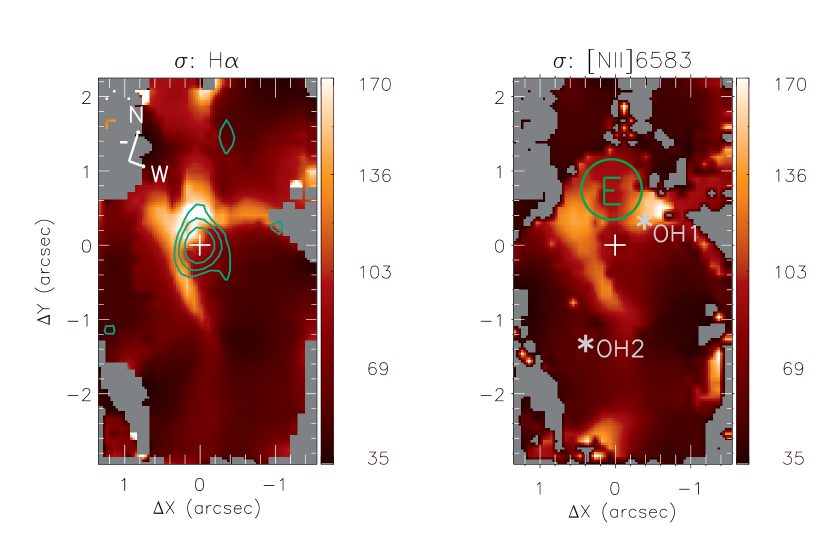
The bottom panels of Fig. 5 show the velocity dispersion () maps for H (left) and [N ii]6583 (right), corrected for the instrumental broadening. These maps show values ranging from to 150 km s-1, with the highest values observed co-spatially with the shaped zero velocity curve of the maps (central panels). In addition, some high values are seen for H at 15 northeast of the nucleus, where the velocity fields present the highest blueshifts. The smallest values of are co-spatial with the extranuclear knots of emission observed in the emission line flux distributions in the top panels of Fig. 5.
4 Discussion
In this work, we present for the first time high quality HST images of IRASF23199+0123. These images allowed us to identify that this system is indeed composed by two members and discern tidal structures. Thus, this is the first time that this system has been established to be an interacting galaxy pair.
4.1 Gas excitation and diagnostic diagrams
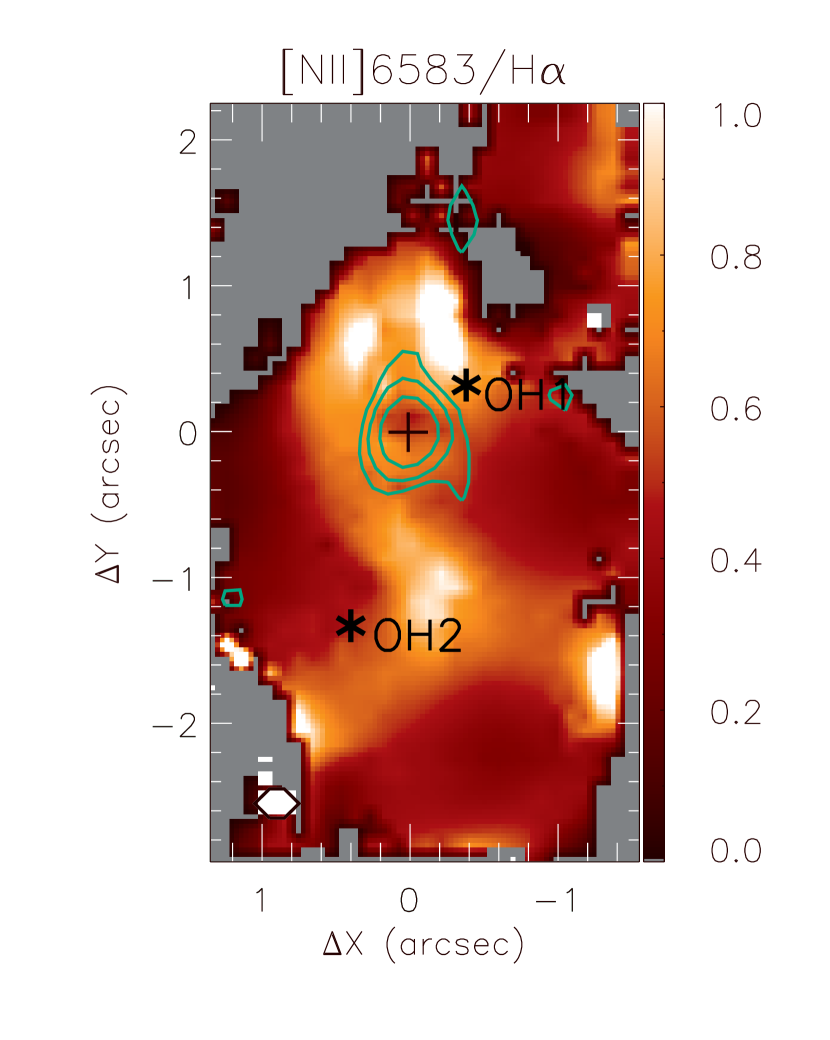
The [N ii]6583/H flux ratio can be used to map the gas excitation (e.g. Baldwin, Phillips & Terlevich, 1981; Cid Fernandes et al., 2010), with values [N ii]6583/H1 corresponding to gas ionized by young stars, while larger values correspond to gas excited by a central AGN or shocks (e.g. Storchi-Bergmann et al., 2007; Cid Fernandes et al., 2011).
In Figure 6 we present the [N ii]6583/H ratio map for IRAS23199E. Grey regions correspond to locations masked due to poor fits. The map shows values ranging from 0.2 to 1, with the highest values observed approximately coincident with the region with the highest values (bottom panels of Fig. 5), while the lowest values are observed in the knots of enhanced H emission (top-left panel of Fig. 5). We interpret these latter locations as complexes of star forming regions.
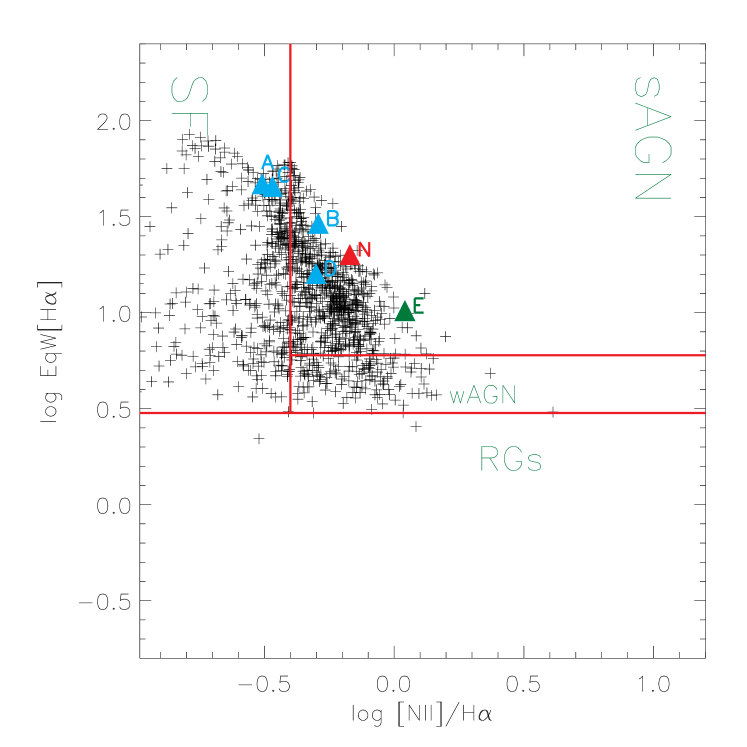
The fact that the locations with the highest [N ii]6583/H ratios are co-spatial with the highest values suggests that shocks contribute to the gas excitation. We have extracted a spectrum within a circular aperture of 04 radius in one of these locations, labelled E in Fig. 5. We have measured the line ratios and equivalent width of H from this spectrum, to plot this region in the diagnostic diagram WHAN (Cid Fernandes et al., 2010). This diagram has been proposed as an alternative to the BPT diagrams of Baldwin, Phillips & Terlevich (1981), and is a plot of the the H equivalent width against the [N ii]6583/H flux ratio. While BPT diagrams need four emission lines to separate the regions ionized by AGN or starburst, the WHAN diagram requires just H and [N ii]. The WHAN diagram enables a separation between Starbusts, Seyfert galaxies (sAGN) and low-luminosity AGNs (wAGN). It is also possible to separate wAGN population, where the emitting gas is excited by a central AGN from Retired Galaxies (RG), where the gas emission may be due to excitation by hot, evolved (post-asymptotic giant branch - post-AGB) stars, in which case the H equivalent width is smaller than 3Å(e.g. Belfiore et al., 2016; Brum et al., 2017).
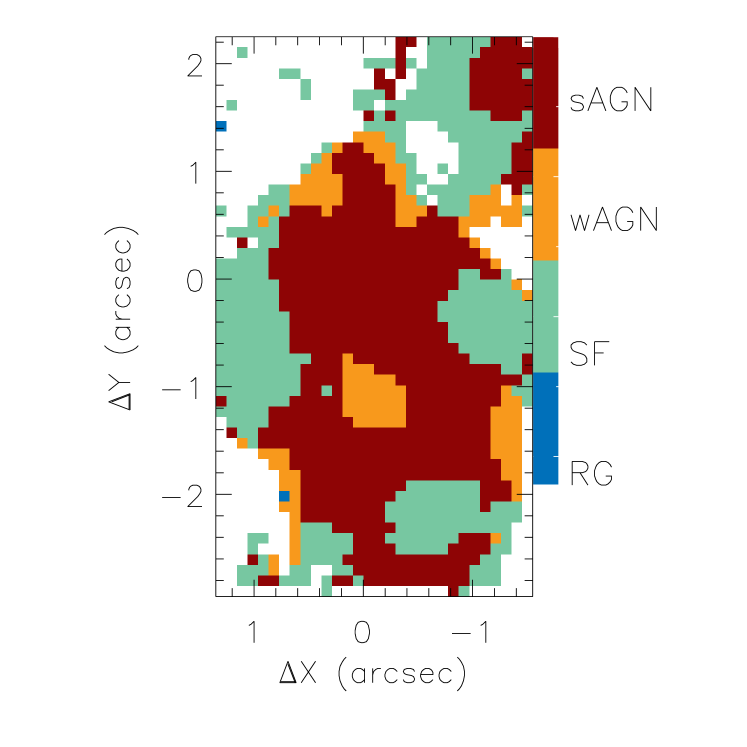
The WHAN diagram for IRAS23199E is shown in the left panel of Figure 7, while the right panel of this figure shows the corresponding excitation map, with the distinct excitation classes identified. The red triangle represents the nucleus, as obtained from the fitting of the line profiles from an integrated nuclear spectrum within 04 radius. Although the H broad component is seen to up to 08 from the nucleus – due to the wings of the PSF, the smaller aperture of 04 was chosen here to focus on the AGN emission, most of which is contained within this aperture (the PSF FWHM measured from field stars flux distribution is 085). The blue triangles correspond to the extra-nuclear locations identified in Fig. 5. The green triangle corresponds to the spectrum from region E described above where there is an enhancement of both the line ratio and the velocity dispersion . All points are located within the region expected for emission of gas excited by an AGN or Starburst. In particular, the point corresponding to the nucleus is clearly located within the sAGN region (strong AGN), indicating that the nuclear emission originates in a Seyfert type AGN, in agreement with the presence of the broad H component. In addition to the nucleus, region E can also be classified as sAGN. At this location, the [N ii]6583/H ratio is even larger than for the nucleus, possibly that shocks contribute to the gas excitation.. The blue triangles corresponding to the extra-nuclear regions identified in Fig. 5 are located very close to the line that separates starburst from sAGN excitation, indicating that both the central AGN and star forming regions contribute to the gas excitation at these locations.
We note that there is a general trend for higher [N ii]6583/H to be associated with larger values. Some of these regions surround the contours of the 3 cm radio emission, as shown in Fig. 6. We thus attribute the gas emission at high- and [N ii]/H ratio as at least being partly produced by excitation of the gas by shocks associated with produced by the radio-emitting plasma. There are also some regions to the south of the nucleus where there is no radio emission but there is still enhancement of the and line ratios, which we attribute to the presence of additional perturbations possibly due to the interaction between the two galaxies in IRASF23199+0123.
.
4.2 Star forming regions
As discussed in previous sections, we identify several knots of enhanced H emission, associated to star forming regions. These knots are labelled A, B and C in Fig. 5. In order to characterize the star formation at these locations, we use the integrated fluxes within the circular apertures shown in Fig. 5. These fluxes have been used to estimate physical properties of the star forming regions that are listed in Table 1. In order to estimate the mass of ionized gas we used (Peterson, 1997):
| (1) |
where L41(H) is the H luminosity in units of 1041 erg s-1 and n3 is the electron density () in units of 103 cm-3. We have assumed cm-3, which is the mean value of electron density of circumnuclear star formation regions derived from the [S ii] 6717/ 6731 intensity ratio (Díaz et al., 2007; Dors et al., 2008). The values of the mass of ionized gas for each star forming complex are in the range (1.78 – 4.08) 105 M⊙.
We estimated the rate of ionizing photons [H+] and star formation rate (SFR) under the assumption of a continuous star formation regime. The rate of ionizing photons for each star formation region was derived using Osterbrock (1989):
| (2) |
where is the hydrogen recombination coefficient to all energy levels above the ground level, is the effective recombination coefficient for H, is the Planck’s constant and is the frequency of the H line. Using =2.59 1013 cm3s-1 and =1.17 10-17cm3s-1 (Osterbrock, 1989) we obtain:
| (3) |
The star formation rate (SFR) was computed using the following relation (Kennicutt, 1998):
| (4) |
SFRs derived for the star formation regions of IRAS23199E are in the range 0.05 – 0.12 M⊙yr-1, consistent with a moderate star-forming regime. These SFRs fall within the range observed for circumnuclear star forming regions in nearby Seyfert galaxies, derived using optical (Dors et al., 2008) and near-infrared (Falcón-Barroso et al., 2014; Riffel et al., 2016; Hennig et al., 2017) emission-lines and are consistent with the average value of M⊙ yr-1 for a sample of 385 galaxies.
The values of the ionizing photons rate are in the range Q[H+](51.87 - 52.23) s-1 and are in agreement with previous reported values for circumnuclear star forming regions in nearby galaxies (e.g. Wold & Galliano, 2006; Galliano & Alloin, 2008; Riffel et al., 2009, 2016).
The masses of ionized gas derived for the star-forming complexes in IRASF23199E are in the range of (1.78 - 4.08) M⊙, and agree with those previously obtained for star forming regions surrounding Seyfert nuclei (e.g. Riffel et al., 2016).
We can also use the Far-Infrared luminosity of galaxy to calculate the SFR (Kennicutt, 1998):
| (5) |
where is the IR luminosity integrated over the mid- and far-IR spectrum (8 - 1000 m). Using erg s-1 (Darling & Giovanelli, 2006), we obtain SFR61 yr-1. This value is much higher than those obtained for each star-forming region (shown in Tab. 1) and suggests that most of the FIR luminosity may not be due to star formation, but to the AGN, or most of the star formation is embedded in dust.
| Region | L (1041 erg s-1) | EqW[H] | M (105M⊙) | log Q[H+] (s-1) | SFR (M⊙ yr-1) |
|---|---|---|---|---|---|
| A | 0.12 | 44.41 | 3.06 | 52.10 | 0.09 |
| B | 0.07 | 28.41 | 1.78 | 51.87 | 0.05 |
| C | 0.16 | 45.84 | 4.08 | 52.23 | 0.12 |
4.3 Gas kinematics
The velocity fields shown in Fig. 5 are complex, but they suggest the presence of a rotation pattern with the line of nodes oriented approximately along the east-west direction. In order to describe analytically this behaviour, we used a simple rotation model (van der Kruit & Allen, 1978; Bertola et al., 1991),which assumes that the gas moves in circular orbits in the plane of the galaxy, within a central gravitational potential. In this model, the rotation velocity field is given by:
| (6) |
where and are the coordinates of each pixel in the plane of the sky, is the systemic velocity of the galaxy, is the velocity amplitude, is the major axis position angle, is the disc inclination relative to the plane of the sky ( for face-on disc), is a model fitting parameter (for p = 1 the rotation curve at large radii is asymptotically flat while for p = 3/2 the system has a finite mass) and is a concentration parameter, defined as the radius where the rotation curve reaches 70 % of its velocity amplitude.
The [N ii] and H emission-lines present similar velocity fields (Fig. 5), so we have chosen the H velocity field to perform the fit, as this line is stronger than [N ii] at most locations.
The observed velocities were fitted with the equation above using the MPFITFUN routine (Markwardt et al., 2009) in IDL222
, that performs a non-linear least-squares fit, after initial guesses for the parameters. During the fit, the position of the kinematical center was kept fixed to the position of the peak of the flux distribution of the broad H component, adopted as the location of the nucleus of the galaxy and the parameter was kept fixed at , as done in previous works (e.g. Brum et al., 2017).
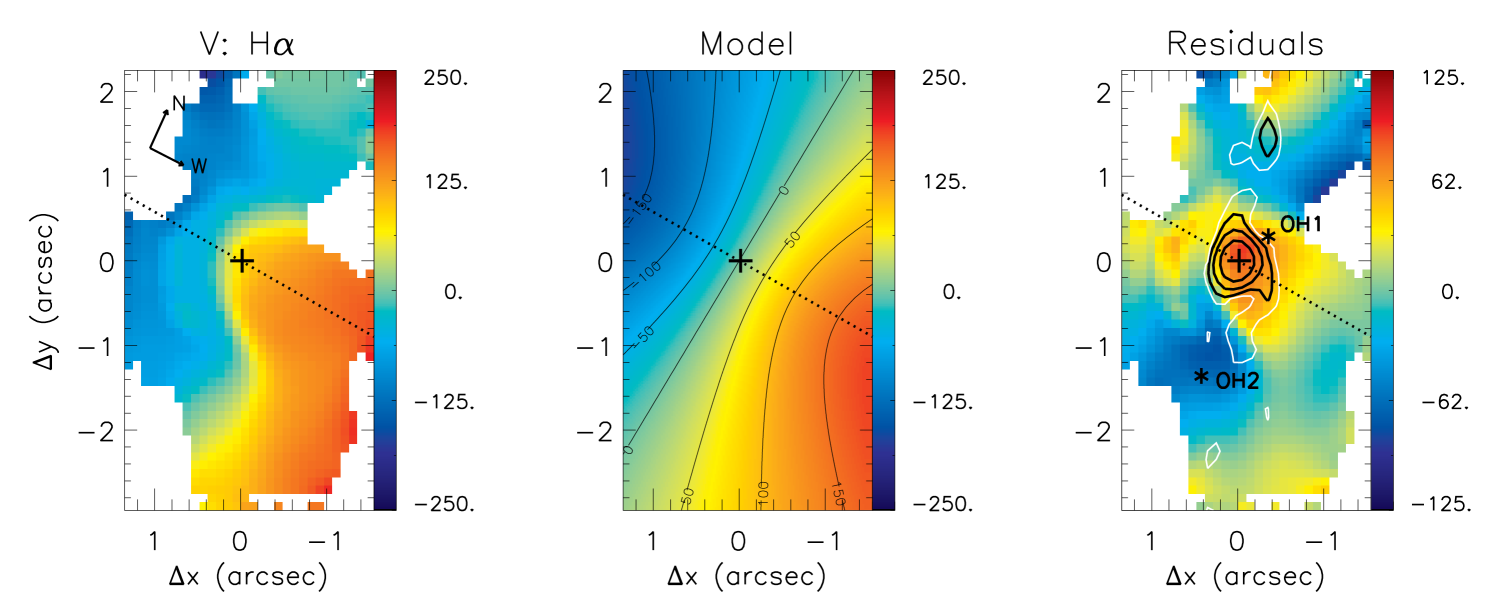
The resulting best fit model is shown in the central panel of Figure 8 and its parameters are =34926 km s-1, =37 9472 km s-1 (corrected for the heliocentric rest frame), =952∘, =1601, i=416∘. The systemic velocity of the galaxy can be compared with previous measurements. Lawrence et al. (1999) described the construction of the QDOT survey, which consists of infrared properties and redshifts of an all-sky sample of 2387 IRAS galaxies. They obtained a systemic velocity for IRASF23199+0123 of 40 981 km s-1. On the other hand, Darling & Giovanelli (2006) performed an optical spectrophotometric study of resolved spectra of multiple nuclei merging systems that hosts OHM sources and obtained =40 6792 km s-1. We note that the systemic velocity derived here is smaller than those obtained in previous studies. We speculate that this difference may be due to the fact that previous works possible have observed the western nucleus, which is brighter, since at that time it was not known that IRASF23199+0123 is composed by two members.
Besides the disk rotation model, Fig. 8 shows also the observed H velocity field in the left panel and the residual map between the observed velocities and the model in the right panel. The residual velocity map shows values much smaller than the observed velocity amplitude, but residuals of up to 100 km s-1 are present at some locations. Blueshifts are seen to the south and north of the nucleus, while redshifts are observed at the nucleus and its surroundings.
In order to investigate the origin of the velocity residuals, we have overlaid the contours from the 3 cm radio image on the residual map shown in the right panel of Fig. 8. In this figure, we have plotted also the radio contours at the 1.5 level (in white), as these levels show that faint radio emission is elongated towards the region where blueshifts are observed to the north of the nucleus. At the 3 level there is just a hint of this elongation. This apparent association of the extended radio emission (although at faint levels) with the blueshifts in the map of velocity residuals suggests that the radio-emitting plasma may play a role in the gas kinematics and a possible interpretation is that the blueshifted residuals are due gas pushed away from the nucleus by a radio jet. Other indications of the interaction between the radio plasma and the emitting gas are the higher velocity dispersion and [N ii]/H values surrounding the radio structures, as seen in Figs. 5 and 6. Similar results have been found for other galaxies and interpreted as originating from the interaction of the radio jet with the ambient gas (e.g. Riffel et al., 2006, 2015).
We speculate that the observed blueshifts originate in outflows along a bi-cone oriented in the north-south direction with its axis approximately in the plane of the sky. The blueshifts would come from the front walls (nearside) of the cones to both sides of the nucleus, while the redshift from the back (farside) walls are not observed probably due to obscuration. The redshifts that are observed surrounding the nucleus could be due to inflows towards the nucleus, probably due to gas motions associated with the interaction between the two galaxies of the pair.
Finally, it is interesting to note that the OH masers are observed in the vicinity of the active nucleus of IRASF23199E, close to regions of enhanced velocity dispersion and [N ii]/H ratio in the emitting gas. This suggests that the maser sources are associated with the AGN, perhaps produced in gas compressed in an interaction with expanding radio plasma. We also notice that the redshifted maser source (OH1), is located in a region with redshifted residuals, while the blueshifted maser source (OH2), is located in a region of blueshifted residuals, suggesting that the OH2 source is participating in the outflow.
4.4 The nature of the nuclear emission
Darling & Giovanelli (2006) presented a study of the optical properties of the Arecibo Observatory OH megamaser survey sample, with the aim of investigating the types of nuclear nuclear environments that produce OH megamasers. They determined that IRASF23199+0123 harbours a Seyfert 2 nucleus, based on an optical spectrum but the spectra used for the classification includes both nuclei, thus it was not possible to reveal the nature of each nucleus separately.
With our data we have discovered that IRAS23199E harbours a Seyfert 1 nucleus, as we clearly detected a broad unresolved H component at the nucleus and the WHAN diagram is consistent with Seyfert-like gas excitation there. The double-peaked nature of this broad component suggests it is due to unresolved disk rotation in the BLR, as many recent studies have supported a flattened geometry for this region (Storchi-Bergmann et al., 2017). In the NLR, jet-cloud interaction may give rise to double-peaked lines (e.g. Capetti et al., 1999; O’Dea et al., 2002; Kharb et al., 2017) and another possibility is that some interaction with the radio emission may be happening in the BLR is this particular case. The discrepancy between Darling’s classification and ours can be understood if Darling & Giovanelli (2006) observed the western nucleus, which appears brighter in our HST image and in the Sloan Digital Sky Survey (SDSS) image (Bundy et al., 2015; Albareti et al., 2016).
We estimate the mass of the central black hole using the empirical relation given by Greene & Ho (2005):
| (7) |
where is the black hole mass, is the luminosity and is the full width at half maximum of the broad component. The luminosity was calculated as the sum of the luminosities of both components, resulting in erg s-1. We obtained the of 2170 km s-1directly from the observed profile. Using these values we have estimated a black hole mass of M⊙.
5 Conclusions
We present a multi-wavelength study of the OH megamaser galaxy IRASF23199+0123 using the HST, VLA and Gemini North telescope. Our HST images show that this system is an interacting pair of galaxies and used integral field spectroscopic data obtained with the Gemini GMOS-IFU to observe its eastern nucleus, which we call IRASF23199E. Our observations cover the inner 9.513 kpc2 of the galaxy at a spatial resolution of 2.3 kpc and velocity resolution of km s-1. Our main conclusions are:
-
•
We show that IRASF23199+0123 is an interacting pair with a tidal tail connecting the two galaxies and detect two OH maser sources associated to the eastern member.
-
•
Both nuclei present extended radio emission at 3 and 20 cm, with intensity peaks at the each nucleus. The 20 cm radio emission of the eastern nucleus is elongated in the direction of the most extended emission in the HST continuum image (northeast-southwest), while in the western nucleus the 20 cm radio emission is tilted by about 45∘ eastwards relative to the orientation of the most extended continuum emission. In the better spatially resolved 3 cm observations, some elongation is observed at low brightness level towards the north in the eastern nucleus.
-
•
One of the main results of this paper is the discovery of a Seyfert 1 nucleus in IRASF23199E, via the detection of an unresolved broad (FWHM2 200 km s-1) double peaked component in the H emission-line from the BLR. This is important in regard to the OH maser emission, because the two masing sources are detected in this galaxy which hosts an AGN, rather than the other member of the pair. In addition, the masing sources are observed in the vicinity of enhanced velocity dispersion and higher line ratios, suggesting that they are associated with shocks driven by AGN outflows. The blue and redshifted maser sources are associated with the blue and redshifted ionized gas velocity residuals. This combination of evidence from HST images, VLA line spectroscopy and IFU spectroscopy strongly indicates that in this system, the OH megamaser sources are associated with the AGN, rather than star formation.
-
•
Using the width and luminosity of the broad H profile, we estimate a mass of MBH= 3.8 106M⊙ for the central SMBH.
-
•
The comparison between the HST [N ii]+H image and GMOS-IFU emission-line flux distributions of IRASF23199E shows that they are similar, being more elongated in the northeast-southwest direction, following the continuum emission. In addition, the GMOS H flux map reveals the presence of three extra-nuclear knots, attributed to star forming regions.
-
•
From the measurement of the H fluxes from the star forming regions, we obtain: (1) star formation rates in the range (0.05 – 0.12) M⊙ yr-1; (2) ionized gas content in the range (1.8 – 4.1) 105 M⊙; and (3) ionized photons rate log Q[H+]=51.9 to 52.2 s-1. From the FIR luminosity we obtain obtain SFR61 yr-1 suggesting that most of the FIR luminosity may be due to the AGN or due to star formation embedded in dust.
-
•
The [N ii]6583/H flux ratio map of IRAS23199E presents the highest values coincident with the regions with highest values, which surround the radio source and suggests that the radio-emitting plasma interacts with the ambient gas via shocks that seem to play a role in the gas excitation. The lowest [N ii]6583/H values are co-spatial with the star forming regions detected in the H emission.
-
•
The velocity fields of IRASF23199E show a disturbed rotation pattern with the line of nodes oriented along , as derived by the fit of the H velocities with a rotation disk model. The residuals between the observed and modelled velocity field combined with the velocity dispersion maps suggest the presence of non circular motions, possibly due to outflows from the nucleus along the directions north and south and inflows towards the nucleus in its vicinity.
Acknowledgements
We thank an anonymous referee for useful suggestions which helped to improve the paper. This work is based on observations obtained at the Gemini Observatory, which is operated by the Association of Universities for Research in Astronomy, Inc., under a cooperative agreement with the NSF on behalf of the Gemini partnership: the National Science Foundation (United States), the Science and Technology Facilities Council (United Kingdom), the National Research Council (Canada), CONICYT (Chile), the Australian Research Council (Australia), Ministério da Ciência e Tecnologia (Brazil) and south-eastCYT (Argentina). This research has made use of the NASA/IPAC Extragalactic Database (NED) which is operated by the Jet Propulsion Laboratory, California Institute of Technology, under contract with the National Aeronautics and Space Administration. The National Radio Astronomy Observatory is a facility of the National Science Foundation operated under cooperative agreement by Associated Universities, Inc. We acknowledge the usage of the HyperLeda database (http://leda.univ-lyon1.fr). C. H. thanks for CAPES financial support. R.A.R. acknowledges support from FAPERGS and CNPq.
References
- Albareti et al. (2016) Albareti, F. D. et al., 2016, arXiv:1608.02013
- Allington-Smith et al. (2002) Allington-Smith, J.et al. 2002, PASP, 114, 892.
- Baldwin, Phillips & Terlevich (1981) Baldwin, J. A., Phillips, M. M., Terlevich, R., 1981, PASP, 93, 5.
- Belfiore et al. (2016) Belfiore, F., et al. 2016, MNRAS, 461, 3111.
- Bertola et al. (1991) Bertola, F., Bettoni, D., Danziger, J., Sadler, E., Sparke, L., de Zeeuw, T., 1991, ApJ, 373, 369
- Brum et al. (2017) Brum, C., Riffel, R. A., Storchi-Bergmann, T., Robinson, A., Schnorr Muller, A., Lena, D., 207, MNRAS, 469, 3405.
- Bundy et al. (2015) Bundy, K., et al., 2015, ApJ 798, id. 7
- Capetti et al. (1999) Capetti, A., Axon, D. J., Macchetto, F. D., Marconi, A., Winge, C., 1999, ApJ, 518, 187.
- Cid Fernandes et al. (2011) Cid Fernandes, R., Stasinska, G., Mateus, A., Vale Asari, N., 2011, MNRAS, 413, 1687.
- Cid Fernandes et al. (2010) Cid Fernandes, R., Stasinska, G., Schlickmann, M. S, Mateus, A., Vale Asari, N., Schoenell, W.; Sodre, L., 2010, MNRAS, 403, 1036.
- Conway et al. (1990) Conway, J. E., Cornwell, T. J., & Wilkinson, P. N. 1990, MNRAS, 246, 490
- Darling & Giovanelli (2001) Darling, J., Giovanelli, R. 2001, AJ, 121, 1278
- Darling & Giovanelli (2002) Darling J., Giovanelli, R., 2002, APJ, 572, 810
- Darling & Giovanelli (2006) Darling J., 2006, Giovanelli, R., APJ, 132,2596
- Díaz et al. (2007) Díaz, Á. I., Terlevich, E., Castellanos, M., & Hägele, G. F. 2007, MNRAS, 382, 251.
- Dors et al. (2008) Dors O. L., Storchi-Bergmann T., Riffel R. A., Schmidt A. A., 2008, A&A, 482, 59
- Elitzur & Shlosman (2006) Elitzur M., Shlosman I., 2006, ApJ, 648, L10.
- Elitzur (2012) Elitzur, M. 2012, ApJL, 747, L33
- Falcón-Barroso et al. (2014) Falcón-Barroso, J., Ramos Almeida, C., Boker, T., et al. 2014, MNRAS, 438, 329.
- Galliano & Alloin (2008) Galliano, E., & Alloin, D. 2008, A&A, 487, 519
- Gonzalez & Woods (2002) Gonzalez R.C., Woods R.E., 2002, Digital Image Processing, 2nd edition, Prentice-Hall, Englewood Cliffs, NJ.
- Greene & Ho (2005) Greene, J. E., & Ho, L. C., 2005, ApJ, 630, 122.
- Hennig et al. (2017) M. G. Hennig, Riffel, R. A., Dors O. L., (in preparation)
- Hönig et al. (2013) Hönig, S. F., Kishimoto, M., Tristram, K. R. W., et al. 2013, MNRAS, 771, 87
- Hook et al. (2004) Hook, I., Jorgensen, I., Allington-Smith, J. R., Davies, R. L., Metcalfe, N., Murowinski, R. G., Crampton, D., 2004, PASP, 116, 425
- Hoopes et al. (1999) Hoopes, C. G., Walterbos, R. A. M., & Rand, R. J. 1999, ApJ, 522, 669
- Ivezić & Elitzur (2010) Ivezić, Z., Elitzur, M. 2010, MNRAS, 404, 1415
- Kauffmann et al. (2003) Kauffmann, G. et al. 2003a, MNRAS, 346, 1055
- Kennicutt (1998) Kennicutt, R. C. 1998, ARA&A, 36, 189
- Kewley et al. (2001) Kewley, L. J., Dopita, M. A., Sutherland, R. S., Heisler, C. A., Trevena, J. 2001a, ApJ, 556, 121
- Kewley et al. (2006) Kewley, L. J, Groves, B, Kauffmann G., Heckman, T., 2016, MNRAS, 372
- Lena (2014) Lena, D., 2014, arXiv:1409.8264
- Lena et al. (2015) Lena, D., Robinson, A., Storchi-Bergmann, T., Schnorr Müller, A., Seelig, T., Riffel, R. A., Nagar, N. M., Couto, G.S., & Shadler, L., 2015, ApJ, 806, 84
- Li, Ostriker & Sunyaev (2013) Li, J., Ostriker, J., Sunyaev, R., 2013, ApJ, 767, 105L.
- Lo (2005) Lo, K. Y., ARA&A, 2005, 43, 625
- Lawrence et al. (1999) Lawrence, A., et al. 1999, MNRAS, 308, 897
- McMullin et al. (2007) McMullin, J. P., Waters, B., Schiebel, D., Young, W., & Golap, K. 2007, Astronomical Data Analysis Software and Systems XVI, ASP Conf. Ser. 376, ed. R. A. Shaw, F. Hill, & D. J. Bell, San Francisco, CA: ASP, 127
- Markwardt et al. (2009) Markwardt C. B., 2009, in Bohlender D. A., Durand D., Dowler P., eds, ASP Conf. Ser. Vol. 411, Astronomical Data Analysis Software and Systems XVIII. Astron. Soc. Pac., San Francisco, p. 251
- Menezes et al. (2014) Menezes, R. B., Steiner, J. E., Ricci, T. V., 2014, MNRAS, 438, 2597.
- Menezes et al. (2015) Menezes, R. B., da Silva, P., Ricci, T. V., Steiner, J. E., May, D., Borges, B. W., 2015, MNRAS, 450, 369.
- Mor et al. (2009) Mor, R., Netzer, H., & Elitzur, M. 2009, ApJ, 705, 298
- Nenkova et al. (2008) Nenkova, M., Sirocky, M. Ivezić, Z., Elitzur M., 2008, ApJ, 608, 147.
- O’Dea et al. (2002) O’Dea, C. P. et al., 2002, AJ, 123, 2333.
- Osterbrock (1989) Osterbrock, D. E., 1989, Astrophysics of Gaseous Nebulae and Active Galactic Nuclei, University Science Books, Mill Valley, California.
- Pearson & Readhead (1984) Pearson, T. J., & Readhead, A. C. S. 1984, ARAA, 22, 97
- Peterson (1997) Peterson B. M., 1997, An Introduction to Active Galactic Nuclei, Cambridge, New York Cambridge University Press
- Kharb et al. (2017) Kharb, P.; Subramanian, S.; Vaddi, S.; Das, M.; Paragi, Z., 2017, ApJ accepted http//esoads.eso.org/abs/2017arXiv170800618K
- Rau & Cornwell (2011) Rau, U. & Cornwell, T.J. 2011, AA, 532, 71
- Riffel et al. (2006) Riffel, R. A., Storchi-Bergmann, T., & Winge, C., Barbosa, F. K. B., 2006, MNRAS, 373, 2.
- Riffel et al. (2009) Riffel, Rogemar A., Storchi-Bergmann, T., Dors, O. L., Winge, C., 2009, MNRAS, 393, 783
- Riffel et al. (2010) Riffel R. A., 2010, ApSS, 327, 239.
- Riffel et al. (2014) Riffel, R. A., Storchi-Bergmann, T., & Riffel, R. 2014, ApJL, 780, L24
- Riffel et al. (2015) Riffel, R. A., Storchi-Bergmann, T., & Riffel, R. 2015, MNRAS, 451, 3587
- Riffel et al. (2016) Riffel, Rogemar A., Colina, L., Storchi-Bergmann, T., Piqueras, L0́pez J., Arribas, S., Riffel, R., Pastoriza, M., Sales, Dinalva A., Dametto, N. Z., Labiano, A. & Davies, R. I., 2016, MNRAS, 461, 4192.
- Rossa & Dettmar (2000) Rossa, J., & Dettmar, R.-J. 2000, A&A, 359, 433
- Rossa & Dettmar (2003) Rossa, J., & Dettmar, R.-J. 2003, A&A, 406, 505
- Sales et al. (2015) Sales, D. A., Robinson, A., Axon, D. J., Gallimore, J. Kharb, P., Curran, R. L., O’Dea, C., Baum, S., Elitzur, M.,Mittal, R. 2015, ApJ, 799
- Schwab (1984) Schwab, F. R. 1984, AJ, 89, 1076-1081
- Shi, Gu & Peng (2006) Shi, L., Gu, Q. S., & Peng, Z. X. 2006, A&A, 450, 15.
- Storchi-Bergmann et al. (2007) Storchi-Bergmann, T., Dors, O. L. Jr., Riffel, R. A., Fathi, K., Axon, D. J., Robinson, A., Marconi, A., Ostlin, G., 2007, ApJ, 670, 959.
- Storchi-Bergmann et al. (2017) Storchi-Bergmann, T.; Schimoia, J. S.; Peterson, B. M.; Elvis, M.; Denney, K. D.; Eracleous, M.; Nemmen, R. S., 2017, ApJ, 835, 236.
- Tody (1986) Tody, D. 1986, The IRAF Data Reduction and Analysis System in Proc. SPIE Instrumentation in Astronomy VI, ed. D.L. Crawford, 627, 733
- Tody (1993) Tody, D. 1993, IRAF in the Nineties" in Astronomical Data Analysis Software and Systems II, A.S.P. Conference Ser., Vol 52, eds. R.J. Hanisch, R.J.V. Brissenden, J. Barnes, 173.
- van der Kruit & Allen (1978) van der Kruit, P.C., Allen, R.J., 1978, ARA&A, 16, 103
- van Dokkum (2001) P. G. 2001, PASP, 113, 1420
- Wold & Galliano (2006) Wold, M., Galliano, E., 2006, MNRAS, 369, 47.