FIRST-PRINCIPLES CALCULATIONS OF OPTICAL PROPERTIES: FROM FAR-INFRARED TO ULTRAVIOLET
VLADIMIR SALEEV
Department of Physics, Samara National Research University,
Moskovskoe Shosse, 34, Samara, 443086, Russia
saleev@samsu.ru
ALEXANDRA SHIPILOVA
Department of Physics, Samara National Research University,
Moskovskoe Shosse, 34, Samara, 443086, Russia
alexshipilova@samsu.ru
Abstract
We perform first-principles calculations of optical properties for ferroelectric phase of crystal using density functional theory for wide range of wavelengths, from far-infrared to ultraviolet. We study frequency dependence of complex dielectric tensor and related quantities, such as refractive and reflection indices, absorption coefficients, etc. Our calculation incorporate advantages of numerical approaches based on atomic-orbital all-electron Gaussian-type basis sets, as it is realized in CRYSTAL14 program. We compared predictions obtained in general-gradient approach with PBESOL exchange-correlation functional and in hybrid approach with PBESOL0 functional, and we have found that hybrid PBESOL0 functional is more applicable to describe the wide set of the experimental data.
Keywords:Lithium Niobate; optical properties; first-principles calculations; density functional theory.
1 Introduction
Lithium Niobate (LN) crystallizes into two different phases, ferroelectric and paraelectric, depending on the temperature. The ground state of LN (space group ) undergoes the phase transition at the temperature near 1480 K to the high-symmetry paraelectric phase (space group ). The ground-state phase has very large dielectric, piezoelectric, pyroelectric, non-linear optic and electro-optic responses. That is why it is well-known as excellent material for different branches of photonics. The results of experimental study of LN main physical properties are collected in Ref. [1], and the more recent references to data can be found in Springer materials database [2]. The number of LN parameters relevant for electro- and elasto-optics from different measurements have been recalculated and determined in Ref. [3]. Complete sets of elastic constants and photoelastic coefficients of LN crystal are presented in Ref. [4]. Infrared reflection spectra and Raman spectra of LN were studied many years ago for the first time in Refs. [5, 6]. Up to now, Raman frequencies of LN were experimentally studied many times, see Refs. [7, 8, 9, 10, 11, 12, 13]. Indices of refraction and absorption in far-infrared range between 100 GHz and 3 THz (3 cm-1 - 100 cm-1) were investigated in Ref. [14]. Light absorption in the visible wavelength range was measured in Ref. [15].
Theoretical first-principles study of LN optical properties in the framework of Density Functional Theory (DFT) [16, 17] are based on linear response theory. At first time, ab initio calculations of LN crystal phonon spectrum, infrared (IR) and Raman frequencies, were performed in Ref. [18]. Electro-optic effects in LN crystal were calculated in Ref. [19], where authors explicitly took into account the electronic, ionic and piezoelectric contributions. The precise calculations of the electron band structure and the dielectric function of ferro- and paraelectric LN with inclusion of quasiparticle and electron-hole effects in the range of visible and ultraviolet (UV) wavelengthes were studied in Refs. [20, 21]. The influence of the nonlocal Hartree-Fock exchange on the band gap value of LN in the framework of hybrid DFT was investigated in Ref. [22]. Recently, theoretical study of electronic and optical properties of LN under high pressure was performed using first-principles methods in the Ref. [23]. The influence of electronic many-body interactions, spin-orbit coupling, and thermal lattice vibrations on the electronic structure of LN were calculated by combining hybrid density functional theory with the scheme in the work [24].
In this paper we perform first-principles calculations for complex components of dielectric tensor of ferroelectric LN crystal and relevant optical parameters exploring CRYSTAL14 programm package [25]. We study frequency dependence of considered optical properties in the wide region of wavelengths, starting from far-infrared (including static limit) region to visible and soft UV waves. We consistently merged ionic and electronic contributions to describe intermediate region where both ones are important. The paper is organized as follows. We describe relevant physical models in the Sec. 2. In the Sec. 3 we present computational methods and program input. In the Sec. 4 we discuss obtained results and perform comparison with experimental data and previous calculations. Finally, we summarize our conclusions in the Sec. 5.
2 Physical model
The main optical properties of crystal, such as refraction and absorption indices, reflectivity, Raman spectrum, are connected with permittivity of crystal, which is characterized by means of a complex dielectric tensor . Such a way, if we know real and imaginary parts of dielectric tensor, , we can calculate real and imaginary parts of complex refraction index, , where
Classical reflectivity is defined as
and the absorption coefficient is written
Wavelength and wavenumber (or frequency) are presented via photon energy as follows
Complex dielectric tensor written in diagonal form can be presented for each inequivalent polarization direction as a sum of electronic (”high-frequency”) and ionic (”low-frequency”) contributions :
| (1) |
Ionic contribution is written in semi-classical oscillator model which applied for infrared region ( nm or cm-1):
| (2) |
where indicates the polarization direction, , and are the transverse optical frequency, oscillator strength and damping factor for the -th vibration mode, respectively. The set of harmonic phonon frequencies in the the point can be obtained from the diagonalization of the Hessian matrix of the second derivatives with respect to atomic displacements [26]:
| (3) |
where are the atomic masses, and are displacements of atoms and in the reference cell along the -th and -th Cartesian directions, respectively. is the total crystal energy, as it is calculated in DFT at the fixed ionic positions. In standard way, the crystal energy in (3) is calculated at the zero external electric field and it is supposed that oscillator strengths don’t depend on wavelength and intensity of scattering light as it should be in the linear approximation. We will follow this approximation taking into account that experimental data correspond to finite values of wavelength and intensity of light. We mention that the exact calculation of such non-linear response, which may be not small for ferroelectric crystals, is not a matter of standard approach implemented in CRYSTAL14 package.
In the static limit (), which is realized accordingly our calculations at the nm ( cm-1), the components of the dielectric tensor are real constants,
In the range of nm ( cm-1) components of dielectric tensor are calculated by the formula (1) with .
The high-frequency region includes visible and ultraviolet wavelengths up to frequencies which correspond to an electronic excitation of separate atoms, (). Here, the ionic contribution vanishes and dielectric tensor is computed in a quasi-free electron approximation via coupled perturbed Hartree-Fock/Kone-Sham (CPHF/CPKS) method [27]. It is a perturbative, self-consistent method that focuses on the description of the relaxation of the crystalline orbitals under the effect of an external electric field. The perturbed wave function is then used to calculate the dielectric properties as energy derivatives.
Ab initio calculations of photoelastic (elasto-optic) constants are developed and implemented in the CRYSTAL14 program [28]. These constants are the elements of the fourth rank photoelastic (Pockels) tensor and are defined as:
| (4) |
where is the difference of the inverse dielectric tensor between strained and unstrained configurations, is the rank-2 symmetric tensor of pure strain and Voigt’s notation is used according to which . The dielectric tensor of the equilibrium structure and of each strained configuration is computed via a CPHF/KS scheme in the two regimes. The first one is an infinite wavelength approximation (static limit) and the second one takes into consideration finite wavelength of the external electric field.
To demonstrate self-consistency, completeness and good agreement with experimental data of our DFT-based calculations, we also calculate elastic [29] and piezoelectric [30] tensors for LN crystal and compare results with existing data. Elastic constants are calculated as derivatives of total energy per unit cell with volume ,
| (5) |
Piezoelectric tensors describe the polarization induced by strain . The Cartesian components of the polarization can then be expressed in terms of the strain tensor components:
so that at the constant field as follows
| (6) |
In CRYSTAL14, the polarization can be computed either via localized Wannier functions or via the Berry phase (BP) approach. The latter scheme is used in the present automated implementation according to which direct piezoelectric constants can be written as follows in terms of numerical first derivatives of the BP with respect to the strain:
where is the i-th Cartesian component of the l-th direct lattice basis vector .
3 Computation methods and program input
During the self-consistent energy calculations we use DFT functionals of different types: generalized gradient approximation (GGA), such as PBESOL [31], and hybrid, such as PBESOL0 [31] (with 25 % of Hartree-Fock exchange mixing).
All-electron atom-centered Gaussian-type function basis sets are adopted for Lithium and for Oxygen, Li-5-11(1d)G and O-8-411(1d)G, correspondingly. Effective core pseudo-potential approach is used for Niobium atom with Hay and Wadt small core potential (HAYWSC) and four-valence-electron basis set is Nb-SC-HAYWSC-31(31d)G. The used basis sets have been optimized for LN crystal in Ref. [32].
The accuracy of calculating the energies of Coulomb and Hartree-Fock exchanges is controlled in the CRYSTAL14 program by a set of TOLINTEG parameters, which were chosen as {8, 8, 8, 8, 30}. The convergence threshold on energy for the self-consistent-field (SCF) calculations is set to Hartree for structural optimization and Hartree for vibration frequency calculations. The number of basis vectors in the irreducible Brillouin zone is given by the shrink parameter IS = 8 for structural optimization and IS=16 for vibration frequency and CPHF/KS calculations. The relaxation of cell parameters and atomic positions to equilibrium values was carried out until the lattice stress became less than 0.02 GPa.
Ionic contribution to the dielectric tensor is calculated as function of frequency together with infrared spectra by means of the following scripts: FREQCALC, INTENS, DIELTENS, IRSPEC, DIELFUN, REFRIND. Electronic high-frequency component of dielectric tensor is calculated by script CPKS, which includes DFT in both its local and generalized-gradient PBESOL approximations, and to hybrid functional PBESOL0.
To perform elastic, piezoelectric or photoelastic calculations we use ELASTCON, ELAPIEZO and PHOTOELA scripts with PREOPTGEOM option. The last one performs additional test and precise geometry optimization before the step of properties calculation.
4 Results
4.1 Crystal structure and relaxation
The lattice parameters of relaxed structures are very close to the experimental values with a few percent accuracy. As it is estimated, the calculation with PBESOL GGA exchange-correlation functional gives very close to experimental value for density, taking in mind the temperature dependence of lattice constants and density. Results obtained with hybrid functional PBESOL0 are also not so far from the experimental value. In the Table 1, the atomic positions of irreducible atoms, obtained with three different functionals, are also collected and compared with experimental data from Ref. [33]. The predicted fractional coordinates correspond to experimental ones within the approximate accuracy of 1 %. There is only one exception for the coordinate of oxygen atom which has a slightly larger difference than others.
| EC functional | , Å | , Å | , g/cm3 | Nb | Li | O |
|---|---|---|---|---|---|---|
| PBESOL | 5.118 | 13.958 | 4.653 | {0,0,0} | {1/3, 2/3, 0.9536} | {0.3187, 0.0237, 0.8962} |
| PBESOL0 | 5.084 | 13.842 | 4.756 | {0,0,0} | {1/3, 2/3, 0.9536} | {0.3190, 0.0247, 0.8960} |
| Experiment [33] | 5.151 | 13.876 | 4.648 | {0,0,0} | {1/3, 2/3, 0.9513} | {0.3239, 0.0383, 0.8983} |
4.2 Elastic constants and phonon dispersion
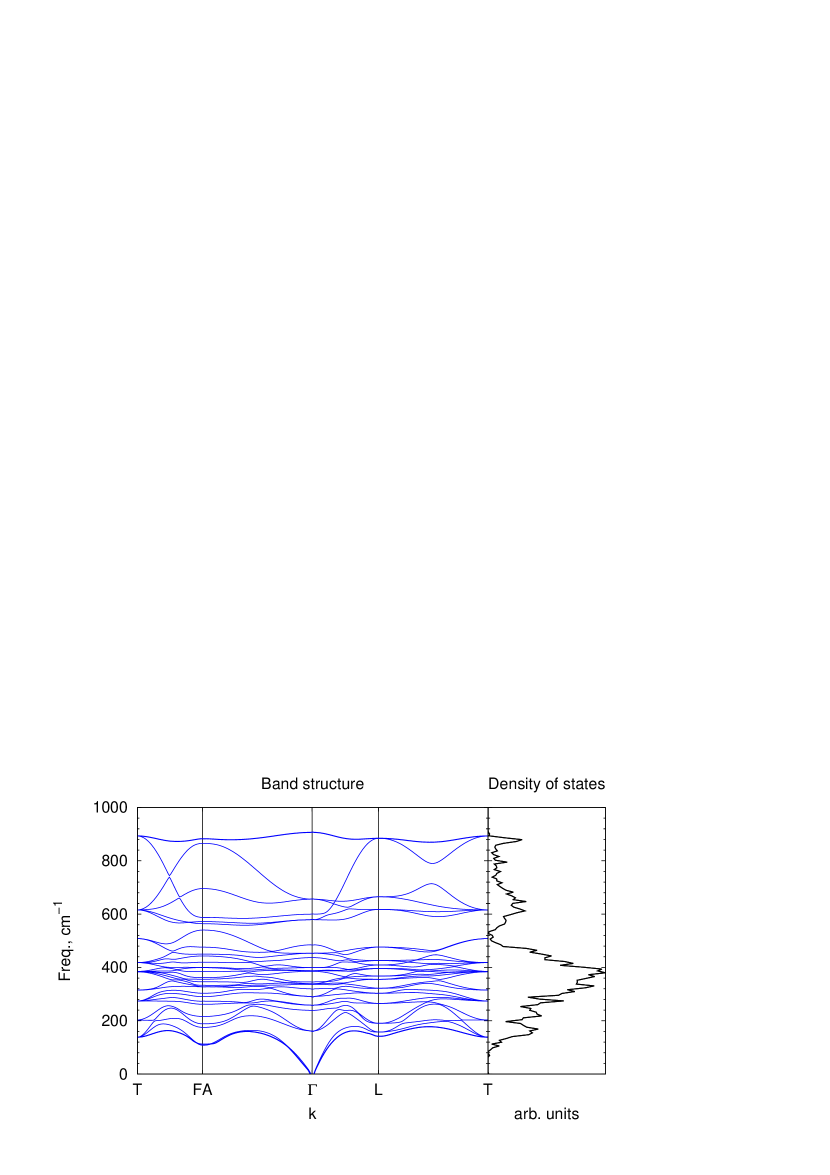
The general tests of mechanical stability of relaxed theoretical structure are based on the requirement of the positivity of eigenvalues of their elastic constants matrix. Also, the calculation and plotting of phonon dispersion curves is to be very informative. The sets of elastic constants obtained with PBESOL and PBESOL0 functionals are collected in the Table 2 as well as the experimental data. In the Fig. 1, phonon band structure and density of states (DOS) along the high-symmetric crystallographical directions are shown in case of calculation with PBESOL0 functional. We consider these calculations corresponding to the case of zero external electric field.
4.3 Piezoelectric constants
Here we present the results of calculations for piezoelectric constants for hexagonal case, in , and compare it with the most recent experimental data [36]. The more complete sets of experimental data can be found in Ref. [4]. Mostly, our predictions coincide to the data with relative errors of about 5-10 %.
4.4 Photoelasticity
In CRYSTAL14, using script PHOTOELA, we calculate photoelastic constants accordingly Eq. (4). By default, the electronic contribution is evaluated in the high-frequency limit but it is far from a threshold of electronic excitation. Pockels tensor at finite frequency can be computed with option DYNAMIC.
| EC functional | ||||||
|---|---|---|---|---|---|---|
| PBESOL | 0.067 | 0.092 | 0.192 | 0.161 | -0.187 | 0.234 |
| PBESOL0 | 0.059 | 0.124 | 0.209 | 0.175 | -0.168 | 0.206 |
| Experiment [4] | -0.021 | 0.060 | 0.172 | 0.118 | -0.052 | 0.121 |
| Experiment [38] | 0.034 | 0.072 | 0.139 | 0.060 | 0.066 | 0.300 |
In practice, it is difficult or even impossible to determine photoelastic constants directly, by measuring a strain induced optical refraction, due to a problem of precise determination of a crystal sample internal stress tensor. The alternative acousto-optical methods are ambiguous in the determination of the sign of photoelastic constants. That is why the experimental data strongly differ from each other. For instance, we obtain theoretically that , but in some experimental data sets one has . The full collection of experimental data for photoelastic constants is presented in Ref. [4]. The additional problem to compare with the data is a frequency-dependence of Pockels constants. In Fig. 2 we plot our predictions obtained with hybrid PBESOL0 functional. Throughout the interval nm, the photoelastic constants change rapidly, and only at the nm it is possible to neglect their dependence from wavelength. We should note that our calculations can be uncorrect at the wavelength smaller 300 nm and it may be a reason of irregular behavior of in this region. The estimated values of optical band gap for LN crystal with different functionals are eV (PBESOL0) and eV (PBESOL). The wavelength nm corresponds photon energy eV, which is very close to band gap energy, so the absorption effect can not be neglected.
4.5 Refraction in high-frequency limit
Dielectric tensor in high-frequency limit is calculated in CRYSTAL14 program automatically using script CPKS. Let us note what we mean here by ”high-frequency limit”. It is a region of frequencies where ionic contribution is negligibly small, it allows to neglect a slow response of heavy ions instead of fast electronic component. From the other side, considered frequencies should be smaller than ones needed for electronic excitation in separate atoms. Using script PHOTOELA with option DYNAMIC we can calculate dielectric tensor at finite frequency from this ”high-frequency” region.
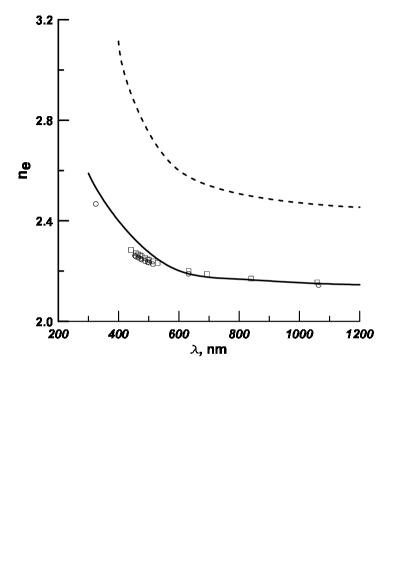
Our calculation with PBESOL0 functional reproduces well the measured precise dependence from wavelength for ordinary () and extraordinary () refractive indices in principal axes system, as it is shown in Fig. 3. For the accurate comparison, we collect calculated in the high-frequency limit refractive indices and experimental data for nm in the Table 5.The absorption of light in this region is negligibly small.
| EC functional | ||
|---|---|---|
| PBESOL | 2.415 | 2.433 |
| PBESOL0 | 2.161 | 2.214 |
| Experiment [35] ( nm) | 2.150 | 2.232 |
4.6 Infrared and far-infrared regions
The results of our calculations for real and imaginary parts of ordinary refraction index are shown as function of wavelength in Fig. 4. We obtain approximate agreement between data and theoretical prediction with PBESOL0 hybrid functional in far-infrared region ( nm) while the prediction with PBESOL functional strongly overestimates experimental data. As we predict, the infrared region of light absorption of LN crystal lies between nm and nm. It is yet experimentally unknown region and a careful study of the optical properties of LN crystal in this domain should be very important for understanding of the vibrational and elastic properties.
For the precise comparison of our prediction for refractive indices with existing experimental data we plot them as a function of wavenumber in the region cm-1, see Fig. 5. The approximation of experimental data [14] are plotted as doted lines. In case of extraordinary polarization both functionals overestimate data at 20% and 50 %, correspondingly. For ordinary polarization, hybrid functional PBESOL0 predicts very close to data, with accuracy of several percents.
The reflection indexes are sufficiently different for ordinary and extraordinary polarization in the far-infrared region. Our calculation predicts even larger difference than it is measured experimentally, as it shown in the Fig. 6. The same as for refractive indices we underestimate in case of extraordinary polarization. It is interesting that at static limit and, accordingly our prediction with PBESOL0 functional, this difference tends to be about in the region between nm and nm.
5 Conclusions
We demonstrate self-consistency in ab initio quantum mechanical calculations of elastic, elasto-optical and optical properties for ferroelectric LN crystal in the regions of low and high frequencies and predict an extinction coefficient property of LN crystal in the infrared region. The good agreement of DFT calculations with the use of hybrid functional PBESOL0 with the discussed here data is demonstrated.
Acknowledgements
The work was funded by the Ministry of Education and Science of Russia under Competitiveness Enhancement Program of Samara University for 2013-2020, project 3.5093.2017/8.9.
References
- [1] R.S. Weis and T.K. Gaylord, Appl. Phys. A37, 191 (1985).
- [2] Electronic recourse: materials.springer.com
- [3] M. Jazbinsek and M. Zgonik, Appl. Phys. B74, 407 (2002).
- [4] A.S. Andrushchak et al., J. Appl. Phys. 106, 073510 (2009).
- [5] A.S. Barker, Jr. and R. Loudon, Physical Review 158, 433 (1967).
- [6] I.P. Kaminov and D.W.Johnston Jr., Phys. Rev. 160, 519 (1967).
- [7] A. Ridah, M. D. Fontana and P. Bourson, Phys. Rev. B 56, 5967 (1997).
- [8] A. Ridah, P. Bourson, M. D. Fontana and G. Malovichko, J. Phys.: Condens. Matter 9, 9687 (1997).
- [9] U. T. Schwarz and M. Maier, Phys. Rev. B 55, 11041 (1997).
- [10] M. R. Chowdhury, G. E. Peckham and D. H. Saunderson, J.Phys.C: Solid State Phys. 11, 1671 (1978).
- [11] Y. Repelin, E. Husson, F. Bennani and C. Proust, J. Phys. Chem. Solids 60, 819 (1999).
- [12] R. Claus, G. Borstel, E. Wiesendanger and L. Steffan, Z. Naturforsch A 27, 1187 (1972).
- [13] X. Yang, G. Lan, B. Li and H. Wang, Phys. Stat. Sol. B142, 287 (1987).
- [14] M. Schall, H. Helm and S.R. Keiding, Int. J. Infrared and Millimeter Waves 20, 595 (1999).
- [15] J. R. Schwesyg, M. C. C. Kajiyama, M. Falk, et al., Appl. Phys. B100, 109 (2010).
- [16] P. Hohenberg, W. Kohn W. Phys. Rev. 136, B864 (1964).
- [17] W. Kohn, L.J. Sham, Phys. Rev. 140, (1965).
- [18] K. Parlinski, Z.Q. Li and Y. Kawazoe, Phys. Rev. B 61, 272(2000).
- [19] M. Veithen, X. Gonze, and P. Ghosez, Phys. Rev. Lett. 93, 187401 (2004).
- [20] W. G. Schmidt, M. Albrecht, S. Wippermann et al., Phys. Rev. B77, 035106 (2008).
- [21] S. Mamoun, A.E. Merad and L. Guilbert, Comp. Mat. Sci. 79, 125 (2013).
- [22] Ya. Li, W.G. Schmidt, and S. Sanna, Phys. Rev. B89, 094111 (2014).
- [23] S. Dan-Dan, W. Qing-Lin, H. Chong, C. Kai, and P. Yue-Wu, Chin. Phys. B24, 077104 (2015).
- [24] A. Riefer, M. Friedrich, S. Sanna, U. Gerstmann, A. Schindlmayr, and W. G. Schmidt, Phys. Rev. B93, 075205 (2016).
- [25] R. Dovesi et al., Int. J. Quantum. Chem. 114, 1287 (2014).
- [26] F. Pascale, C. M. Zicovich-Wilson, F. Lopez, B. Civalleri, R. Orlando, R. Dovesi, J. Comp. Chem. 25, 888 ( 2004).
- [27] M. Ferrero, M. Rerat, R. Orlando, R. Dovesi, J. Comp. Chem. 29, 1450 (2008).
- [28] A. Erba, R. Dovesi, Phys. Rev. B88, 045121 (2013).
- [29] A. Erba, A. Mahmout, R. Orlando, R. Dovesi, Phys. Chem. Minerals. 41, 151 (2014).
- [30] A. Erba, Kh. E. El-Kelany, M. Ferrero, I. Baraille, and M. Rerat. Phys. Rev. B88, 035102 (2013).
- [31] J. P. Perdew, A. Ruzsinszky, G. I. Csonka, O. A. Vydrov, G. E. Scuseria, L. A. Constantin, X. Zhou, and K. Burke. Phys. Rev. Lett. 100, 136406 (2008).
- [32] G. Sophia, P. Baranek, C. Sarrazin, M. Rerat, R. Dovesi, Phase Transitions: A Multinational Journal 81, 1069 (2013).
- [33] A.V. Postnikov, V. Caciuc, G. Borstel, J. Phys. and Chem. Sol. 61, 295 (2000).
- [34] A.W. Warner, M. Onoe, and G.A. Coquin, J. Acoust. Soc. Am 42, 1223 (1967).
- [35] G.D. Boyd, W.L. Bond, H.L. Carter, J. Appl. Phys. 38, 1941 (1967).
- [36] I.A. Dankov, E.F. Tokarev, G.S. Kudryashov, and K.G. Belobaev, Inorg. Mater. 19, 1049 (1983).
- [37] R.T. Smith, and F.S. Welsh, J. Appl. Phys. 42, 2219 (1971).
- [38] R.J. O’Brein, G.J. Rosasco and A. Weber, J. Opt. Soc. Am. 60, 14 (1970).
- [39] D.H. Junt, M.M. Fejer, and R.L. Byer, J. Quant. Elec. 26, 135 (1990).