SNSN-323-63
Latest ATLAS measurements of top quark properties using events.
Frédéric Derue111On behalf of the ATLAS Collaboration
Laboratoire de Physique Nucléaire et de Hautes Energies (LPNHE), UPMC, Université Paris-Diderot, CNRS/IN2P3, Paris, France
Recent measurements of top quark properties with events collected by the ATLAS experiment in proton-proton collisions at the center of mass energy and TeV, are presented. The measurements of the top quark width, spin and spin correlations, polarisation, the boson helicity fractions, charge and CP asymmetries are discussed. Finally, recent results obtained on colour flow effects in events are presented. All the measurements are consistent with the Standard Model expectations.
PRESENTED AT
International Workshop on Top Quark Physics
Braga, Portugal, September 17–22, 2017
1 Introduction
The top quark is the heaviest fundamental particle in the Standard Model (SM) of particle physics. It has a lifetime shorter than the hadronisation timescale and gives the unique opportunity to study the properties of a “bare” quark. The huge top quark sample collected by the ATLAS experiment [1] at the Large Hadron Collider [2] at CERN allow to perform precision tests of the SM. The measurements reported here use events collected by the ATLAS detector in proton-proton collisions at the center of mass energy and TeV in which a pair is produced. Monte Carlo (MC) simulated event samples with full detector simulation are used to model the signal and backgrounds [4].
2 Top quark polarisation and spin correlation
Top quark pairs produced by the strong interaction have essentially unpolarised spins. However, the spins of the top quark and top anti-quark are expected to be correlated. As the top quark decays before it hadronises, information about the top quark spin is passed on to its decay products and the strength of the spin correlation can be measured using angular distributions. The measurement of 15 spin observables is performed using of TeV collision data in the dilepton channel [5]. The normalised double-differential cross section for production and decay is:
| (1) |
where and are the polarisation and spin correlation coefficients along spin quantisation axes and respectively and () is the angle between the positive (negative) lepton and quantisation axis (). Different spin quantisation axes can be chosen, each with a different expected spin correlation or polarisation strength. The most commonly chosen axes used is the helicity axis, , in which the spin quantisation axis is chosen as the direction of the top quark in the system rest frame. The angle is then formed using this axis and the direction of the charged lepton in the top quark rest frame. are 6 polarisation coefficients, and are 9 spin correlation coefficients. All measured coefficients are in good agreement with the SM theoretical expectations, within uncertainties. The largest contribution to the uncertainty may vary for the different measured parameters, in general it is due to signal modeling and accounts for approximately 80% of the total systematic uncertainty.
3 Charge asymmetry
Production of pairs is predicted to be symmetric under charge conjugation at leading order in quantum chromodynamics (QCD) in the SM. However, at next-to-leading order a small (1%) charge asymmetry is introduced resulting in the rapidity distribution being slightly broader for top quarks than for top anti-quarks. This asymmetry is passed on to the decay products of the top and top anti-quark and thus also exists between the charged leptons in dilepton events. Although the charge asymmetry is predicted to be small in the SM, beyond the SM physics can cause it to be enhanced. The charge asymmetry is defined as:
| (2) |
where , while the lepton-based charge asymmetry is defined as:
| (3) |
where . The measurement of these asymmetries is performed using of TeV collision data in the lepton+jets and dilepton channels [6, 7]. In addition to the inclusive measurements of and , these asymmetries are measured versus other variables, such as the invariant mass of the system, . Beyond the SM physics may enhance the charge asymmetry at high for example due to the presence of a heavy resonance decaying to a pair. In all cases, the data are well modelled by the SM prediction and consistent with only a small charge asymmetry.
4 asymmetries
violation can be probed using weakly decaying -hadrons from top quark decays using of TeV collision data in the lepton+jets channel [8]. The charge of the lepton is used to determine the charge of the -quark at production, . Events are then required to contain an additional muon associated to a -tagged jet, this is known as a “soft muon” and is used to determine the charge of the -quark when it decays, . Given the number of events with charges and , , same-sign, , and opposite-sign, , charge asymmetries are constructed:
| (4) |
where is the number of events in which the charged lepton has positive (negative) charge. The measured values are and , consistent with zero. From these measurements, four CP asymmetries (one mixing and three direct) are measured and are found to be compatible with zero and consistent with the SM expecations.
5 helicity measurement in top quark events
The boson from the top quark decay has only left-handed and longitudinal polarisation, the right-handed polarisation is heavily suppressed. The corresponding helicity fractions are determined by the vertex structure and are measured using of TeV collision data in the lepton+jets channel [9]. They are extracted from the angular distributions of the decay products through the normalised differential cross section:
| (5) |
where is the angle between the direction of flight of the top quark in the rest frame and the direction of flight of the lepton or the -type quark for the leptonic or hadronic decay, respectively. Templates correspondings to the distributions for the three helicity components, and for both hadronic and leptonic top decays, are used to obtain the best description of the measured distributions, and to extract the helicity fractions. The measurement on the leptonic side is the most sensitive since the hadronic side is affected by a worse separation power and by larger uncertainties. The fitted fractions of longitudinal, left- and right-handed polarisation states are , and . No significant deviation from SM prediction is observed, thus limits on anomalous couplings of the vertex are also set.
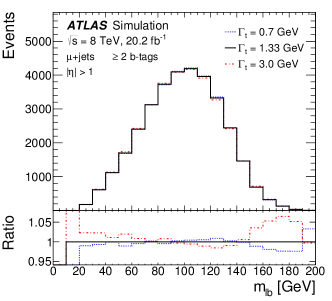
6 Direct measurement of the top quark decay width
The first direct measurement of the top quark decay width is done using of TeV collision data in the lepton+jets channel [10]. Two variables sensitive to decay width of top quark are used: - invariant mass of lepton and corresponding -jet from top quark decay (see Fig. 1) and - between -jet from hadronically decaying top and closest light jet from hadronically decaying boson. Events are split by lepton flavour (e or ), number of -tagged jets (exactly one -tagged jet and at least two b-tagged jets) and jet to decrease systematic uncertainties in jet energy reconstruction. Templates with different widths are fitted to data and the measured width is:
| (6) |
assuming top mass GeV. Measurement is limited by jet energy reconstruction and signal modelling uncertainties. The measured width is in good agreement with the SM prediction.
7 Colour flow
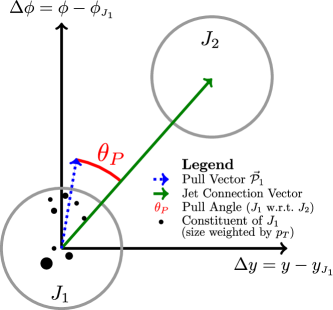
In nature only colour neutral hadrons can be observed, and direct measument of the quantum chromodynamics (QCD) interaction of their constituents is not possible. Quark and gluons are measured as jets, but colour connection influences jet form, structure and event topology. An observable expected to carry colour information about a jet is the pull vector, a -weighted radial moment of the jet, computed from its constituents. For a dijet system is the pull angle, between the pull vector and the vector connecting the two jets (see Fig. 2). In the lepton+jets event topology, the jets originating from the hadronic decay are colour connected, while the two -tagged jets are not. These observables are studied using of TeV collision data in the lepton+jets channel [11].
After bin-by-bin background subtraction, and removing effects of the detector smearing as obtained from simulation, the signal distributions are then unfolded to a particle-level spectrum, using an Iterative Bayesian method. As a result, a general good agreement can be found with SM predictions, even if observables sensitive to colour flow remain poorly modelled.
8 Conclusion
The large number of pairs collected by the ATLAS experiment allows to make precise measurements of top quark properties. All top quark properties, measured using the data collected in LHC Run 1 and the first round of Run 2, are in good agreement with the SM expectations.
References
- [1] The ATLAS Collaboration, JINST 3 S08003 (2008)
- [2] Lyndon Evans and Philip Bryant, JINST 3 S08001 (2008)
- [3] The ATLAS Collaboration, Eur. Phys. J. C77 (2016)
- [4] The ATLAS Collaboration, Eur. Phys. J. C 70 (2010) 823
- [5] The ATLAS Collaboration, JHEP 03 (2017) 113
- [6] The ATLAS Collaboration, Eur. Phys. J. C76 (2016) 87
- [7] The ATLAS Collaboration, Phys. Rev. D94 (2016) 032006
- [8] The ATLAS Collaboration, arXiv:1709.04207
- [9] The ATLAS Collaboration, Eur. Phys. J. C 77 (2017) 264
- [10] The ATLAS Collaboration, JHEP 02 (2017) 071
- [11] The ATLAS Collaboration, ATLAS-CONF-2017-069