The detonation of a sub-Chandrasekhar-mass white dwarf at the origin of the low-luminosity Type Ia supernova 1999by
Abstract
While Chandrasekhar-mass () models with a low yield can match the peak luminosities of fast-declining, 91bg-like Type Ia supernovae (SNe Ia), they systematically fail to reproduce their faster light-curve evolution. Here we illustrate the impact of a low ejecta mass on the radiative display of low-luminosity SNe Ia, by comparing a sub- model resulting from the pure central detonation of a C-O White Dwarf (WD) to a delayed-detonation model with the same yield of 0.12 . Our sub- model from a 0.90 WD progenitor has a d shorter rise time in the integrated UV-optical-IR (uvoir) luminosity, as well as in the -band, and a per cent higher peak uvoir luminosity ( mag brighter peak ). This sub- model also displays bluer maximum-light colours due to the larger specific heating rate, and larger post-maximum uvoir and -band decline rates. The luminosity decline at nebular times is also more pronounced, reflecting the enhanced escape of gamma rays resulting from the lower density of the progenitor WD. The deficit of stable nickel in the innermost ejecta leads to a notable absence of forbidden lines of [Ni ii] in the nebular spectra. In contrast, the model displays a strong line due to [Ni ii] 1.939 m, which could in principle serve to distinguish between different progenitor scenarios. Our sub- model offers an unprecedented agreement with optical and near-infrared observations of the 91bg-like SN 1999by, making a strong case for a WD progenitor significantly below the Chandrasekhar-mass limit for this event and other low-luminosity SNe Ia.
keywords:
radiative transfer – supernovae: general – supernovae: individual: SN 1999by1 Introduction
The Chandrasekhar mass for white dwarf (WD) stars ( ) no longer appears to represent a fundamental quantity for Type Ia supernova (SN Ia) progenitors. The standard scenario involves a C-O WD that undergoes runaway carbon fusion as it approaches through accretion from a non-degenerate binary companion star (Whelan & Iben, 1973). However, recent studies have demonstrated a reasonable agreement with observations through detonations of single sub- WDs (e.g. Sim et al., 2010), or in double-WD mergers whose combined mass can either exceed (e.g. Pakmor et al., 2013) or remain below this limit (van Kerkwijk et al., 2010). Such models provide viable alternatives to the standard scenario and can account for the observed SN Ia rate (e.g. Ruiter et al., 2011; Ruiter et al., 2013). Variations in the mass of the exploding WD result in a range of yields that can reproduce the observed diversity in peak luminosity.
In particular, low-luminosity SNe Ia similar to the prototypical SN 1991bg (and hence termed 91bg-like SNe Ia; see Taubenberger et al. 2008 for a review) appear difficult to reconcile with a Chandrasekhar-mass ejecta. These 91bg-like SNe Ia share similar properties, with peak integrated UV-optical-IR (hereafter uvoir) luminosities (cf. for more typical events), corresponding to a yield of only . Their rapid light-curve evolution around maximum light, along with the earlier appearance of an emission-line dominated spectrum characteristic of the nebular phase, prompted their association with sub- progenitors (Filippenko et al. 1992; Leibundgut et al. 1993; Ruiz-Lapuente et al. 1993). Subsequent spectroscopic modeling of nebular-phase spectra constrained the innermost ejecta layers to have a substantially lower density than models (Mazzali et al., 2011; Mazzali & Hachinger, 2012), a property that naturally follows from the explosion of a lower-mass WD progenitor.
The merger of two equal-mass WDs also results in a lower density ejecta (Pakmor et al., 2010). The low mass synthesized in the detonation of the merged system is compatible with the low peak luminosity of 91bg-like SNe Ia. However, the predicted light curves are too broad owing to the large ejecta mass ( ). Pakmor et al. (2013) speculate that the merger of a less massive system consisting of a 0.9 C-O WD and a He WD companion could reconcile their model with low-luminosity SNe Ia, although this remains to be demonstrated with radiative-transfer simulations.
The ejecta mass therefore stands out as a key discriminant between these different progenitor scenarios, hence the importance of studying its impact on the radiative display of low-luminosity SNe Ia. In Blondin et al. (2013) we were able to reproduce the maximum-light properties of the 91bg-like Type Ia SN 1999by with a delayed-detonation model, but subsequently found this model to decline too slowly past maximum light. In contrast, a sub- model with the same yield not only matches the peak luminosity, but also declines more rapidly past maximum, with a mag larger -band decline rate, . Such a model is thus in better agreement with the faint end of the width-luminosity relation (Blondin et al., 2017). Here we test the potential for this sub- model to reproduce the full photometric and spectroscopic evolution of SN 1999by from a few days past explosion ( d before maximum) until well into the nebular phase ( d past maximum). We also search for unambiguous observational signatures of a low progenitor mass for low-luminosity SNe Ia.
This paper is organized as follows: In Section 2 we present our input hydrodynamical models for the explosion. We then discuss the impact of a low ejecta mass on the radiative display of low-luminosity SNe Ia in Section 3, by comparing a sub- model to a delayed-detonation model with the same yield of 0.12 . The present study is similar in spirit to the recent work of Wilk et al. (2017), who studied the impact of the WD mass for more luminous SN Ia models yielding of , and including ejecta masses below, at, and above . In Section 4, both the sub- and models are confronted to optical and near-infrared (NIR) observations of the low-luminosity SN 1999by. We discuss possible progenitor scenarios leading to the detonation of a sub- WD and present our conclusions in Section 5.
2 Input hydrodynamical models
| Property | Unit | DDC25 | SCH2p0 |
|---|---|---|---|
| Global properties | |||
| M⊙ | 1.41 | 0.90 | |
| erg | 1.18 (51) | 8.14 (50) | |
| erg g-1 | 4.20 (17) | 4.54 (17) | |
| km s-1 | 8132 | 8815 | |
| M⊙ | 0.117 | 0.116 | |
| 0.083 | 0.129 | ||
| km s-1 | 8559 | 10520 | |
| M⊙ | 0.792 | 0.607 | |
| M⊙ | 2.30 (2) | 1.36 (3) | |
| M⊙ | 6.61 (2) | 1.88 (2) | |
| Elemental yields at 0.75 d past explosion | |||
| M⊙ | 0.137 | 0.109 | |
| M⊙ | 9.77 (2) | 2.21 (2) | |
| M⊙ | 1.13 (4) | 1.58 (5) | |
| M⊙ | 3.09 (7) | 1.02 (7) | |
| M⊙ | 2.40 (2) | 3.01 (2) | |
| M⊙ | 0.239 | 0.173 | |
| M⊙ | 0.481 | 0.281 | |
| M⊙ | 3.64 (2) | 2.01 (2) | |
| M⊙ | 1.53 (4) | 3.93 (5) | |
| M⊙ | 0.278 | 0.177 | |
| M⊙ | 2.17 (2) | 7.42 (3) | |
| Maximum-light propertiesa | |||
| day | 21.0 | 15.9 | |
| day | 19.8 | 14.6 | |
| erg s-1 | 2.62 (42) | 3.17 (42) | |
| erg s-1 | 2.10 (42) | 2.80 (42) | |
| erg s-1 | 2.06 (42) | 2.72 (42) | |
| erg s-1 g-1 | 7.36 (8) | 1.52 (9) | |
| 1.24 | 1.13 | ||
| 0.53 | 0.52 | ||
| mag | 16.44 | 17.27 | |
| mag | 1.33 | 0.76 | |
| (Si ii 6355 Å) | km s-1 | 8600 | 10224 |
| km s-1 | 9122 | 10848 | |
| Magnitude decline rates | |||
| mag | 0.62 | 0.85 | |
| mag | 1.01 | 1.64 | |
| dd | mag day-1 | 0.029 | 0.036 |
| dd | mag day-1 | 0.024 | 0.023 |
The sub- model studied here results from the pure central detonation of a sub- WD in hydrostatic equilibrium, composed of equal amounts of 12C and 16O by mass, with traces of 22Ne and solar composition for all other isotopes. Importantly, we do not consider the presence of an external He shell, required in the double-detonation scenario to trigger a detonation in the C-O core. This model has already been presented in Blondin et al. (2017) alongside a larger grid of sub- models spanning WD masses between 0.88 and 1.15 , corresponding to yields between 0.08 and 0.84 . In what follows, we focus on model SCH2p0 resulting from the detonation of a 0.90 WD with a yield of 0.12 (Table 1). Given the low mass, the luminosity is expected to reach a peak value comparable to low-luminosity, 91bg-like events. The yield is within 0.001 of the delayed-detonation model DDC25 of Blondin et al. (2013).111We have recomputed this model in the same vein as model DDC15 presented in Blondin et al. (2015), by applying a small radial mixing to the hydrodynamical input to smooth sharp variations in composition. Apart from the two-step decay chain, we also treat eight additional two-step decay chains associated with 37K, 44Ti, 48Cr, 49Cr, 51Mn, 52Fe, 55Co, 57Ni, and a further six one-step decay chains associated with 41Ar, 42K, 43K, 43Sc, 47Sc, 61Co (see Dessart et al., 2014c). Therefore, the model differs slightly from the version published in Blondin et al. (2013). In this study, we will repeatedly compare both models with one another to isolate the impact of the WD mass on the radiative display for a given mass.
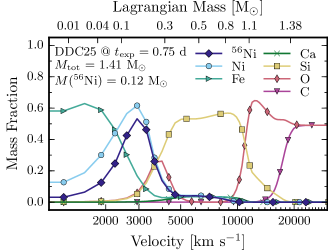
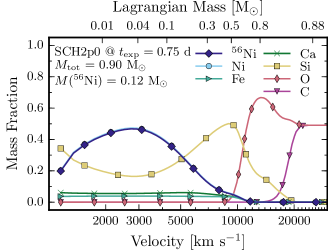
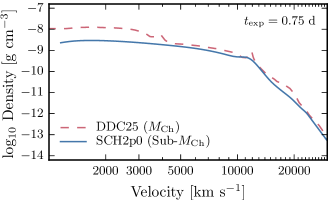
The abundance profiles of selected species for both models are shown in Fig. 1, along with the density profile at 0.75 d past explosion.222This time corresponds to the start of the radiative-transfer calculations for the sub- model SCH2p0. Those for the model were started at 0.5 d past explosion. The abundance profiles are nearly indistinguishable beyond . This velocity corresponds to a mass coordinate of for the model ( per cent of the total mass), and to for the sub- model ( per cent of the total mass). The mass contained beyond is thus larger for the model ( ) compared to the sub- model ( ). In these outer layers, the pre-expansion during the initial deflagration phase in the model results in similar combustion densities as in the sub- WD progenitor.
The inner of the model is dominated by stable iron-group elements (IGEs). Stable isotopes dominate the Ni abundance (58Ni in the mass range 0.04–0.1 , 60Ni in the mass range 0.02–0.04 , and 62Ni below 0.02 ), as well as the Fe abundance (54Fe above a mass coordinate of , primordial 56Fe — i.e. not from decay — in the mass range 0.01–0.04 , and 58Fe below ). The model is thus characterized by an inner region depleted in , commonly referred to as a “hole” (see Section 3.5).
In the inner of the sub- model, however, the lower combustion density (due to the lower density of the progenitor WD) results in an underproduction of stable IGEs. In these layers, the radioactive isotope constitutes per cent of the total Ni abundance, the remainder consisting of roughly two-thirds of radioactive 57Ni and one-third stable 58Ni. The iron mass fraction is a factor of ten lower than in the model in these inner layers ( cf. ) and consists of near-equal parts of radioactive 52Fe and stable 54Fe. A non-negligible amount of intermediate-mass elements (IMEs; here illustrated with Ca and Si) survives in these inner layers, contrary to the model where the combustion proceeds to the iron peak.
While the -rich layers extend to a larger mass coordinate in the model (0.79 cf. 0.61 in the sub- model for the layer containing 99 per cent of the total mass; see Table 1), this mass coordinate corresponds to a smaller fraction of the total WD mass ( per cent cf. per cent). The result is a mass buffer above the -rich layers that is a factor of two larger in the model ( ) compared to the sub- model ( ). Such variation in the distribution has important consequences for the light-curve evolution and spectroscopic properties.
Almost the entire C-O WD is burnt in both models, with the per cent of unburnt material located at velocities beyond . As a result, the ratio of asymptotic kinetic energies is comparable to the ratio of WD masses, and the specific kinetic energy () is per cent larger in the sub- model, as is the mass-weighted mean velocity (due to the factor of lower binding energy of the progenitor WD; see Table 1).
3 The effects of a sub- ejecta on the radiative display
3.1 Radiative-transfer simulations
As in our previous SN Ia studies (Blondin et al., 2013; Blondin et al., 2015; Blondin et al., 2017; Dessart et al., 2014a, b, c) we use the 1D, time-dependent, non-LTE radiative-transfer code cmfgen of Hillier & Dessart (2012) to compute the light curves and spectra based on our input hydrodynamical models. We use the same outputs as published in Blondin et al. (2017), and refer the reader to that paper for more details. The energy from radioactive decays is assumed to be deposited locally during the first 10-15 days past explosion depending on the model. At later times, we solve for the transport of -rays produced in such decays using a Monte Carlo procedure that takes into account (inelastic) Compton scattering and photoelectric absorption but neglects pair production (see Appendix A in Hillier & Dessart, 2012). Several decays result in the emission of positrons, which are assumed to deposit their energy locally.
We generate filtered light curves by integrating our synthetic spectra over a given bandpass, weighted by the transmission function. For the uvoir luminosities, we integrate the full synthetic spectrum between the far UV ( Å) and the far IR ( m). The term “bolometric” luminosity is often used to refer to the uvoir luminosity, although this denomination then neglects the escaping high-energy radiation in the form of -rays resulting from the and other decay chains. While the -ray luminosity is in general negligible up until past maximum light, the recent observations of SN 2014J have revealed -ray lines within the first 20 days past explosion (Diehl et al., 2014). In what follows, we distinguish between the uvoir, -ray, and bolometric luminosities, such that . The light curves for the two models considered here are available in tabular form in Appendix A.
3.2 Impact on the UV-optical-IR evolution
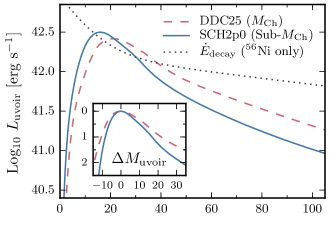
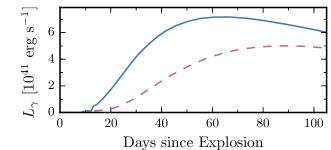
The detonation of a sub- WD results in a larger outward extent of the distribution compared to the delayed detonation of a progenitor (Fig. 1, upper panels). While the kinetic energy is per cent lower compared to the model, its value per unit mass is within per cent, resulting in a similar expansion rate. As a result, the diffusion timescale is typically shorter, and hence so are the rise times to peak uvoir luminosity ( d for the sub- model cf. d for the model; see Table 1 and Fig. 2). Despite having the same mass, the sub- model peaks at a per cent larger luminosity, since it radiates a similar amount of energy over a shorter time.333Alternatively, one can say that both models radiate a similar fraction of the total decay energy by uvoir maximum, as seen from the similar value of the ratio in Table 1. The same effect is seen in the higher-luminosity models of Wilk et al. (2017).
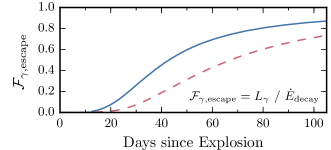
Before peak, all the energy associated with radioactive decays is deposited locally for both models. However, the larger outward extent of the distribution in the sub- model results in a larger -ray mean free path, which favours the earlier and enhanced escape of -rays from the lower-mass ejecta (Fig. 2, second and third panels).
The post-maximum uvoir decline is thus also faster in the sub- model ( mag, cf. 0.62 mag for the model), due to the lower rate of energy deposition. A low ejecta mass thus offers a natural explanation for the narrower uvoir light curves of low-luminosity SNe Ia (see Section 4).
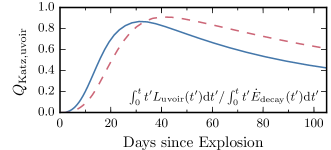
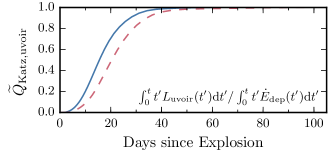
Owing to the non-negligible -ray escape fraction soon after maximum light in both models, the uvoir luminosity deviates significantly from the true bolometric luminosity. As a result, the ratio of the integral of the time-weighted uvoir luminosity to the integral of the time-weighted decay power (defined by Katz et al. 2013 and noted here), never quite reaches unity (corresponding to full -ray trapping), and starts to decline once the -ray escape fraction exceeds 10–20 per cent (Fig. 2, fourth panel). The use of this ratio to infer the mass for observed SNe Ia thus requires a -ray transport calculation to infer the decay power actually deposited in the ejecta (). The modified ratio
| (1) |
( replaced with in the denominator) indeed eventually reaches unity days past explosion in both models (Fig. 2, bottom panel), and illustrates the accuracy of energy conservation in our radiative-transfer simulations. Alternatively, one could use the true bolometric luminosity (i.e. including the contribution from -rays) and the decay power to compute:
| (2) |
which indeed reaches unity in both models around the same time as . Unfortunately, only a single SN Ia to date has measured -ray fluxes (SN 2014J; Diehl et al. 2014; Churazov et al. 2015).
At later times ( d past explosion), the uvoir luminosity simply tracks the instantaneous rate of energy deposition. The rate at which the luminosity declines at these times thus reflects the rate of change of the -ray escape fraction. While this rate is initially larger for the sub- model (Fig. 2, second panel), it becomes smaller than that of the model by 50 d past explosion. As a result, the instantaneous uvoir magnitude decline becomes comparable for both models at 100 d past uvoir maximum, while it was per cent larger for the sub- model at 50 d past maximum (cf. values of and in Table 1). Throughout this time however, the absolute rate of -ray escape remains larger for the sub- model, and hence its uvoir luminosity remains lower than the model.
3.3 Impact on the colour evolution
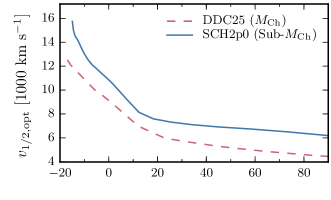
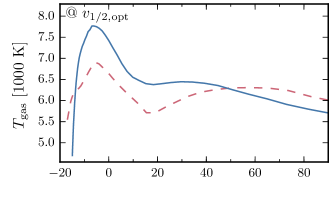
As in Blondin et al. (2015), we locate the spectrum-formation region using the velocity, , above which half of the optical flux (defined here to be in the range 3000–10000 Å) emerges (Fig. 3, top panel). The more extended distribution in the sub- model results in a more rapid and efficient heating of the corresponding ejecta layers before maximum light (Fig. 3, second panel). The gas temperature at this location reaches a maximum around d from maximum in both models, but it is higher for the sub- model ( K) compared to the model ( K), due to the larger specific heating rate from the higher -to-total mass ratio ( cf. erg s-1 g-1 for the model; see Table 1 and discussion in Blondin et al. 2017).
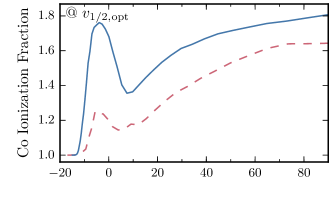
The higher ionization state of the gas in the sub- model, here illustrated with cobalt, reflects the higher temperature in the spectrum-formation region (Fig. 3, third panel; see also Wilk et al. 2017). The temperature increase at early times induces a shift in the ionization state of IGEs (from singly to doubly ionized) around d from uvoir maximum, resulting in a Co iii-dominated gas around maximum light (i.e. Co ionization fraction greater than 1.5) where the model remains largely dominated by Co ii.
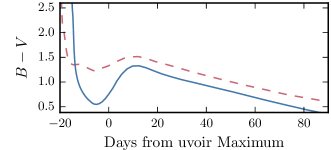
This difference in ionization state has a strong impact on the -band flux, which is efficiently blocked in the model owing to the presence of lines from once-ionized IGEs (Sc, Ti, Fe, and Co). These lines contribute less to the opacity of the more ionized sub- model. Thus, despite the increase in temperature in the spectrum-formation region at early times in both models, the colour index only reaches mag in the model, but is mag bluer in the sub- model shortly before maximum (Fig. 3, bottom panel). This minimum in the colour coincides with the maxima in the temperature and Co ionization fraction at .
After its pre-maximum peak, the temperature in the spectrum-formation region then decreases by K over a d timescale in both models, but the impact on the ionization state is more important in the sub- model and results in a large iiiii ionization shift of IGEs. The opacity in the band is increased accordingly, and the colour rapidly rises to a value comparable to the model around d past maximum. At later times, the temperature evolution is more gradual and starts to decline, yet the Co ionization steadily increases in both models due to non-thermal processes associated with decay (see Dessart et al., 2014c).
A lower ejecta mass thus not only affects the rate at which radiation energy escapes the ejecta (which impacts the uvoir evolution), but also the thermodynamic state of the gas (temperature and ionization state). The higher temperature and higher ionization state of the sub- model in the spectrum-formation region also applies to the ejecta as a whole, except in the inner ejecta layers around , where the mass fraction is higher in the model (see Fig. 1). At lower velocities ( ), the larger mass fraction contributes to maintain a higher temperature and ionization in the sub- model at late times, through (local) energy deposition by positrons emitted in decays (see discussion in Wilk et al. 2017).
3.4 Impact on the spectroscopic evolution
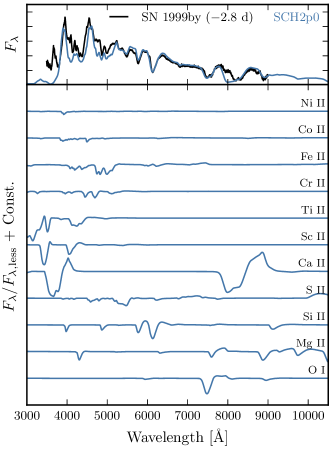
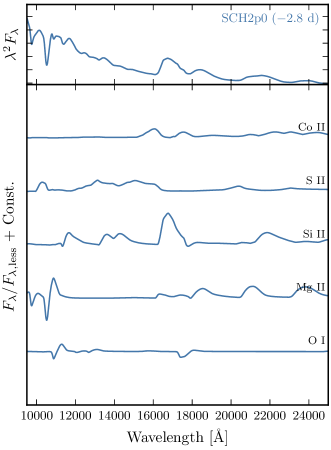
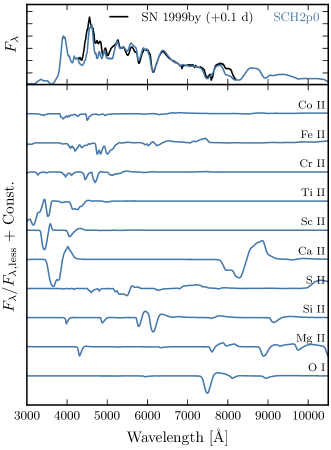
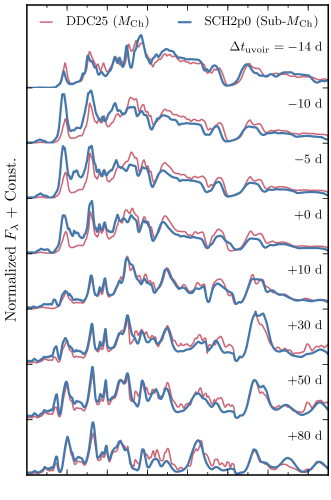
The spectroscopic evolution of both models at selected times from uvoir maximum is shown in Fig. 4. The overall similarity in spectral morphology is striking, the most notable differences occurring at the latest time shown ( d past uvoir maximum). Subtle differences in the SED are nonetheless visible (especially at the earliest times), as well as in the presence and shapes of certain lines. These differences are discussed in chronological order in what follows.
At the earliest time ( d), the temperature in the spectrum-formation region of the sub- model is lower than in the model at the same location (see Fig. 3, second panel), since this time corresponds to only days past explosion (cf. days for the model), when energy input from decay (with a d half-life) has not yet heated the layers from which the flux emerges. As a result, the SED of the sub- model is redder (as is the colour; Fig. 3, bottom panel), with stronger absorption features resulting from neutral species (e.g. Na i D, O i 7773 Å, C i 1.07 m doublet).
As time progresses ( d), the hotter ejecta of the sub- model produces an SED with a greater flux in the blue (primarily the band) compared to the model. The spectrum is increasingly influenced by lines: the continuum flux essentially vanishes by maximum light in both models. The higher iii/ii ionization ratio in the sub- model leads to less line-blanketing from once-ionized IGEs shortward of Å and a lower emissivity at redder wavelengths and in the NIR (see also Wilk et al. 2017). Conversely, the lower ejecta temperatures of the model result in a strong P-Cygni profile due to the Ca ii 1.19 m doublet that is largely absent from the sub- model, and to a more pronounced emission complex around 1.7 m due to Si ii.
Sub-dominant species (Sc, Ti, Cr) play a crucial role in shaping the SED in the blue part of the optical spectrum. In their once-ionized state, they cause strong line blanketing, even at low abundance. Multiple weak lines of Sc ii and Ti ii (and to a lesser extent Cr ii/Fe ii/Co ii) cause the prominent absorption trough around 4000–4500 Å characteristic of 91bg-like SNe Ia, despite their low mass fractions in the spectrum-formation region ( and at maximum light for Ti and Sc, respectively).
The larger outward extent of the distribution in the sub- model results in a spectrum-formation region located at higher velocities. Thus, even at post-maximum epochs where both models display very similar SEDs, the spectral features of the sub- model are broader and more strongly influenced by line overlap compared to their counterparts in the model (see e.g. the 6000–8000 Å region in the spectra at 10–80 d past maximum). Individual spectral lines are also broader and more blueshifted at a given time, as is the case for the Si ii 6355 Å line whose absorption velocity is 20 per cent larger (in absolute value) at uvoir maximum (see Table 1). However, the higher Ca ionization of the sub- model limits the formation of high-velocity absorption features in the Ca ii 8500 Å triplet around maximum light, in better agreement with observations of low-luminosity SNe Ia (see Section 4).
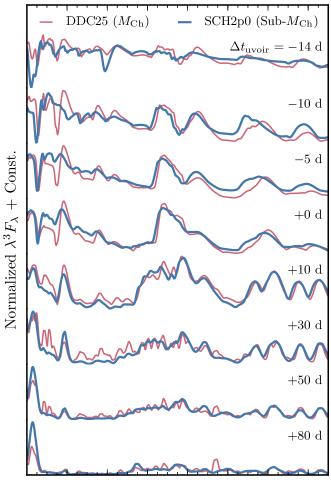
Both models predict weak features in the NIR associated with Co ii before maximum light, although they are initially weaker in the sub- model due to the higher iii/ii ionization ratio in the spectrum-formation region. Shortly after maximum light, these lines become stronger in the sub- model through both a decreasing Co ionization and an increasing Co abundance (almost exclusively from decay) in the NIR spectrum-formation region. As noted by Höflich et al. (2002), the Co ii/iii emission complex in the range 1.5–1.8 m characteristic of post-maximum SN Ia spectra is weaker compared to more luminous events, due to the more centrally-concentrated Co distribution and hence its lower relative abundance in the spectrum-formation region.
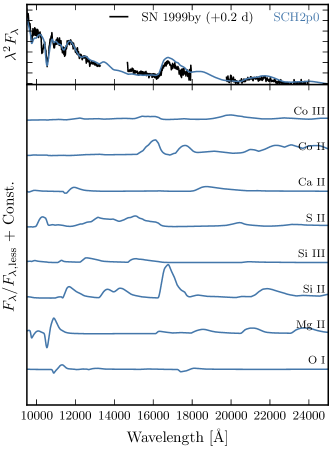
Combined with the higher ionization state, the lower ejecta density of the sub- model also favours the emergence of strong forbidden line transitions, in particular [Co iii] 5888 Å, as early as d past maximum. These forbidden lines are essential in cooling the ejecta at post-maximum epochs, and contribute to the temperature decline in the spectrum-formation region of the sub- model at d past maximum (Fig. 3; see also Dessart et al. 2014a). At such times, the 5888 Å transition alone contributes per cent of the total Co iii cooling rate at depths 2000–3000 , which is times larger in the sub- model than in the model. This line, sometimes mistaken for Na i D, is present in observed SN Ia spectra at post-maximum epochs, regardless of their luminosity.444We predict a Na i D feature in the model DDC25 starting around d past maximum, although its contribution to the emission at Å is minor relative to [Co iii] 5888 Å.
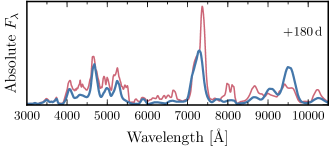
At later times ( d past maximum), the spectrum-formation region probes the innermost ejecta layers ( ). Because of the lower density of the sub- ejecta in these layers (Fig. 1, lower panel), the iiiii recombination is only partial. Moreover, the presence of in the inner ejecta of the sub- model results in local energy deposition from positrons (from decay), which further contributes to the higher Fe iii/Fe ii ionization ratio (Wilk et al., 2017). As a result, the NIR emissivity is significantly reduced compared to the model (see also Mazzali & Hachinger, 2012).
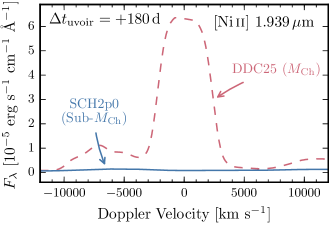
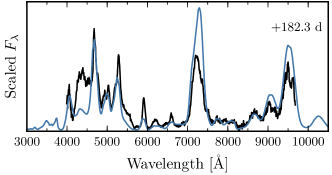
The broad emission feature spanning 7000–7500 Å in the synthetic spectra at 180 d past maximum has a distinct morphology in each model, with an additional emission component in the model due to [Ni ii] 7378, 7412 Å. This feature is absent from the sub- model due to the lack of stable Ni isotopes synthesized in the explosion, and could in principle serve as a diagnostic for the progenitor scenario (see Section 3.5 below). However, overlap with [Fe ii] 7155 Å, [Ca ii] 7291, 7324 Å, and [Ar iii] 7136, 7751 Å complicates the secure identification of this line in practice.
The three-peaked emission complex in the range 8500-9500 Å is due to the [Ca ii] 8500 Å triplet and the [S iii] 9068, 9530 Å doublet. The [S iii] lines are stronger in the sub- model, where Wilk et al. (2017) found an opposite correlation with ejecta mass for their more luminous SN Ia models.
3.5 Nebular [Ni ii] lines as a diagnostic of the progenitor mass
The isotopic composition of the innermost ejecta layers is sensitive to the density of the progenitor WD star, which is set by its mass at the time of explosion. In a sub- WD, fusion proceeds up the chain to the radioactive isotope . In a WD, however, the central density is at the time of explosion, which leads to electron captures during the explosive phase and the subsequent production of neutron-rich stable isotopes of IGEs (e.g. 54Fe, 58Ni; see Fig. 1). An observational consequence is the presence of forbidden lines of Ni in late-time spectra ( days or so past explosion) when the spectrum-formation region reaches down to . A sub- model, on the other hand, should exhibit no such Ni lines as the innermost ejecta is dominated by radioactive , which will have decayed to by that time. This is also the case for the violent merger of two sub- WDs, whose total mass can exceed but whose remnant has a central density characteristic of single sub- WDs ( ; Pakmor et al. 2010).
The detection of forbidden Ni lines in late-time SN Ia spectra thus offers a powerful diagnostic of the progenitor WD mass. Tentative identifications of [Ni ii–iv] lines have been previously reported in mid-IR spectra of the low-luminosity SN 2005df (Gerardy et al., 2007), and a more systematic study of the presence of such lines would contribute greatly to our understanding of SNe Ia.
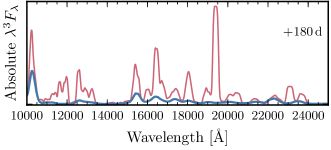
As noted above, the optical [Ni ii] 7378, 7412 Å lines predicted in the model (and absent from the sub- model) suffers from overlap with the neighbouring [Ca ii] 7291, 7324 Å doublet. In the NIR, however, we predict a strong [Ni ii] 1.939 m line in the model, in a region largely uncontaminated by other lines, and as early as d past maximum (see Fig. 4). The line is absent from the sub- model, whose absolute flux level is a factor lower at the line’s central wavelength at +180 d (Fig. 5). This line extends to in velocity space, and hence probes the inner ejecta layers containing stable Ni isotopes (predominantly 58Ni, but also 60Ni and 62Ni). The flat-topped profile extending over is an artefact of the spatial grid used for the radiative-transfer simulations, which is truncated at (and hence has a hollow core).
We also identify two weaker lines in the model due to [Ni ii] 2.308, 2.369 m (see Fig. 4, lower-right panel), and another further to the red due to [Ni ii] 2.911 m (not shown).
In theory, the lack of [Ni ii] lines in the sub- model could be due to a higher Ni ionization fraction (see previous section). However, we predict weak lines of [Ni iii] 3.393, 3.801 m in both models, which are an order of magnitude stronger in the model despite the lower Ni iii/Ni ii ratio compared to the sub- model.
The prediction of a strong [Ni ii] 1.939 m line is thus mainly an abundance effect: at 180 d past maximum (corresponding to half-lives of ), the Ni abundance is set by the amount of stable isotopes (mostly 58Ni), which is a factor higher in the model (see Table 1). The ratio of [Ni ii] 1.939 m line fluxes is significantly larger than this (see above), so the higher density and lower ionization of the inner ejecta seem to enhance the observed signature, and complicates the determination of the (stable) Ni abundance based on this feature (see also Wilk et al., 2017).
The detection of this [Ni ii] 1.939 m line in a SN Ia would nonetheless strongly favour a progenitor for that event. The required late-time NIR spectroscopy could be obtained with the upcoming JWST, since the location of this line at the blue edge of the band renders ground-based observations particularly challenging. Tentative identifications of this line have been reported in spectra of SN 2003du, SN 2011fe, and SN 2014J around 75–100 d past explosion by Friesen et al. (2014), although the emission is offset by +6000 (at 1.98 m) from its expected rest-wavelength location, and is associated with multiple lines of [Co iii] in our models of comparable luminosity (see Blondin et al., 2015).
Multi-dimensional simulations of delayed-detonation explosions do not predict an inner core dominated by stable IGEs: these are rapidly transported outward through buoyancy during the initial deflagration phase, and the inward mixed C/O fuel is mainly burnt to in the subsequent detonation (see e.g. Seitenzahl et al., 2013). However, the reported identification of Ni lines in late-time mid-IR spectra of SN 2005df (Gerardy et al., 2007) and SN 2014J (Telesco et al., 2015) suggests a lower level of mixing between the stable IGE core and the outer -rich layers than currently predicted during the initial deflagration phase in 3D hydrodynamical simulations. The velocity extent of Ni lines in nebular spectra could be used to constrain the level of outward mixing of stable IGEs during the explosion, and a velocity shift would indicate an explosion offset from the WD center (see e.g. Maeda et al., 2010).
4 Comparison to the low-luminosity SN 1999by
We confront both models to the low-luminosity SN 1999by, as was previously done for the model at maximum light in Blondin et al. (2013). SN 1999by was discovered independently on April 30th, 1999 by R. Arbour, South Wonston, Hampshire, England, and by the Lick Observatory Supernova Search (Arbour et al., 1999). It exploded in the Sb galaxy NGC 2841, well-known for having hosted three other supernovae (SN 1912A, SN 1957A, and SN 1972R). An optical spectrum taken three days after discovery secured its classification as a Type Ia supernova (Gerardy & Fesen, 1999), while a report based on a second optical spectrum taken on May 6th by Garnavich et al. (1999) not only confirmed the SN Ia classification, but also noted the large strength of the Si ii 5972 Å absorption feature relative to the neighbouring Si ii 6355 Å absorption, characteristic of low-luminosity, 91bg-like SNe Ia (Nugent et al., 1995).
SN 1999by is one of the best-observed low-luminosity SNe Ia, with a wealth of publicly-available data covering pre-maximum to nebular phases, at optical and NIR wavelengths. We use optical/NIR photometry and optical spectra published by Garnavich et al. (2004), with additional NIR photometry and spectroscopy from Höflich et al. (2002). We assume a distance modulus of 30.97 mag, which is 1 above the Cepheid distance to the host galaxy NGC 2841 inferred by Macri et al. (2001) ( mag), to ensure a good match to the peak luminosity of the sub- model (see below). We neglect extinction in the host-galaxy, as inferred by Garnavich et al. 2004 based on the late-time colour evolution. The Galactic reddening estimate of mag (i.e. mag for ) is derived from the IR dust maps of Schlegel et al. (1998). In what follows we correct the magnitudes and spectra of SN 1999by for reddening based on this value, assuming the standard extinction law of Cardelli et al. (1989).
4.1 UV-optical-IR evolution
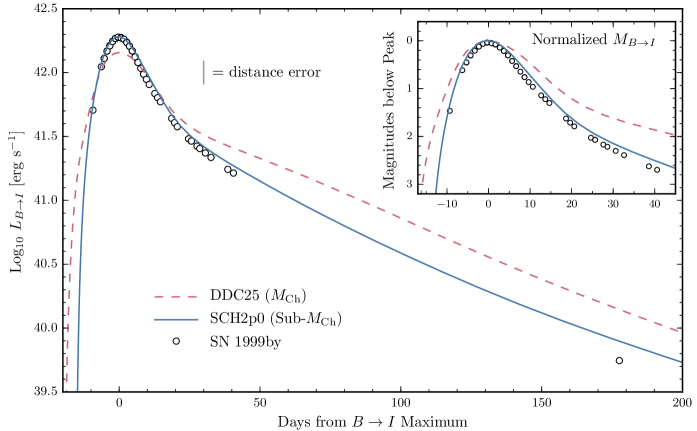
Due to the lack of UV observations of SN 1999by and the absence of NIR measurements beyond d past -band maximum (except for a single -band measurement around d), we approximate the uvoir luminosity by integrating fluxes using the same procedure as in Blondin et al. (2013). The resulting light curve for SN 1999by is shown in Fig. 6, along with the integrated light curves of the (DDC25; dashed line) and sub- (SCH2p0; solid line) models. As expected from our earlier analysis of the uvoir luminosity (Section 3.2), the sub- model reaches a per cent higher peak luminosity compared to the model despite having the same mass. The peak uvoir luminosity (taking into account the full UV-optical-IR range) is only per cent larger (see Table 1), owing to the larger fraction of flux emitted redward of the band in the cooler model.
Clearly, the sub- model is a better match to the overall luminosity evolution of SN 1999by. The peak luminosity of SN 1999by would be better matched by the model DDC25 with a lower assumed distance modulus (see above and Blondin et al. 2013), although this would only exacerbate the mismatch at earlier and later times (see Fig. 6 inset). The magnitude post-maximum decline rate is mag for SN 1999by, and compares well with the sub- model ( mag). The model, on the other hand, displays a mag smaller decline rate ( mag). The low-luminosity SN 1991bg also displays a larger post-maximum decline rate compared to more luminous events (Contardo et al., 2000; Stritzinger et al., 2006).
The sub- model reproduces better the late-time luminosity decline of SN 1999by compared to the model. This provides an additional argument in favour of an ejecta mass significantly below for this low-luminosity SN Ia (see Section 3.2).
4.2 Colour evolution
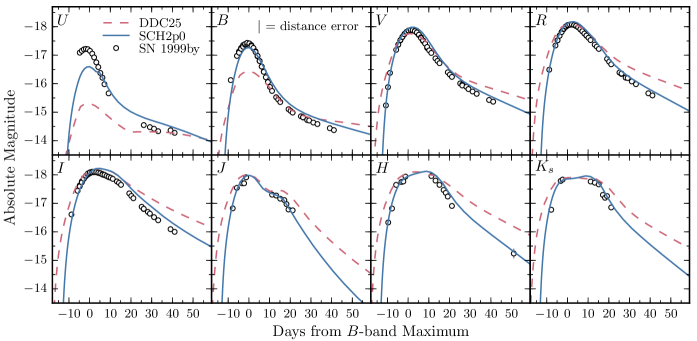
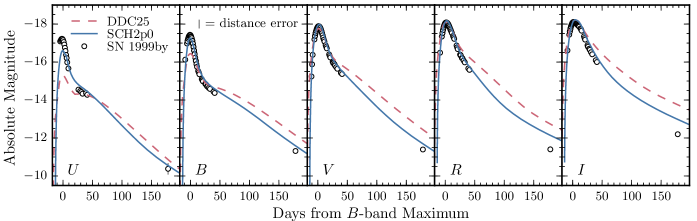
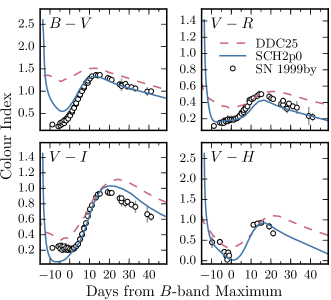
The faster uvoir evolution of 91bg-like SNe Ia compared to more luminous events results in narrower light curves in individual photometric bands (Fig. 7). This effect is modulated by the gradual reddening of the SED around maximum light, which causes a decrease in the post-maximum decline rate along the sequence (larger than the uvoir decline rate in all cases). The SN 1999by data illustrate the faster colour evolution in low-luminosity SNe Ia around maximum light, and are well matched by the sub- model (Fig. 8). This model also reproduces the steep early rise in the -band light curve, which is the only band with measurements earlier than 10 d before -band maximum.
The sub- model nonetheless overestimates the flux in the and bands at late times (Fig. 7, bottom panel), resulting in and colour indices that are mag too red compared to SN 1999by. This colour mismatch at late times explains the excess luminosity at d past maximum (see Fig. 6).
In the NIR, the earlier iiiii recombination of IGEs in low-luminosity SNe Ia leads to an earlier secondary maximum in compared to more luminous events (see e.g. Dhawan et al., 2017). For SN 1999by, the secondary maximum is barely noticeable in the band, resulting in a “shoulder” around 10–15 d past -band maximum, which is present in the sub- model where the model displays a genuine second peak. In the and bands, the secondary maximum appears to merge with the primary maximum. It is also more prominent, and better reproduced by the sub- model, owing to the larger Co ii emissivity in the NIR at these epochs (see Section 3.3; the same applies to the more luminous models of Wilk et al. 2017). The apparent broadness of these light curves around maximum thus results from a colour shift that is not apparent in the evolution of the integrated luminosity.
The success of the sub- model in reproducing the optical and NIR light curves of SN 1999by is nonetheless undermined by the obvious flux deficit in the band (and to a lesser extent in the band) at pre-maximum epochs, although the model displays an even larger flux deficit. In Section 3.3 we highlighted the impact of a low ejecta mass on the gas properties (higher temperature and ionization state) in the spectrum-formation region, which results in a bluer colour at maximum light. In Blondin et al. (2017) we found this to be the key ingredient to reproduce the faint end of the observed -band WLR. Despite the higher ejecta temperature, the colour of the sub- model is still too red compared to SN 1999by at pre-maximum epochs, by mag at d and mag at d (Fig. 8). Such offsets are not surprising given the artificial setup of our explosion models (see Section 2). More relevant to the present study are the relative differences between both models, and the closer match of the sub- model to SN 1999by throughout its evolution. In Section 5 we discuss ways in which our sub- model could be tuned to produce an even better match to SN 1999by.
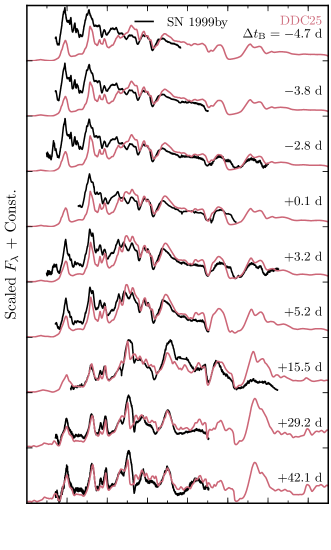
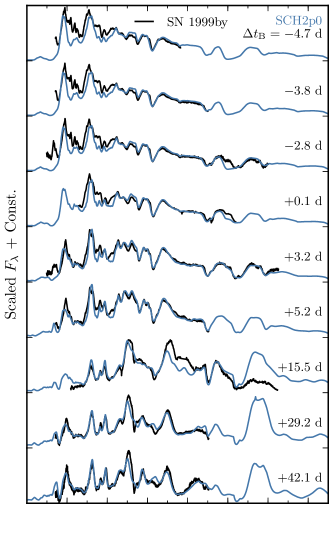
4.3 Optical spectroscopic evolution
We compare the optical spectroscopic evolution of both models to SN 1999by in Fig. 9. The prominent absorption trough around 4000–4500 Å is clearly visible, becoming stronger on its way to maximum light. This spectroscopic hallmark of 91bg-like SNe Ia is present in both models, although it remains significantly too strong in the model until a few days past maximum. The sub- model fares better in this respect, but fails to reproduce the narrow absorption features in this region present in SN 1999by up until maximum light. The sub- model also underestimates the flux blueward of Å owing to the low predicted ionization level and the resulting absorption by several lines of Sc ii and Ti ii (and to a lesser extent Cr ii). Redward of the band, the match to the SN 1999by spectra is far more satisfactory, in part due to the dominance of strong lines of IMEs, less sensitive to the ionization balance compared to weaker lines of heavier ions. This explains the good correspondence of the sub- model with the colour evolution of SN 1999by at early times, while the colour remains too red (Fig. 8).
4.3.1 Absence of C ii lines
Due to the low carbon abundance in the spectrum-formation region, combined with the low ionization level and low temperature at early times, we do not predict optical lines of C ii (e.g. the 6580 Å doublet) whose presence was inferred in spectra of the low-luminosity SN 2005bl (Taubenberger et al., 2008). The small dip in the Si ii 6355 Å emission profile in the earliest optical spectrum of SN 1999by (Fig. 9), associated with C ii 6580 Å by Taubenberger et al. (2008) in the case of SN 2005bl, is due to absorption by the Mg ii 6347 Å doublet in our sub- model (see also Fig. 11).
4.3.2 High-velocity absorption in the Ca ii 8500 Å triplet
High-velocity absorption features (HVFs) in the Ca ii 8500 Å triplet are common in early-time spectra of SNe Ia (Mazzali et al., 2005), sometimes causing a detached absorption feature blueward of the main component. A weak absorption in the blue wing of the main component is visible at Å in the earliest SN 1999by spectrum covering this wavelength range (at d from -band maximum; see also Blondin et al. 2012, their Fig. 20), and could correspond to a weak Ca ii HVF. Both models predict the presence of HVFs extending blueward of 8000 Å (corresponding to Doppler velocities ) up until maximum light, but they are suppressed at an earlier stage in the sub- model due to the increase in the Ca ionization level at high velocities caused by non-local energy deposition (see also Blondin et al., 2013). The weak absorption at Å in the sub- model synthetic spectrum at +0.1 d is indeed due to Ca ii (see Appendix B), and supports the association of this feature with an HVF in the SN 1999by spectra at this and earlier times.
The double-absorption morphology of the main Ca ii 8500 Å component results from overlap of the individual transitions composing the triplet (8498, 8542, and 8662 Å). By maximum light, the width of the Ca ii 8500 Å absorption in SN 1999by is well matched by the sub- model. Despite a possible mis-calibration of the +15.5 d spectrum redward of 6000 Å, the emission component of the Ca ii 8500 Å feature is obviously over-estimated in our models, possibly due to scattering of Co ii photons emitted in underlying layers (see Blondin et al., 2015).
4.3.3 Si ii 6355 Å absorption velocity
At maximum light, the Si ii 6355 Å absorption velocity for SN 1999by is approximately , as in the sub- model. The model, however, displays a lower blueshift. As noted in Section 3.4, the higher velocity location of the spectrum-formation region in the sub- model leads to broader and more blueshifted absorption profiles, in better agreement with the line-profile morphology of SN 1999by.
4.3.4 Post-maximum evolution out to the nebular phase
At later times, both models reproduce the overall SED of SN 1999by, as expected from the comparison of their broad-band colours in Fig. 8, but the model displays small-scale variations not present in the data. The sub- model matches better the typical widths of spectral features, although SN 1999by displays even narrower features, e.g., on either side of the Cr ii emission peak at Å between +15.5 d and +42.1 d. The strength of the [Co iii] 5888 Å emission feature in the SN 1999by spectrum at +42.1 d pleads in favour of the higher ionization state and lower ejecta densities of the sub- model.
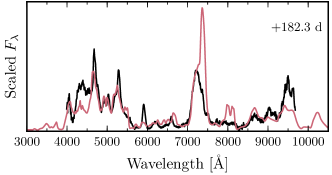
The nebular-phase spectrum of SN 1999by at +182 d past maximum (Fig. 9, lower panel) does not appear to display the predicted narrow emission feature due to [Ni ii] 7378, 7412 Å in the model (see Section 3.4), although the flux scaling exacerbates the mismatch. The sub- model does not display [Ni ii] lines (see Sect. 3.5), but the [Ca ii] 7291, 7324 Å doublet contributes too much flux around 7300 Å relative to other lines, and is largely responsible for the excess flux in the - and -band light curves at this time (Fig. 7, bottom panel).
The double-peak emission profile due to [Cr ii] 8000, 8125 Å in the model is absent from the SN 1999by spectrum, which is then better matched by the sub- model in this range. The high ionization of the sub- model also results in the strong [S iii] 9068, 9530 Å lines (with a ratio) that are clearly visible in SN 1999by and nebular-phase spectra of other low-luminosity SNe Ia (e.g. SN 1991bg, Ruiz-Lapuente et al. 1993; SN 2003gs, Silverman et al. 2012). These [S iii] lines are also predicted in the higher-luminosity models of Wilk et al. (2017), but seem to be absent from nebular spectra of more luminous SNe Ia.
Both models underestimate the [Fe ii]-dominated emission feature around 4350 Å. As noted by Wilk et al. (2017), this feature is particularly sensitive to the Fe+/Fe2+ ionization ratio, which we compute consistently via a solution to the non-LTE time-dependent rate equations. Furthermore, neither model fully reproduces the narrow cores ( ) of the [Fe iii] 4700 Å emission feature and of the [Co iii] 5888 Å line. To confine the line-emitting region to , one would need to artificially reduce the density in the overlying layers (and hence increase the density in the underlying layers to conserve mass), or reduce the velocity extent of the distribution (and hence reduce the yield), since the Fe and Co abundances at this time are largely dominated by the decay products and , respectively. However, such arbitrary adjustments would violate the physical consistency of our input hydrodynamical model.
4.4 NIR spectral evolution
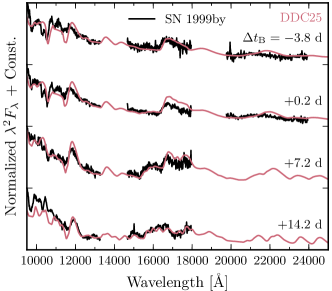
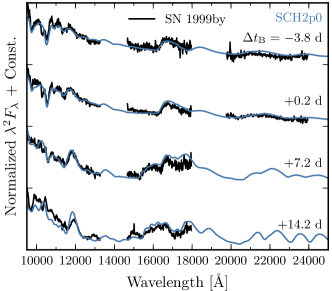
The NIR spectroscopic evolution of SN 1999by between d and d from -band maximum is shown in Fig. 10. Up until maximum light, the spectrum is mostly shaped by lines of IMEs (in particular, S ii, Si ii, and Mg ii), while lines of IGEs leave their imprint shortly thereafter (see Appendix B). At these times, the differences in the overall SED between the two models are less apparent in the NIR range than in the optical, and it is difficult to gauge the quality of their respective match to the SN 1999by data.
4.4.1 C i lines past maximum light?
Both models fail to reproduce the narrow absorption feature at m present in the SN 1999by spectra up until d past maximum. This feature is associated with the C i 1.07m doublet in both models at early times, but is largely gone by d from maximum, once the spectrum-formation region no longer probes the carbon-rich ejecta layers at (see Fig. 1). Höflich et al. (2002), however, were able to reproduce this line in their maximum-light synthetic spectra. Their 5p0z22.8 model is similar to our DDC25 model (in particular, both have the same deflagration-to-detonation transition density ), but differences in treatment of the burning front during the deflagration phase lead to less efficient burning in their model and to the presence of unburnt carbon at lower velocities. The carbon mass fraction reaches a maximum value of at in their model, favouring the emergence of C i lines, while it is an order of magnitude less in our DDC25 model at the same velocity.
5 Discussion and Conclusions
We have studied the impact of the progenitor WD mass on the radiative display of low-luminosity SNe Ia, illustrated here with the delayed-detonation model DDC25 of Blondin et al. (2013) and a sub- model resulting from the pure central detonation of a 0.90 WD progenitor (SCH2p0; Blondin et al. 2017). Both models have the same yield of 0.12 , and hence differ in their ratio. Although the setup for the progenitor and explosion scenario is somewhat artificial (1D, numerically-triggered explosion etc.; see Section 2), it allows us to assess the impact of the ejecta mass on the resulting light curves and spectra.
The lower ejecta mass of the sub- model results in a larger outward extent of the distribution for a given mass, and hence to a faster rise to peak luminosity and a more rapid post-maximum decline. The larger -to-total mass ratio leads to bluer colours at all times. Moreover, the higher mass fraction at larger velocities enhances the ionization state of the gas in the outer ejecta (ions primarily twice ionized rather than once ionized) where the flux emerges at early times, and limits line blanketing from once-ionized IGEs compared to the model. The spectrum-formation region is also located at higher velocities, giving rise to broader and more blueshifted absorption features. Taken together, the match to the UV-optical-IR luminosity, broad-band colours, and spectral evolution of the low-luminosity SN 1999by argues in favour of a sub- progenitor for this event and, by analogy, for other 91bg-like SNe Ia.
Höflich et al. 2002 were able to reproduce optical and near-infrared observations of SN 1999by with a standard delayed-detonation model similar to our DDC25 model. In particular, their 5p0z22.8 model predicts fast-evolving light curves in and , with a -band decline rate mag, similar to our sub- model SCH2p0 ( mag). Moreover, their synthetic maximum-light optical spectrum matches reasonably well the SN 1999by data (their Fig. 9). However, their light-curve calculations rely on averaged LTE opacities, and their spectral calculations do not include time-dependent terms in the radiative-transfer and rate equations, where only a subset of atomic levels are treated in non-LTE. Our more elaborate and consistent treatment of the radiation transport is probably more suited in this respect, although we cannot exclude differences in the input hydrodynamical models as contributing to our distinct model predictions. Such issues can only be resolved with detailed code-comparison studies based on benchmarked models, which are currently lacking for SNe Ia.
Our sub- model from a 0.90 WD progenitor SCH2p0 is similar in many respects to the 0.88 model of Sim et al. (2010). However, the yield for their model is lower (0.07 , cf. 0.12 for our SCH2p0 model), resulting in a less luminous and faster-evolving light curve, redder colours, and less blueshifted spectroscopic absorption features. Moreover, their maximum-light spectrum does not display the prominent absorption trough around 4000–4500 Å characteristic of 91bg-like SNe Ia (see their Fig. 3), which could be due to the quasi-absence of Ti/Sc above in their model (Sim, priv. comm.).
By construction, our spherically-symmetric ejecta cannot account for potential ejecta asymmetries resulting from the explosion. Given the supersonic propagation of the detonation front in our models, the 1D approximation is not really a limitation in this context (see Livne & Arnett, 1995). However, spectro-polarimetric observations of SN 1999by near maximum light have revealed an intrinsic polarization at the per cent level, suggestive of a well-defined axis of symmetry according to Howell et al. (2001). Given the overall agreement of the sub- model SCH2p0 with optical and NIR observations of SN 1999by, the impact of such asymmetries is not expected to dramatically affect the radiative display.
The recent detailed nucleosynthesic calculations of Shen et al. (2017) predict a significantly higher yield for a given WD mass, particularly for their low-mass models. The larger specific heating rate from the higher -to-total mass ratio should lead to bluer colours at early times, in better agreement with observations.
We reiterate the potential of the [Ni ii] 1.939 m line to constrain the presence and distribution of stable Ni isotopes predicted in the innermost ejecta of 1D models. While stable IGEs might be mixed outwards during the initial deflagration phase (see Section 3.5), detection of this line in nebular SN Ia spectra would provide an unambiguous signature of burning at high densities during the explosion, which can only be realized in a denser, near- WD progenitor.
The question remains whether plausible progenitor scenarios leading to detonations of sub- WDs exist in Nature. A generic problem of double-detonation models resides in the IGE-rich composition of the detonated accreted He shell, needed to trigger a secondary detonation in the C-O core (see e.g. Kromer et al., 2010). However, Shen & Moore (2014) succeeded in detonating a 0.005 He shell on a 1.0 WD, producing only 28Si and 4He. The subsequent detonation of the C-O core would in this case result in an ejecta with similar properties as our sub- model. This is also true of the head-on collision of two 0.5 WDs proposed by Kushnir et al. (2013), with a similar yield of 0.11 , although such collisions are predicted to account for at most a few per cent of the observed SN Ia rate (see e.g. Papish & Perets, 2016).
Regardless of the precise ignition mechanism, the results presented in this paper strongly suggest that low-luminosity SNe Ia similar to SN 1999by result from the explosion of sub- WDs. In an upcoming paper we will study the feasibility of such sub- models in reproducing the observed properties of more luminous events, to address the question of multiple progenitor channels for Type Ia supernovae.
acknowledgments
SB acknowledges helpful discussions with Roland Diehl, Marten van Kerkwijk, Ken Shen, Stuart Sim, and Jason Spyromilio. Part of this work was realized during a one-month visit of SB to ESO as part of the ESO Scientific Visitor Programme. LD and SB acknowledge financial support from the Programme National de Physique Stellaire (PNPS) of CNRS/INSU, France. DJH acknowledges support from STScI theory grant HST-AR-12640.01, and NASA theory grant NNX14AB41G. This work was granted access to the HPC resources of CINES under the allocation c2014046608 made by GENCI (Grand Equipement National de Calcul Intensif). This work also used computing resources of the mesocentre SIGAMM, hosted by the Observatoire de la Côte d’Azur, Nice, France. This research was supported by the DFG cluster of excellence “Origin and Structure of the Universe”. We thank the anonymous referee for a thorough review and useful suggestions that improved the quality of this manuscript.
References
- Arbour et al. (1999) Arbour R., Papenkova M., Li W. D., Filippenko A. V., Armstrong M., 1999, IAU Circ., 7156
- Arnett (1979) Arnett W. D., 1979, ApJ, 230, L37
- Arnett (1982) Arnett W. D., 1982, ApJ, 253, 785
- Bessell (1990) Bessell M. S., 1990, PASP, 102, 1181
- Blondin et al. (2012) Blondin S., et al., 2012, AJ, 143, 126
- Blondin et al. (2013) Blondin S., Dessart L., Hillier D. J., Khokhlov A. M., 2013, MNRAS, 429, 2127
- Blondin et al. (2015) Blondin S., Dessart L., Hillier D. J., 2015, MNRAS, 448, 2766
- Blondin et al. (2017) Blondin S., Dessart L., Hillier D. J., Khokhlov A. M., 2017, MNRAS, 470, 157
- Cardelli et al. (1989) Cardelli J. A., Clayton G. C., Mathis J. S., 1989, ApJ, 345, 245
- Churazov et al. (2015) Churazov E., et al., 2015, ApJ, 812, 62
- Cohen et al. (2003) Cohen M., Wheaton W. A., Megeath S. T., 2003, AJ, 126, 1090
- Contardo et al. (2000) Contardo G., Leibundgut B., Vacca W. D., 2000, A&A, 359, 876
- Dessart et al. (2014a) Dessart L., Hillier D. J., Blondin S., Khokhlov A., 2014a, MNRAS, 439, 3114
- Dessart et al. (2014b) Dessart L., Blondin S., Hillier D. J., Khokhlov A., 2014b, MNRAS, 441, 532
- Dessart et al. (2014c) Dessart L., Hillier D. J., Blondin S., Khokhlov A., 2014c, MNRAS, 441, 3249
- Dhawan et al. (2017) Dhawan S., Leibundgut B., Spyromilio J., Blondin S., 2017, A&A, 602, A118
- Diehl et al. (2014) Diehl R., et al., 2014, Science, 345, 1162
- Filippenko et al. (1992) Filippenko A. V., et al., 1992, AJ, 104, 1543
- Friesen et al. (2014) Friesen B., Baron E., Wisniewski J. P., Parrent J. T., Thomas R. C., Miller T. R., Marion G. H., 2014, ApJ, 792, 120
- Garnavich et al. (1999) Garnavich P., Jha S., Kirshner R., Berlind P., 1999, IAU Circ., 7159
- Garnavich et al. (2004) Garnavich P. M., et al., 2004, ApJ, 613, 1120
- Gerardy & Fesen (1999) Gerardy C., Fesen R., 1999, IAU Circ., 7158
- Gerardy et al. (2007) Gerardy C. L., et al., 2007, ApJ, 661, 995
- Hillier & Dessart (2012) Hillier D. J., Dessart L., 2012, MNRAS, 424, 252
- Höflich et al. (2002) Höflich P., Gerardy C. L., Fesen R. A., Sakai S., 2002, ApJ, 568, 791
- Howell et al. (2001) Howell D. A., Höflich P., Wang L., Wheeler J. C., 2001, ApJ, 556, 302
- Katz et al. (2013) Katz B., Kushnir D., Dong S., 2013, arXiv:1301.6766 [astro-ph]
- Kromer et al. (2010) Kromer M., Sim S. A., Fink M., Röpke F. K., Seitenzahl I. R., Hillebrandt W., 2010, ApJ, 719, 1067
- Kushnir et al. (2013) Kushnir D., Katz B., Dong S., Livne E., Fernández R., 2013, ApJ, 778, L37
- Leibundgut et al. (1993) Leibundgut B., et al., 1993, AJ, 105, 301
- Livne & Arnett (1995) Livne E., Arnett D., 1995, ApJ, 452, 62
- Macri et al. (2001) Macri L. M., Stetson P. B., Bothun G. D., Freedman W. L., Garnavich P. M., Jha S., Madore B. F., Richmond M. W., 2001, ApJ, 559, 243
- Maeda et al. (2010) Maeda K., Taubenberger S., Sollerman J., Mazzali P. A., Leloudas G., Nomoto K., Motohara K., 2010, ApJ, 708, 1703
- Mazzali & Hachinger (2012) Mazzali P. A., Hachinger S., 2012, MNRAS, 424, 2926
- Mazzali et al. (2005) Mazzali P. A., et al., 2005, ApJ, 623, L37
- Mazzali et al. (2011) Mazzali P. A., Maurer I., Stritzinger M., Taubenberger S., Benetti S., Hachinger S., 2011, MNRAS, 416, 881
- Nugent et al. (1995) Nugent P., Phillips M., Baron E., Branch D., Hauschildt P., 1995, ApJ, 455, L147+
- Pakmor et al. (2010) Pakmor R., Kromer M., Röpke F. K., Sim S. A., Ruiter A. J., Hillebrandt W., 2010, Nature, 463, 61
- Pakmor et al. (2013) Pakmor R., Kromer M., Taubenberger S., Springel V., 2013, ApJ, 770, L8
- Papish & Perets (2016) Papish O., Perets H. B., 2016, ApJ, 822, 19
- Ruiter et al. (2011) Ruiter A. J., Belczynski K., Sim S. A., Hillebrandt W., Fryer C. L., Fink M., Kromer M., 2011, MNRAS, 417, 408
- Ruiter et al. (2013) Ruiter A. J., et al., 2013, MNRAS, 429, 1425
- Ruiz-Lapuente et al. (1993) Ruiz-Lapuente P., et al., 1993, Nature, 365, 728
- Schlegel et al. (1998) Schlegel D. J., Finkbeiner D. P., Davis M., 1998, ApJ, 500, 525
- Seitenzahl et al. (2013) Seitenzahl I. R., et al., 2013, MNRAS, 429, 1156
- Shen & Moore (2014) Shen K. J., Moore K., 2014, ApJ, 797, 46
- Shen et al. (2017) Shen K. J., Kasen D., Miles B. J., Townsley D. M., 2017, submitted (arXiv:1706.01898),
- Silverman et al. (2012) Silverman J. M., et al., 2012, MNRAS, 425, 1789
- Sim et al. (2010) Sim S. A., Röpke F. K., Hillebrandt W., Kromer M., Pakmor R., Fink M., Ruiter A. J., Seitenzahl I. R., 2010, ApJ, 714, L52
- Stritzinger et al. (2006) Stritzinger M., Mazzali P. A., Sollerman J., Benetti S., 2006, A&A, 460, 793
- Taubenberger et al. (2008) Taubenberger S., et al., 2008, MNRAS, 385, 75
- Telesco et al. (2015) Telesco C. M., et al., 2015, ApJ, 798, 93
- Whelan & Iben (1973) Whelan J., Iben I. J., 1973, ApJ, 186, 1007
- Wilk et al. (2017) Wilk K., Hillier D. J., Dessart L., 2017, MNRAS, stx2816
- van Kerkwijk et al. (2010) van Kerkwijk M. H., Chang P., Justham S., 2010, ApJ, 722, L157
Appendix A Synthetic light curves
Tables 2 and 3 give the integrated UV-optical-IR luminosity (), the -ray luminosity (), and the (true) bolometric luminosity (), as well as the absolute optical () and NIR () magnitudes of the model DDC25 (Table 2) and the sub- model SCH2p0 (Table 3), as a function of time since explosion and from uvoir maximum.
Also included is the conversion constant between the (absolute) -band magnitude and the uvoir magnitude, such that:
| (3) | |||||
| (4) |
where we have assumed that mag and , i.e. neglecting the Sun’s high-energy radiative output (X-rays and -rays). Knowing the peak -band magnitude, one can compute the peak absolute uvoir magnitude (equation 4), and hence the peak uvoir luminosity (using equation 3), which can then be used to infer the mass.
| (days) | (days) | (erg s-1) | (mag) | (erg s-1) | (erg s-1) | (mag) | (mag) | (mag) | (mag) | (mag) | (mag) | (mag) | (mag) |
|---|---|---|---|---|---|---|---|---|---|---|---|---|---|
| 1.30 | 19.74 | 2.79 (39) | 1.97 | 2.79 (39) | 3.00 | 5.15 | 7.94 | 9.91 | 10.29 | 11.74 | 11.88 | 12.31 | |
| 1.43 | 19.61 | 3.56 (39) | 1.82 | 3.56 (39) | 3.09 | 5.60 | 8.35 | 10.25 | 10.60 | 12.00 | 12.10 | 12.51 | |
| 1.57 | 19.47 | 4.69 (39) | 1.66 | 4.69 (39) | 3.33 | 6.16 | 8.81 | 10.65 | 10.95 | 12.29 | 12.35 | 12.74 | |
| 1.73 | 19.31 | 6.37 (39) | 1.47 | 6.37 (39) | 3.70 | 6.82 | 9.33 | 11.09 | 11.33 | 12.60 | 12.63 | 12.99 | |
| 1.90 | 19.14 | 8.86 (39) | 1.29 | 8.86 (39) | 4.27 | 7.57 | 9.87 | 11.57 | 11.73 | 12.92 | 12.94 | 13.26 | |
| 2.09 | 18.95 | 1.26 (40) | 1.06 | 1.26 (40) | 5.06 | 8.36 | 10.48 | 12.09 | 12.16 | 13.24 | 13.26 | 13.51 | |
| 2.30 | 18.74 | 1.82 (40) | 0.78 | 1.82 (40) | 5.83 | 9.10 | 11.16 | 12.61 | 12.62 | 13.55 | 13.58 | 13.77 | |
| 2.53 | 18.51 | 2.60 (40) | 0.54 | 2.60 (40) | 6.57 | 9.74 | 11.79 | 13.06 | 13.04 | 13.84 | 13.90 | 14.04 | |
| 2.78 | 18.26 | 3.64 (40) | 0.37 | 3.64 (40) | 7.40 | 10.34 | 12.32 | 13.46 | 13.43 | 14.12 | 14.21 | 14.31 | |
| 3.06 | 17.98 | 5.02 (40) | 0.24 | 5.02 (40) | 8.34 | 10.93 | 12.80 | 13.82 | 13.79 | 14.40 | 14.50 | 14.58 | |
| 3.37 | 17.67 | 6.87 (40) | 0.13 | 6.87 (40) | 9.27 | 11.51 | 13.25 | 14.15 | 14.12 | 14.67 | 14.78 | 14.86 | |
| 3.70 | 17.34 | 9.27 (40) | 0.05 | 9.27 (40) | 10.08 | 12.03 | 13.66 | 14.47 | 14.44 | 14.94 | 15.05 | 15.12 | |
| 4.07 | 16.97 | 1.23 (41) | 0.02 | 1.23 (41) | 10.75 | 12.50 | 14.03 | 14.77 | 14.73 | 15.20 | 15.31 | 15.37 | |
| 4.48 | 16.56 | 1.61 (41) | 0.07 | 1.61 (41) | 11.32 | 12.92 | 14.38 | 15.06 | 15.01 | 15.45 | 15.55 | 15.61 | |
| 4.93 | 16.11 | 2.07 (41) | 0.11 | 2.07 (41) | 11.80 | 13.28 | 14.69 | 15.32 | 15.27 | 15.69 | 15.78 | 15.84 | |
| 5.42 | 15.62 | 2.63 (41) | 0.15 | 2.63 (41) | 12.22 | 13.61 | 14.99 | 15.58 | 15.52 | 15.92 | 16.00 | 16.05 | |
| 5.96 | 15.08 | 3.29 (41) | 0.18 | 3.29 (41) | 12.58 | 13.91 | 15.27 | 15.81 | 15.75 | 16.13 | 16.21 | 16.25 | |
| 6.56 | 14.48 | 4.06 (41) | 0.21 | 4.06 (41) | 12.89 | 14.17 | 15.52 | 16.03 | 15.98 | 16.34 | 16.41 | 16.45 | |
| 7.22 | 13.82 | 4.95 (41) | 0.23 | 4.95 (41) | 13.15 | 14.41 | 15.76 | 16.24 | 16.20 | 16.54 | 16.60 | 16.63 | |
| 7.94 | 13.10 | 6.01 (41) | 0.24 | 6.01 (41) | 13.39 | 14.63 | 15.98 | 16.44 | 16.41 | 16.73 | 16.78 | 16.82 | |
| 8.73 | 12.31 | 7.29 (41) | 0.26 | 7.29 (41) | 13.62 | 14.85 | 16.21 | 16.65 | 16.63 | 16.93 | 16.96 | 17.00 | |
| 9.60 | 11.44 | 8.75 (41) | 0.28 | 8.75 (41) | 13.86 | 15.08 | 16.43 | 16.86 | 16.84 | 17.09 | 17.11 | 17.14 | |
| 10.56 | 10.48 | 1.07 (42) | 0.30 | 1.07 (42) | 14.12 | 15.33 | 16.66 | 17.08 | 17.07 | 17.29 | 17.29 | 17.30 | |
| 11.62 | 9.42 | 1.31 (42) | 0.31 | 1.31 (42) | 14.40 | 15.59 | 16.90 | 17.30 | 17.29 | 17.47 | 17.47 | 17.47 | |
| 12.78 | 8.26 | 1.58 (42) | 0.34 | 1.58 (42) | 14.68 | 15.85 | 17.12 | 17.51 | 17.49 | 17.63 | 17.62 | 17.59 | |
| 14.06 | 6.98 | 1.89 (42) | 0.35 | 1.25 (40) | 1.90 (42) | 14.96 | 16.09 | 17.34 | 17.71 | 17.69 | 17.80 | 17.79 | 17.73 |
| 15.47 | 5.57 | 2.18 (42) | 0.38 | 1.48 (40) | 2.19 (42) | 15.20 | 16.29 | 17.51 | 17.87 | 17.85 | 17.91 | 17.90 | 17.80 |
| 17.02 | 4.02 | 2.40 (42) | 0.39 | 1.88 (40) | 2.41 (42) | 15.27 | 16.38 | 17.63 | 17.99 | 17.99 | 17.98 | 17.97 | 17.82 |
| 18.72 | 2.32 | 2.54 (42) | 0.42 | 2.01 (40) | 2.56 (42) | 15.30 | 16.43 | 17.72 | 18.06 | 18.08 | 18.00 | 18.04 | 17.89 |
| 20.59 | 0.45 | 2.61 (42) | 0.42 | 3.06 (40) | 2.64 (42) | 15.29 | 16.44 | 17.76 | 18.09 | 18.15 | 17.98 | 18.08 | 17.90 |
| 22.65 | +1.61 | 2.59 (42) | 0.42 | 4.35 (40) | 2.63 (42) | 15.22 | 16.37 | 17.74 | 18.09 | 18.20 | 17.92 | 18.10 | 17.91 |
| 24.91 | +3.87 | 2.46 (42) | 0.40 | 6.42 (40) | 2.53 (42) | 15.10 | 16.25 | 17.67 | 18.04 | 18.22 | 17.78 | 18.10 | 17.91 |
| 27.40 | +6.36 | 2.24 (42) | 0.38 | 8.41 (40) | 2.33 (42) | 14.94 | 16.07 | 17.55 | 17.93 | 18.19 | 17.55 | 18.05 | 17.87 |
| 30.14 | +9.10 | 2.00 (42) | 0.30 | 1.16 (41) | 2.11 (42) | 14.77 | 15.84 | 17.34 | 17.77 | 18.13 | 17.42 | 18.01 | 17.86 |
| 33.15 | +12.11 | 1.74 (42) | 0.18 | 1.51 (41) | 1.90 (42) | 14.59 | 15.56 | 17.07 | 17.56 | 18.00 | 17.48 | 17.97 | 17.88 |
| 36.46 | +15.42 | 1.44 (42) | 0.09 | 1.92 (41) | 1.63 (42) | 14.42 | 15.30 | 16.78 | 17.30 | 17.79 | 17.43 | 17.80 | 17.73 |
| 40.11 | +19.07 | 1.18 (42) | 0.03 | 2.37 (41) | 1.42 (42) | 14.30 | 15.09 | 16.50 | 17.04 | 17.59 | 17.25 | 17.61 | 17.52 |
| 44.12 | +23.08 | 9.75 (41) | 0.03 | 2.83 (41) | 1.26 (42) | 14.31 | 14.93 | 16.29 | 16.82 | 17.41 | 16.89 | 17.38 | 17.17 |
| 48.53 | +27.49 | 8.14 (41) | 0.05 | 3.28 (41) | 1.14 (42) | 14.31 | 14.82 | 16.12 | 16.63 | 17.21 | 16.47 | 17.12 | 16.80 |
| 53.38 | +32.34 | 6.93 (41) | 0.09 | 3.73 (41) | 1.07 (42) | 14.31 | 14.76 | 15.99 | 16.45 | 17.01 | 16.10 | 16.88 | 16.51 |
| 58.72 | +37.68 | 5.92 (41) | 0.14 | 4.14 (41) | 1.01 (42) | 14.28 | 14.71 | 15.87 | 16.29 | 16.80 | 15.72 | 16.65 | 16.25 |
| 64.59 | +43.55 | 5.03 (41) | 0.19 | 4.47 (41) | 9.51 (41) | 14.22 | 14.65 | 15.74 | 16.13 | 16.60 | 15.35 | 16.42 | 16.00 |
| 71.05 | +50.01 | 4.24 (41) | 0.23 | 4.75 (41) | 8.99 (41) | 14.13 | 14.59 | 15.59 | 15.95 | 16.39 | 14.96 | 16.18 | 15.73 |
| 78.16 | +57.12 | 3.53 (41) | 0.27 | 4.91 (41) | 8.44 (41) | 14.02 | 14.51 | 15.43 | 15.76 | 16.17 | 14.57 | 15.90 | 15.45 |
| 86.00 | +64.96 | 2.89 (41) | 0.29 | 5.01 (41) | 7.90 (41) | 13.86 | 14.40 | 15.24 | 15.54 | 15.95 | 14.20 | 15.59 | 15.13 |
| 94.60 | +73.56 | 2.34 (41) | 0.30 | 4.98 (41) | 7.32 (41) | 13.66 | 14.28 | 15.02 | 15.31 | 15.72 | 13.87 | 15.24 | 14.77 |
| 104.10 | +83.06 | 1.87 (41) | 0.31 | 4.86 (41) | 6.72 (41) | 13.43 | 14.12 | 14.78 | 15.02 | 15.48 | 13.62 | 14.86 | 14.37 |
| 114.50 | +93.46 | 1.47 (41) | 0.29 | 4.68 (41) | 6.15 (41) | 13.16 | 13.94 | 14.51 | 14.72 | 15.23 | 13.44 | 14.47 | 13.96 |
| 126.00 | +104.96 | 1.14 (41) | 0.27 | 4.42 (41) | 5.56 (41) | 12.85 | 13.72 | 14.21 | 14.38 | 14.97 | 13.32 | 14.10 | 13.55 |
| 138.60 | +117.56 | 8.76 (40) | 0.23 | 4.09 (41) | 4.97 (41) | 12.50 | 13.46 | 13.88 | 14.02 | 14.71 | 13.22 | 13.79 | 13.15 |
| 152.50 | +131.46 | 6.65 (40) | 0.18 | 3.74 (41) | 4.40 (41) | 12.11 | 13.16 | 13.53 | 13.65 | 14.45 | 13.09 | 13.55 | 12.79 |
| 167.80 | +146.76 | 5.00 (40) | 0.11 | 3.36 (41) | 3.86 (41) | 11.69 | 12.83 | 13.15 | 13.30 | 14.19 | 12.93 | 13.35 | 12.46 |
| 184.60 | +163.56 | 3.71 (40) | 0.03 | 2.96 (41) | 3.33 (41) | 11.22 | 12.44 | 12.75 | 12.97 | 13.94 | 12.73 | 13.18 | 12.15 |
| 203.10 | +182.06 | 2.72 (40) | 0.06 | 2.57 (41) | 2.84 (41) | 10.73 | 12.03 | 12.32 | 12.65 | 13.68 | 12.50 | 13.02 | 11.83 |
| 223.40 | +202.36 | 1.97 (40) | 0.16 | 2.18 (41) | 2.38 (41) | 10.22 | 11.58 | 11.87 | 12.32 | 13.40 | 12.26 | 12.87 | 11.50 |
| (days) | (days) | (erg s-1) | (mag) | (erg s-1) | (erg s-1) | (mag) | (mag) | (mag) | (mag) | (mag) | (mag) | (mag) | (mag) |
|---|---|---|---|---|---|---|---|---|---|---|---|---|---|
| 0.91 | 15.03 | 3.67 (39) | 0.90 | 3.67 (39) | 2.95 | 6.70 | 9.30 | 10.71 | 10.75 | 11.90 | 11.93 | 12.21 | |
| 1.00 | 14.94 | 5.24 (39) | 0.63 | 5.24 (39) | 3.69 | 7.48 | 9.96 | 11.22 | 11.19 | 12.21 | 12.23 | 12.47 | |
| 1.10 | 14.84 | 7.44 (39) | 0.41 | 7.44 (39) | 4.43 | 8.15 | 10.56 | 11.68 | 11.62 | 12.49 | 12.55 | 12.72 | |
| 1.21 | 14.73 | 1.04 (40) | 0.25 | 1.04 (40) | 5.24 | 8.75 | 11.08 | 12.09 | 12.00 | 12.77 | 12.85 | 12.98 | |
| 1.33 | 14.61 | 1.43 (40) | 0.14 | 1.43 (40) | 6.24 | 9.34 | 11.54 | 12.45 | 12.35 | 13.05 | 13.14 | 13.24 | |
| 1.46 | 14.48 | 1.94 (40) | 0.04 | 1.94 (40) | 7.41 | 9.96 | 11.97 | 12.79 | 12.68 | 13.31 | 13.42 | 13.50 | |
| 1.61 | 14.33 | 2.65 (40) | 0.04 | 2.65 (40) | 8.58 | 10.61 | 12.39 | 13.12 | 13.01 | 13.59 | 13.70 | 13.78 | |
| 1.77 | 14.17 | 3.57 (40) | 0.09 | 3.57 (40) | 9.47 | 11.17 | 12.77 | 13.43 | 13.32 | 13.85 | 13.97 | 14.04 | |
| 1.95 | 13.99 | 4.78 (40) | 0.13 | 4.78 (40) | 10.20 | 11.68 | 13.12 | 13.74 | 13.61 | 14.12 | 14.23 | 14.30 | |
| 2.15 | 13.79 | 6.35 (40) | 0.17 | 6.35 (40) | 10.82 | 12.13 | 13.47 | 14.03 | 13.89 | 14.38 | 14.48 | 14.56 | |
| 2.37 | 13.57 | 8.36 (40) | 0.20 | 8.36 (40) | 11.37 | 12.56 | 13.80 | 14.31 | 14.17 | 14.64 | 14.73 | 14.81 | |
| 2.61 | 13.33 | 1.09 (41) | 0.24 | 1.09 (41) | 11.86 | 12.95 | 14.12 | 14.58 | 14.43 | 14.88 | 14.97 | 15.05 | |
| 2.87 | 13.07 | 1.41 (41) | 0.27 | 1.41 (41) | 12.32 | 13.32 | 14.43 | 14.83 | 14.68 | 15.11 | 15.20 | 15.28 | |
| 3.16 | 12.78 | 1.81 (41) | 0.29 | 1.81 (41) | 12.76 | 13.68 | 14.72 | 15.08 | 14.94 | 15.34 | 15.42 | 15.50 | |
| 3.48 | 12.46 | 2.30 (41) | 0.31 | 2.30 (41) | 13.19 | 14.02 | 15.01 | 15.32 | 15.19 | 15.56 | 15.64 | 15.72 | |
| 3.83 | 12.11 | 2.90 (41) | 0.33 | 2.90 (41) | 13.57 | 14.34 | 15.28 | 15.55 | 15.43 | 15.77 | 15.85 | 15.93 | |
| 4.21 | 11.73 | 3.63 (41) | 0.34 | 3.63 (41) | 13.93 | 14.64 | 15.53 | 15.77 | 15.66 | 15.98 | 16.06 | 16.13 | |
| 4.63 | 11.30 | 4.51 (41) | 0.35 | 4.51 (41) | 14.26 | 14.93 | 15.78 | 15.99 | 15.88 | 16.19 | 16.26 | 16.33 | |
| 5.09 | 10.85 | 5.57 (41) | 0.36 | 5.57 (41) | 14.56 | 15.21 | 16.01 | 16.20 | 16.10 | 16.39 | 16.45 | 16.52 | |
| 5.60 | 10.34 | 6.87 (41) | 0.36 | 6.87 (41) | 14.85 | 15.48 | 16.25 | 16.42 | 16.31 | 16.60 | 16.64 | 16.72 | |
| 6.16 | 9.78 | 8.43 (41) | 0.36 | 8.43 (41) | 15.13 | 15.74 | 16.47 | 16.63 | 16.53 | 16.80 | 16.83 | 16.90 | |
| 6.78 | 9.16 | 1.03 (42) | 0.36 | 1.03 (42) | 15.38 | 16.00 | 16.68 | 16.85 | 16.74 | 16.99 | 17.01 | 17.08 | |
| 7.46 | 8.48 | 1.25 (42) | 0.36 | 1.25 (42) | 15.63 | 16.24 | 16.89 | 17.05 | 16.94 | 17.18 | 17.19 | 17.25 | |
| 8.21 | 7.72 | 1.50 (42) | 0.35 | 1.50 (42) | 15.85 | 16.47 | 17.09 | 17.25 | 17.14 | 17.36 | 17.35 | 17.40 | |
| 9.03 | 6.91 | 1.79 (42) | 0.35 | 7.88 (39) | 1.80 (42) | 16.07 | 16.70 | 17.28 | 17.44 | 17.33 | 17.52 | 17.50 | 17.54 |
| 9.93 | 6.01 | 2.10 (42) | 0.35 | 2.87 (39) | 2.11 (42) | 16.26 | 16.90 | 17.45 | 17.62 | 17.51 | 17.67 | 17.63 | 17.66 |
| 10.92 | 5.02 | 2.41 (42) | 0.35 | 1.44 (40) | 2.43 (42) | 16.41 | 17.06 | 17.60 | 17.78 | 17.67 | 17.80 | 17.74 | 17.74 |
| 12.01 | 3.93 | 2.70 (42) | 0.37 | 5.49 (39) | 2.71 (42) | 16.52 | 17.18 | 17.74 | 17.91 | 17.82 | 17.89 | 17.83 | 17.80 |
| 13.21 | 2.72 | 2.95 (42) | 0.38 | 4.79 (40) | 3.00 (42) | 16.59 | 17.25 | 17.85 | 18.03 | 17.95 | 17.96 | 17.90 | 17.84 |
| 14.53 | 1.41 | 3.11 (42) | 0.41 | 6.04 (40) | 3.17 (42) | 16.60 | 17.27 | 17.93 | 18.11 | 18.07 | 17.98 | 17.95 | 17.86 |
| 15.98 | +0.04 | 3.17 (42) | 0.43 | 8.61 (40) | 3.25 (42) | 16.54 | 17.22 | 17.98 | 18.16 | 18.16 | 17.96 | 17.99 | 17.87 |
| 17.58 | +1.64 | 3.10 (42) | 0.46 | 1.18 (41) | 3.22 (42) | 16.43 | 17.11 | 17.98 | 18.18 | 18.22 | 17.87 | 18.03 | 17.88 |
| 19.34 | +3.40 | 2.92 (42) | 0.47 | 1.57 (41) | 3.08 (42) | 16.39 | 16.90 | 17.93 | 18.14 | 18.23 | 17.71 | 18.06 | 17.90 |
| 21.27 | +5.33 | 2.63 (42) | 0.46 | 2.02 (41) | 2.83 (42) | 16.16 | 16.64 | 17.80 | 18.04 | 18.20 | 17.52 | 18.10 | 17.93 |
| 23.40 | +7.46 | 2.32 (42) | 0.40 | 2.55 (41) | 2.58 (42) | 15.86 | 16.34 | 17.61 | 17.89 | 18.16 | 17.42 | 18.12 | 17.96 |
| 25.74 | +9.80 | 2.02 (42) | 0.29 | 3.15 (41) | 2.34 (42) | 15.59 | 16.03 | 17.35 | 17.71 | 18.10 | 17.34 | 18.09 | 17.94 |
| 28.31 | +12.37 | 1.73 (42) | 0.19 | 3.78 (41) | 2.10 (42) | 15.36 | 15.74 | 17.07 | 17.48 | 17.97 | 17.27 | 17.96 | 17.82 |
| 31.14 | +15.21 | 1.42 (42) | 0.11 | 4.43 (41) | 1.86 (42) | 15.18 | 15.50 | 16.79 | 17.22 | 17.79 | 17.15 | 17.72 | 17.57 |
| 34.26 | +18.32 | 1.11 (42) | 0.11 | 5.01 (41) | 1.61 (42) | 15.02 | 15.28 | 16.51 | 16.91 | 17.55 | 16.79 | 17.37 | 17.17 |
| 37.68 | +21.74 | 8.74 (41) | 0.13 | 5.59 (41) | 1.43 (42) | 14.90 | 15.11 | 16.27 | 16.63 | 17.30 | 16.38 | 17.02 | 16.78 |
| 41.45 | +25.52 | 7.05 (41) | 0.16 | 6.10 (41) | 1.32 (42) | 14.79 | 14.96 | 16.07 | 16.40 | 17.06 | 15.96 | 16.72 | 16.44 |
| 45.60 | +29.66 | 5.77 (41) | 0.19 | 6.51 (41) | 1.23 (42) | 14.69 | 14.83 | 15.88 | 16.18 | 16.81 | 15.52 | 16.43 | 16.13 |
| 50.16 | +34.22 | 4.73 (41) | 0.23 | 6.83 (41) | 1.16 (42) | 14.59 | 14.71 | 15.71 | 15.97 | 16.54 | 15.08 | 16.16 | 15.83 |
| 55.18 | +39.24 | 3.89 (41) | 0.26 | 7.06 (41) | 1.10 (42) | 14.46 | 14.60 | 15.53 | 15.76 | 16.28 | 14.63 | 15.88 | 15.51 |
| 60.70 | +44.77 | 3.20 (41) | 0.29 | 7.16 (41) | 1.04 (42) | 14.32 | 14.48 | 15.35 | 15.54 | 16.01 | 14.17 | 15.57 | 15.18 |
| 66.77 | +50.83 | 2.61 (41) | 0.32 | 7.17 (41) | 9.78 (41) | 14.15 | 14.35 | 15.15 | 15.31 | 15.74 | 13.71 | 15.24 | 14.83 |
| 73.45 | +57.52 | 2.12 (41) | 0.33 | 7.08 (41) | 9.20 (41) | 13.96 | 14.22 | 14.93 | 15.04 | 15.48 | 13.25 | 14.87 | 14.44 |
| 80.80 | +64.86 | 1.71 (41) | 0.33 | 6.89 (41) | 8.59 (41) | 13.74 | 14.07 | 14.70 | 14.76 | 15.21 | 12.79 | 14.47 | 14.04 |
| 88.88 | +72.94 | 1.37 (41) | 0.31 | 6.63 (41) | 8.00 (41) | 13.48 | 13.91 | 14.45 | 14.47 | 14.96 | 12.33 | 14.05 | 13.64 |
| 97.77 | +81.83 | 1.09 (41) | 0.28 | 6.31 (41) | 7.40 (41) | 13.20 | 13.74 | 14.17 | 14.16 | 14.71 | 11.88 | 13.64 | 13.24 |
| 107.55 | +91.61 | 8.68 (40) | 0.22 | 5.93 (41) | 6.80 (41) | 12.88 | 13.53 | 13.86 | 13.86 | 14.47 | 11.47 | 13.27 | 12.86 |
| 118.31 | +102.38 | 6.86 (40) | 0.15 | 5.51 (41) | 6.20 (41) | 12.54 | 13.29 | 13.53 | 13.56 | 14.23 | 11.13 | 12.94 | 12.50 |
| 130.14 | +114.20 | 5.40 (40) | 0.07 | 5.05 (41) | 5.59 (41) | 12.17 | 13.02 | 13.19 | 13.27 | 13.99 | 10.86 | 12.65 | 12.19 |
| 143.15 | +127.22 | 4.21 (40) | 0.02 | 4.57 (41) | 4.99 (41) | 11.78 | 12.71 | 12.84 | 12.99 | 13.75 | 10.65 | 12.40 | 11.88 |
| 157.47 | +141.53 | 3.28 (40) | 0.10 | 4.08 (41) | 4.41 (41) | 11.38 | 12.37 | 12.48 | 12.72 | 13.51 | 10.45 | 12.15 | 11.59 |
| 173.22 | +157.28 | 2.55 (40) | 0.20 | 3.60 (41) | 3.85 (41) | 10.98 | 12.01 | 12.11 | 12.45 | 13.26 | 10.29 | 11.93 | 11.30 |
| 190.54 | +174.60 | 1.97 (40) | 0.29 | 3.13 (41) | 3.32 (41) | 10.59 | 11.64 | 11.74 | 12.17 | 13.01 | 10.12 | 11.69 | 10.99 |
| 209.59 | +193.66 | 1.50 (40) | 0.39 | 2.67 (41) | 2.82 (41) | 10.20 | 11.23 | 11.35 | 11.89 | 12.74 | 9.97 | 11.44 | 10.66 |
| 230.00 | +214.06 | 1.14 (40) | 0.49 | 2.25 (41) | 2.36 (41) | 9.82 | 10.82 | 10.95 | 11.59 | 12.47 | 9.82 | 11.20 | 10.31 |
Appendix B Contribution of individual ions to the total optical and near-infrared flux
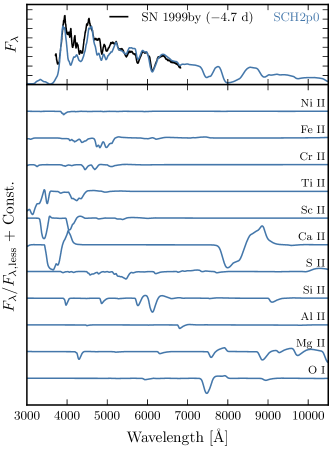
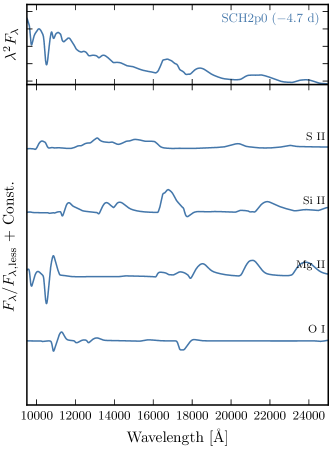
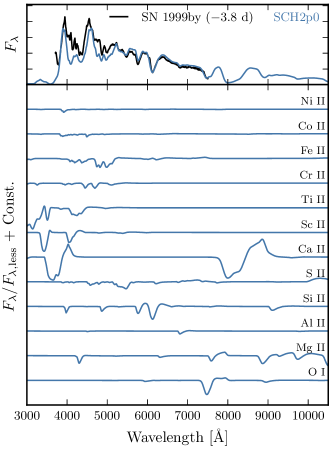
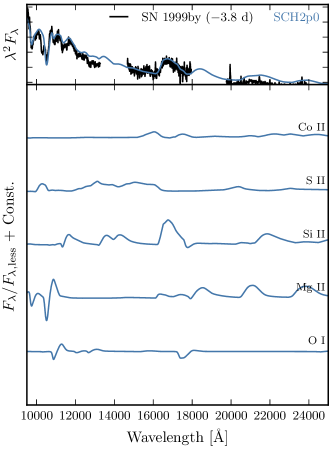
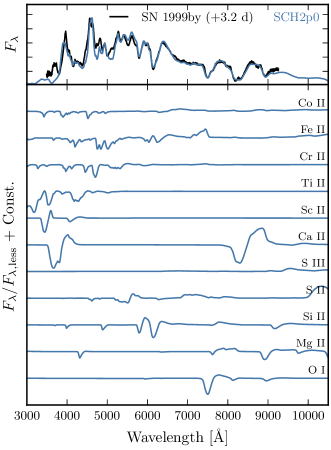
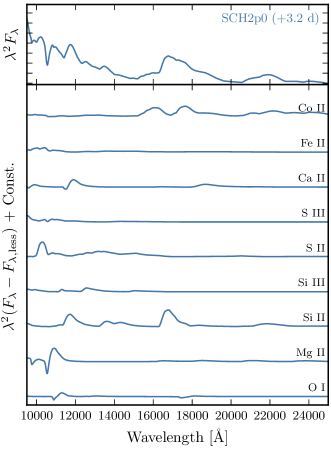
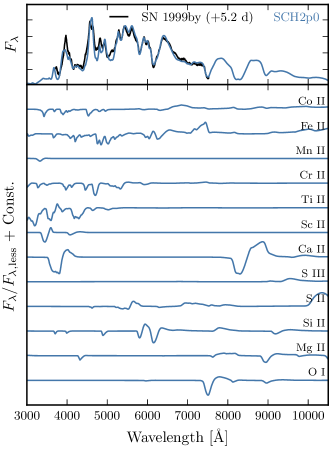
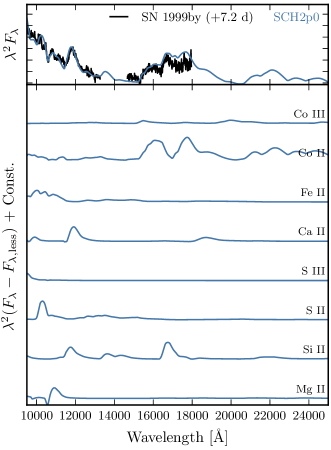
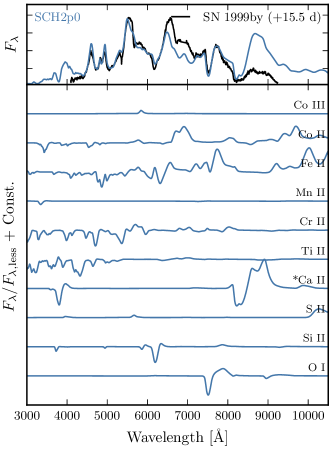
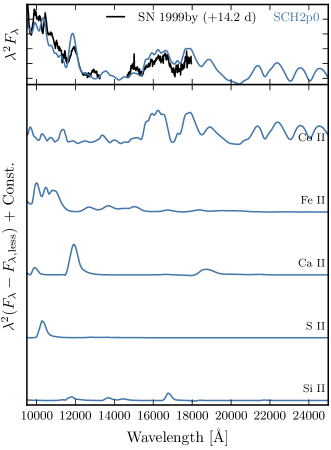
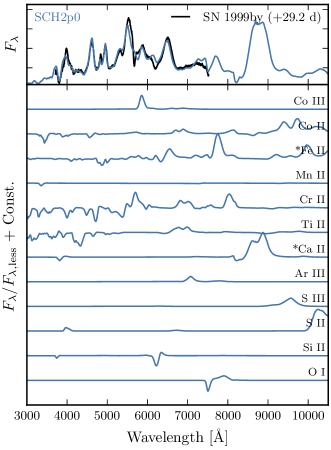
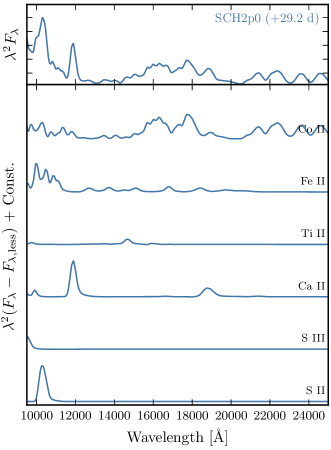
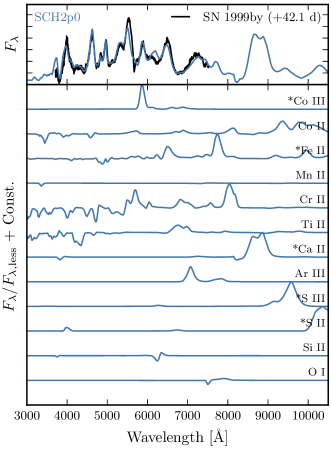
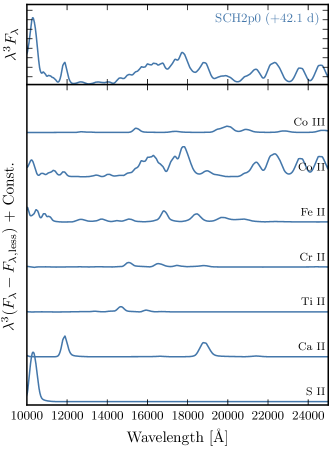
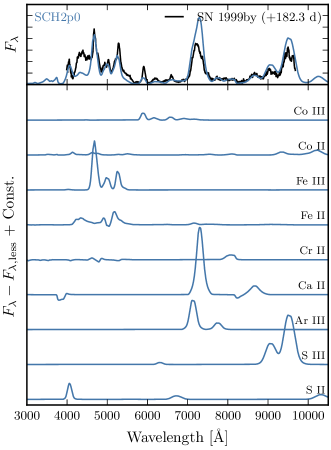
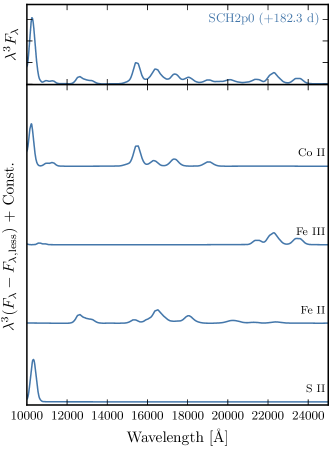
Figures 11–15 reveal the contribution of individual ions to the full optical and NIR synthetic spectra of the sub- model SCH2p0, compared to the low-luminosity SN 1999by between d and d from -band maximum. The observed spectra have been de-redshifted, de-reddened, and scaled to match the absolute -band (for the optical spectra) or -band (for the NIR spectra) magnitude inferred from the corresponding photometry. An additional scaling has been applied to the optical synthetic spectra to reproduce the mean observed flux in the range 5000–6500 Å (Figs. 11–14 and upper panels of Fig. 15) or in the range 3000–10000 Å (bottom panels of Fig. 15 showing the spectra at +182.3 d). For the NIR spectra, we use the wavelength range 10000–11500 Å to compute the additional scale factor, and further scale the flux by (Figs. 11–14) or (Figs. 15) for better visibility.
The ion spectra in the optical range up until +42.1 d and in the NIR range up until +0.2 d are computed by taking the ratio of the full spectrum () to that excluding all bound-bound transitions of the corresponding ion (). Ion spectra computed as a ratio marked with a “*” have been scaled down for clarity. Only ions that impact the flux at the per cent level at a given phase are shown.
For the nebular optical spectrum at +182.3 d and for the NIR spectra from +3.2 d onwards, the ratio artificially enhances the strength of weak emission lines, and we instead compute the ion spectra by taking the difference . This approach preserves the relative contribution of different ions to the total flux, but the global scaling we adopt occasionally causes individual ion spectra to overlap (see e.g. the optical nebular spectrum at +182.3 d in Fig. 15). Only ions that impact the flux at the per cent level at a given phase are shown.
We caution the reader that these plots are merely illustrative. The complex nature of the opacity in SNe Ia, characterized by weak continuum opacities and numerous overlapping spectral lines, renders problematic the quantitative evaluation of the contribution of individual ions to the total flux at a given frequency.