Features of Microwave Radiation and Magnetographic Characteristics of Solar Active Region NOAA 12242 Before the X1.8 Flare on December 20, 2014
Russian Academy of Sciences, St. Petersburg, Russia
2Special Astrophysical Observatory,
Russian Academy of Sciences, Nizhnii Arkhyz, Russia
3St. Petersburg State University,
St. Petersburg, Russia
—————–
E-mail:beam@gaoran.ru
—————–
Published in:
Geomagnetism and Aeronomy, 2017, Vol. 57, No. 8, p.978
DOI: 10.1134/S0016793217080023)
Abstract
This paper continues the cycle of authors works on the detection of precursors of large flares (M5 and higher classes) in active regions (ARs) of the Sun by their microwave radiation and magnetographic characteristics. Generalization of the detected precursors of strong flares can be used to develop methods for their prediction. This paper presents an analysis of the development of NOAA AR 12242, in which an X1.8 flare occurred on December 20, 2014. The analysis is based on regular multiazimuth and multiwavelength observations with the RATAN-600 radio telescope in the range 1.65-10 cm with intensity and circular polarization analysis and data from the Solar Dynamics Observatory (SDO). It was found that a new component appeared in the AR microwave radiation two days before the X-flare. It became dominant in the AR the day before the flare and significantly decreased after the flare. The use of multiazimuth observations from RATAN-600 and observations at 1.76 cm from the Nobeyama Radioheliograph made it possible to identify the radio source that appeared before the X-flare with the site of the closest convergence of opposite polarity fields near the neutral line in the AR. It was established that the X-flare occurred 20 h after the total gradient of the magnetic field of the entire region calculated from SDO/HMI data reached its maximum value. Analysis of the evolution of the microwave source that appeared before the X-flare in AR 12242 and comparison of its parameters with the parameters of other components of the AR microwave radiation showed that the new source can be classified as neutral line associated source (NLS), which were repeatedly detected by the RATAN-600 and other radio telescopes 1-3 days before the large flares.
1 INTRODUCTION
The method for predicting large flares (the most energetic manifestations of solar activity that affect the near-Earth space and terrestrial atmosphere (Benz, 2017)) can be based on facts found in different solar radiation ranges that indicate the accumulation of energy and the preparation of the active region (AR) for a large flare (mainly, by the magnetic field configuration and its variation), as well as by such features as the spatiotemporal distribution of weak flares (”precursor flares”) that accompany a large flare (Gyenge et al., 2016).
In recent decades, studies have shown that flares mostly occur in ARs with a complex magnetic structure, predominantly with a -configuration with a wavy neutral line and high field gradients. The researchers have come to such conclusions by analyzing the data of the GOES, RHESSI, SOHO/MDI, SDO (AIA and HMI), and other space observatories. Several reviews of active solar events with large flares of M5 and higher classes (based on X-ray classification) based on the databases of space observatories have recently been published. In these papers, the analysis of individual active events is generalized, and a large number of events with large flares are statistically analyzed in order to identify the characteristic features in AR development, i.e., precursors of large flares and CMEs (Schwijer et al., 2016; Harra et al., 2016; Turiumi et al., 2017). It has been established that, in the vast majority of cases, large flares can be predicted by the emergence of a new magnetic flux, the presence of a strongfield, high-gradient polarity inversion line (SHIL), motions of magnetic fluxes, shear generation, sunspot rotation, and the occurrence of electric currents in the AR.
Important information about the accumulation of energy and an upcoming large flare in the AR can be provided by microwave observations of the Sun. The first evidence of the relationship between the features of the AR microwave radiation structure and its flare activity were obtained in the 1970s. Thus, during observations of the solar eclipse on March 7, 1970, a group of Pulkovo radio astronomers found an intense, compact, and weakly polarized radio source at 4.5 cm in the flare-active group over the region between sunspots (Quinones et al., 1975). In 1974, observations with the Westerbork Synthesis Radio Telescope (WSRT) at a wavelength of 6 cm revealed a quasi-stationary bright source that was projected on the region near the neutral line of the photospheric magnetic field (neutral line associated source, NLS) (Kundu et al., 1977). Subsequent observations of the three ARs with the WSRT in May 1980 confirmed that there were intense sources (NLSs) associated with X-ray loops over the neutral line and that one of them had intensified several hours before a large flare (Kundu and Alissandrakis, 1984).
From then on, radio observations of the Sun by large instruments (the RATAN-600, Nobeyama Radioheliograph (NoRH), and Siberian solar radio telescope (SSRT)), as well as radio observations of solar eclipses, showed that the characteristic feature of ARs with high flare activity is the presence of microwave NLSs. Regular observations of the Sun with the RATAN-600, which started in 1975 in a wide microwave range, made it possible to find that microwave sources appeared and developed quickly before large flares in ARs. These sources were identified by the sites of the maximum gradient of the photospheric magnetic field near the neutral line, which often became the dominant component in the AR microwave radiation. The characteristics of these radio sources (the steep slope of the flux density spectrum of in the range 2-4 cm, low polarization degree (not more than 30%), small angular sizes, and high brightness temperature) distinguished these sources from other well-studied AR microwave radiation components associated with sunspots, flocculi, and coronal condensations. That is why these sources are called peculiar sources (see, for example, (Akhmedov et al., 1986, 1989; Borovik et al., 1989a, b)). Korzhavin et al. (1989) suggested that peculiar sources are connected with strong currents (current sheets) in the atmosphere of flare ARs.
Joint observations of a number of ARs with the WSRT and RATAN-600 at wavelengths of 2-6 cm in May 1980 showed that NLSs observed with the WSRT and peculiar sources observed with the RATAN-600 are the same objects (Alissandrakis et al., 1993). Subsequently, compact intense microwave sources identified with the NL of the photospheric magnetic field or regions near the NL were called NLSs. Such sources are recognized as typical (often, dominant) components of the microwave radiation (of mainly flare) ARs with a complex magnetic structure (Shibasaki et al., 2011). The nature of NLSs has been investigated (Yasnov, 2014).
Observations of the Sun with the NoRH at a wavelength of 1.76 cm and with the SSRT at 5.2 cm revealed bright quasistationary sources above the neutral line in ARs in which there were large flares and large CMEs, in particular, those that caused the GLE (Uralov et al., 2000; 2006; 2008). The studied NLSs at a wavelength of 1.76 cm were identified by their location on or near the neutral line of the vertical component of the coronal magnetic field at the point where the horizontal component has an absolute or local maximum. It was found that NLSs are connected with the AR energy release sites, and it was concluded that the microwave radiation of large flares starts under the coronal current sheet in magnetic loops, the bases of which are in the area of motions of strong photospheric fields.
Studies of microwave characteristics of a number of ARs with high flare activity continued with the RATAN-600 in 2011-2015, and the analysis of the AR characteristics by SDO data (Abramov-Maximov et al., 2015a, b) showed that, in the studied ARs, a new (in most cases, dominant) microwave source (NLS) was detected 1-2 days before X class flares (according to the GOES classification) in the AR microwave radiation, which was associated with the site of the maximum gradient of the photospheric magnetic field near the neutral line. The evolution of this source was similar to the magnetic field gradient evolution. Analysis of the magnetic measurements of the same ARs by the SDO data showed that X-class flares occurred at sufficiently high magnetic flux levels in sunspot groups (F 1022 Mx) and at a sharp increase in the magnetic field gradient, which reflected the geometric approach of opposite polarity sunspots.
This paper continues the cycle of authors works on the detection of the precursors of large flares (M5 and higher classes) in ARs of the Sun by their microwave radiation and magnetographic characteristics. Generalization of the detected precursors of strong flares can be used to develop methods for their prediction. Analysis of the development of AR NOAA 12242, in which an X1.8 flare occurred on December 20, 2014, is presented. The analysis is based on regular observations of the Sun in the microwave range with the RATAN-600 radio telescope. Magnetographic characteristics of ARs were studied based on SDO/HMI data.
2 RATAN-600 OBSERVATIONS OF THE SUN
In this paper, we used the results of daily multiazimuth spectral-polarization multiwavelength observations of the Sun carried out with the RATAN-600 radio telescope in the selected wavelength range of (1.8-4.0) cm. Observations were conducted with a multioctave high-resolution spectral-polarization complex (Bogod et al., 2011).
The knife-edge beam at a wavelength of 2.0 cm (HPBW) is . In December 2014, observations of the Sun on RATAN-600 were carried out in multiazimuth mode, i.e., 31 observations were conducted daily in different azimuths in the time interval of 06:50-11:30 UT, while the Sun scanning angle by the antenna beam varied within 14.5 deg. (Bogod et al., 2004). This observation method made it possible both to investigate the dynamics of the development of individual microwave radiation components of AR 12242 for more than 4 h and to carry out their two-dimensional identification with parts of the AR.
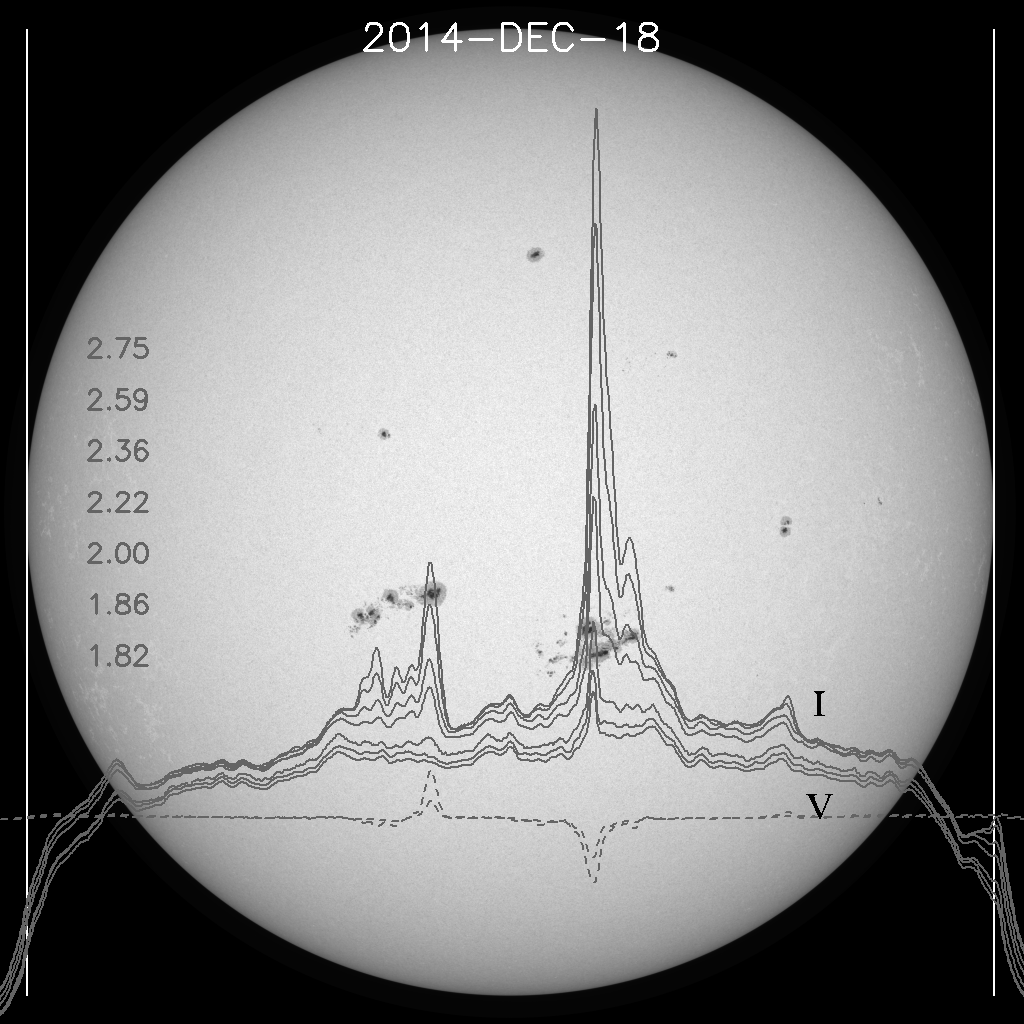
An example of the results of observations of the Sun with the RATAN-600 on December 18, 2014, in one of the 31 azimuths is given in Fig. 1. The considered AR 12242 is in the right part of the disk, and AR 12241 is in the left part. In Fig. 1, solid lines indicate 7 one-dimensional scans in the intensity channel (Stokes parameter I) in the order of increasing wavelengths given on the left (in cm). The dashed lines show scans in the polarization channel (Stokes parameter V) in two wavelengths (2.0 and 2.2 cm). The scans are superimposed on the image of the Sun (SDO). AR 12241 was used to control the referencing of scans to the image of the Sun.
The parameters of individual components of the radio emission of the considered AR 12242 were estimated by the Gauss analysis by the method of processing of solar scans obtained with the RATAN- 600 (Akhmedov et al., 1987) using the WorkScan software (Garaimov, 1997). The radio source fluxes identified on one-dimensional solar scans were calibrated with the use of the results of observations of standard objects (the Moon and the Crab Nebula) with the RATAN-600 and also with an accounting of the data of the world solar patrol.
3 RESULTS OF OBSERVATION OF AR 12242 WITH THE RATAN-600
AR 12242 was first detected on the disk on December 14, 2014, as a group of sunspots with an area of 100 msh (millionths of the solar hemisphere) (according The Preliminary Report and Forecast of Solar Geophysical Data, ftp://ftp.ngdc.noaa.gov/STP/swpc_products/weekly_reports/PRFs_of_SGD). As the group moved by the disk, it developed; its area increased and reached a maximum value of 1080 msh on December 19. From December 15 to 17, a number of C-class flares and two M-class flares were detected in it (one of them was a large M8.7 flare on December 17 (peak at 04:42 UT)). Unfortunately, it is impossible to identify the precursors of this flare because of the AR closeness to the eastern limb in the period until December 17. Therefore, in this paper, the task is to investigate the evolution of the AR 12242 microwave radiation and its magnetographic characteristics before the large X1.8 flare (beginning at 00:11 UT, peak at 00:28 UT, and end at 00:55 UT) for December 17-20.
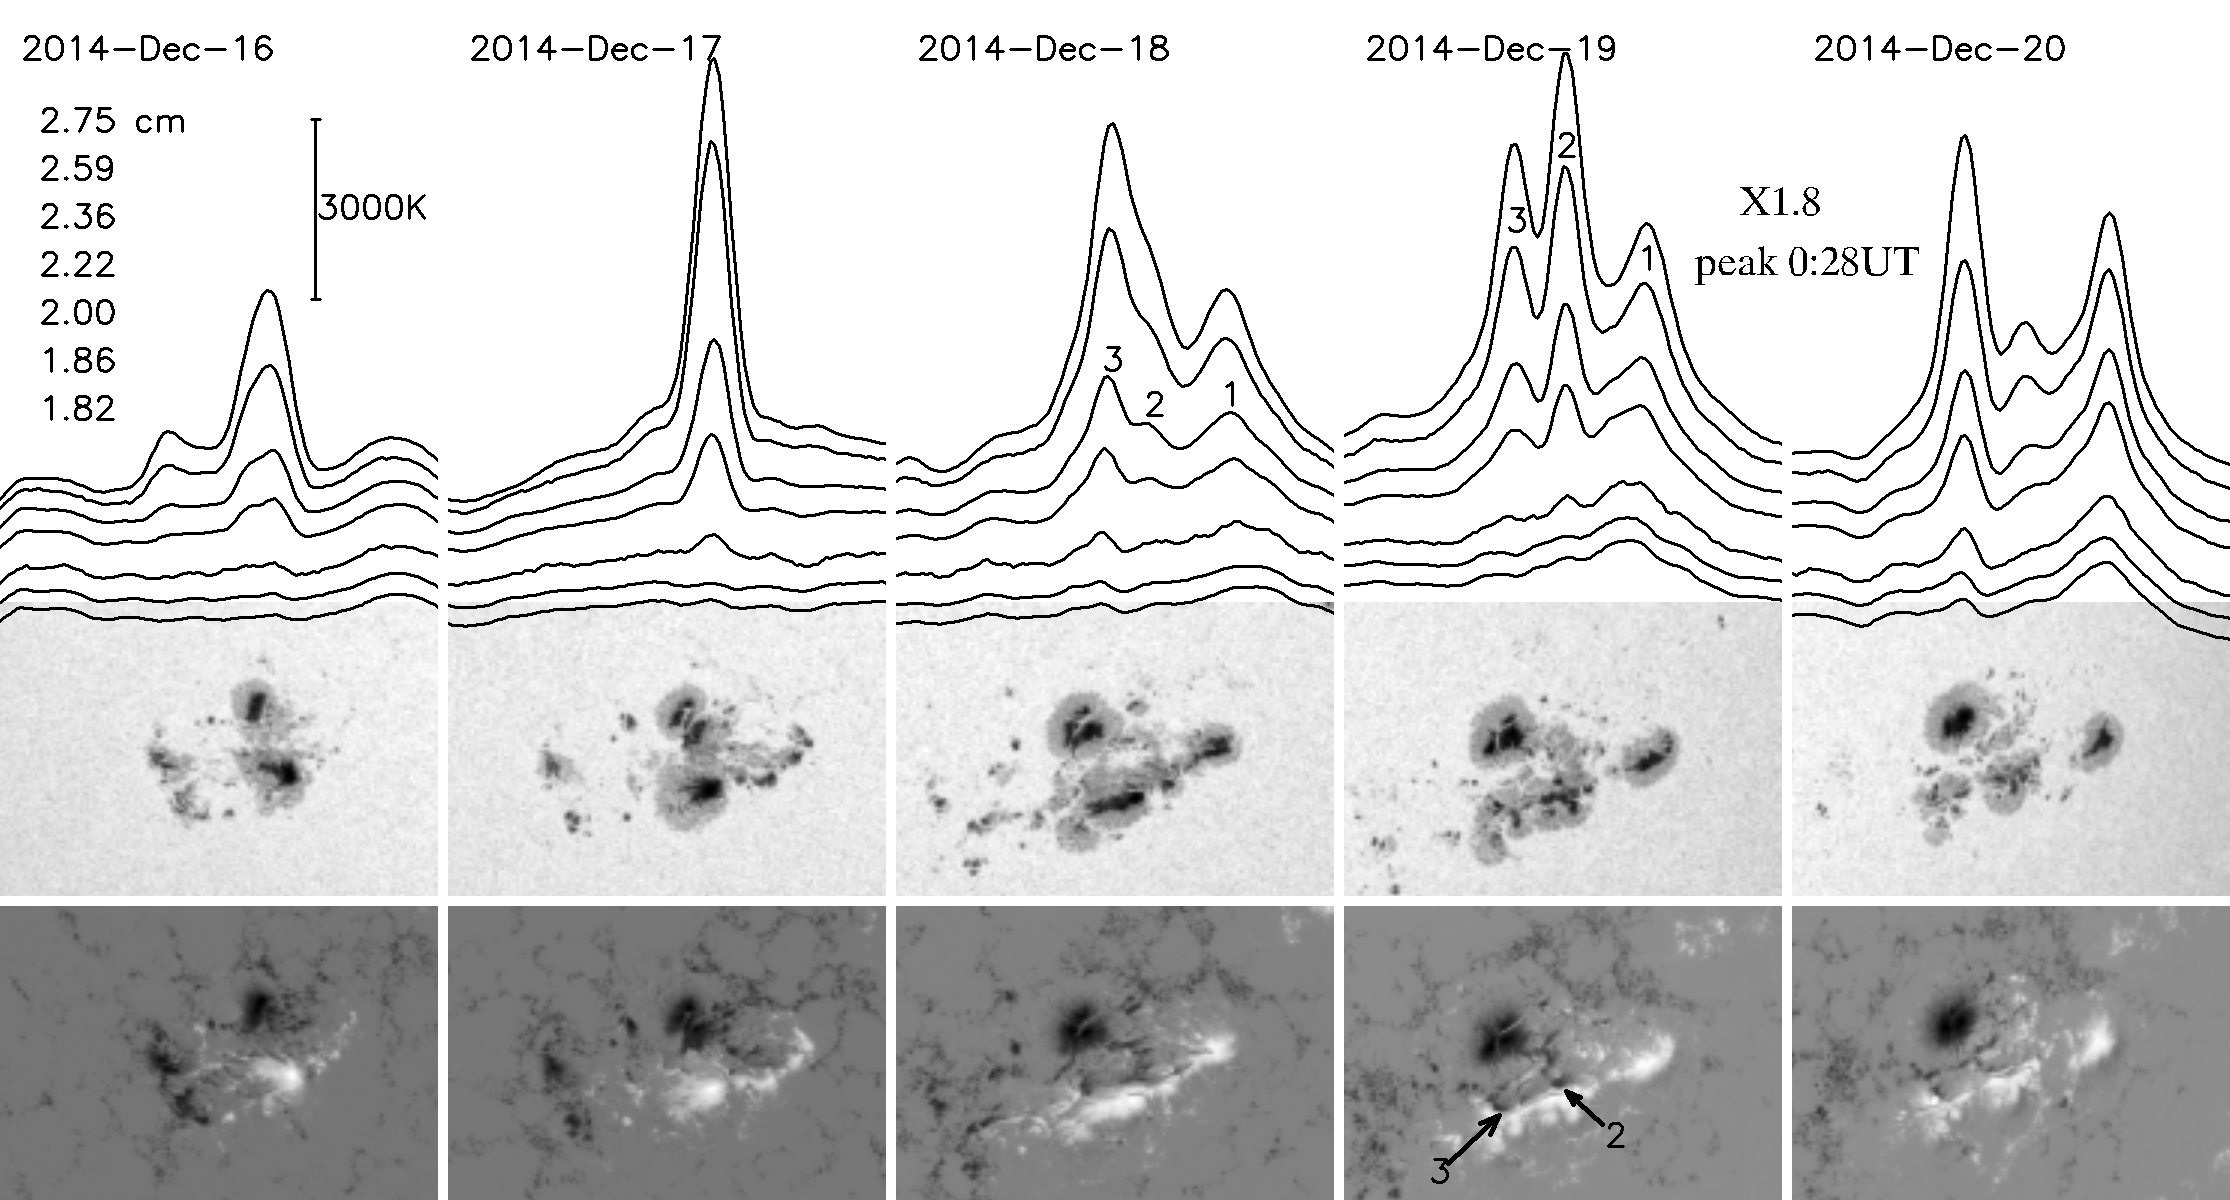
Figure 2 shows fragments of solar scans (RATAN-600) at several wavelengths identified with the AR 12242 image in white light and magnetograms (SDO/HMI) for December 16220, 2014. It can be seen that, two days before the X-flare, new components appeared in the AR microwave radiation structure, one of which (designated as 2) became the dominant component a day before the flare. After the flare, it noticeably decreased.
The identification of AR microwave radiation components based on observations with the RATAN-600 in different azimuths with different position angles of the Sun showed that source 2 is uniquely identified with the region near the neutral line, where the negative polarity field came close to the previously existing positive polarity field (in Fig. 2 and Fig. 4b, it is marked by arrow 2). Source 3 is identified by multiazimuth observations with a region covering the southern part of the large negative polarity sunspot in the tail part of the group and the region near the neutral line, where the negative polarity field also came close to the positive polarity field (indicated in Fig. 2 and Fig. 4b by arrow 3).
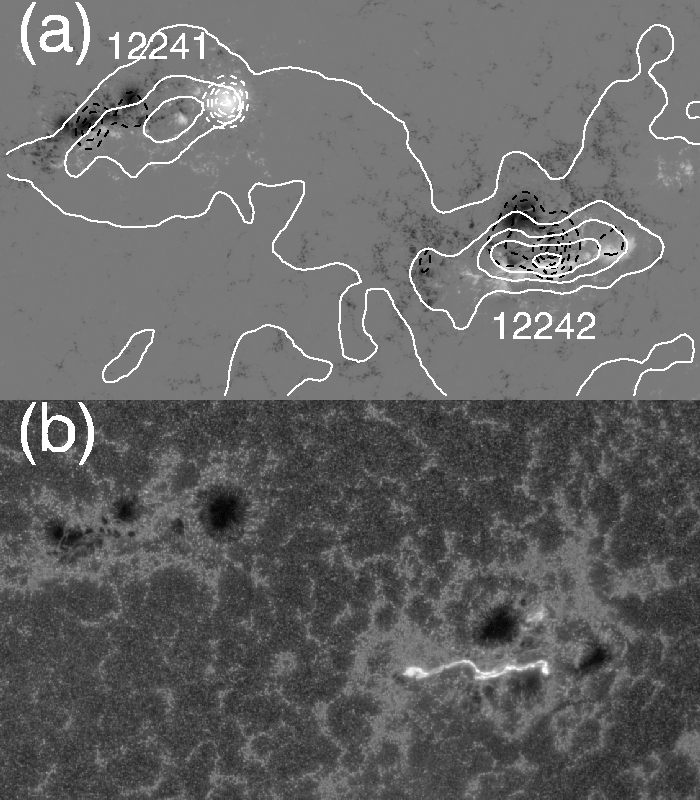
Solar radio images at a wavelength of 1.76 cm obtained with the Nobeyama Radioheliograph were used for more reliable identification of microwave sources with a magnetogram. In Fig. 3a, radio images of NOAA ARs 12241 and 12242 at 1.76 cm on December 19 are superimposed on the magnetogram (SDO/HMI). The white solid isolines show the intensity (Stokes parameter I), and the dashed lines indicate circular polarization (Stokes parameter V): the white lines refer to positive polarization, and black refer to negative polarization. The leading (head) sunspot of AR 12241 was used to control the coordinate referencing of the radio image and the magnetogram.
Figure 3a shows that the radiation maximum at 1.76 cm coincides with region 2 in Fig. 2 near the neutral line, i.e., with the site of maximum convergence of the magnetic fields with the opposite polarity sign. Region 3 near the neutral line to the south of the tail sunspot (see Fig. 2), where opposite polarity fields also converged, is also located in the high radiation intensity region at a wavelength of 1.76 cm.
Thus, the identification of intense microwave sources detected on the RATAN-600 (one day before the flare) with the sites of convergence of opposite polarity fields near the neutral line agrees with the results of observations on the NoRH at 1.76 cm.
It is important to note that the X1.8 flare (beginning at 00:11 UT and peak at 00:28 UT) began to develop on December 20 exactly in this region of the neutral line of the photospheric magnetic field, where the fields of opposite signs converge. This can be seen in Fig. 3b, where the image of the AR 12242 in the line 1600 (SDO) is given at 00:17:29 UT on December 20.
4 MAGNETOGRAPHIC INVESTIGATIONS OF AR 12242
This paper presents the results of the analysis of the structure and magnetic characteristics of sunspots in AR 12242 for December 17 21, 2014, according to SDO data. The SDO/HMI data was analyzed with an accumulation time of 45 s at 00:00, 05:00, 10:00, 15:00, and 20:00 UT. Automatic identifying of sunspots and measurement of the magnetic flux in them by SDO/HMI observations in the continuum and in magnetographic observations was used (Tlatov et al., 2014).
The method for calculating the index of solar flares used in this paper can be described in the following steps. At the first step, the boundaries of ARs with different polarities were determined. For this purpose, structures with a magnetic field above the threshold values (500 G) were selected on the HMI/SDO magnetograms. The effective distance between the boundaries of the regions was then determined.
In order to simplify computational algorithms, only distance data in the horizontal and vertical directions were taken into account. At the first step of the algorithm, vertical scanning was carried out. Thus, when scanning the current column, the positive region boundary (point ) was found. Next, the total positive polarity magnetic flux was determined. The pixels were scanned from point by the column until the first boundary point of the negative region (point ) was detected. After point was found, it was taken into account that this point belonged to the negative region, and the flux of this region was . If no such point was detected, then the given point was no longer considered.
Next, the distance between the points and was determined, where and are the latitude and longitude of the points and . If the distance was greater than the threshold value , then this pair was not considered further. The current gradient was then calculated. The index was summed to determine the total index of bipole moments (flare index).
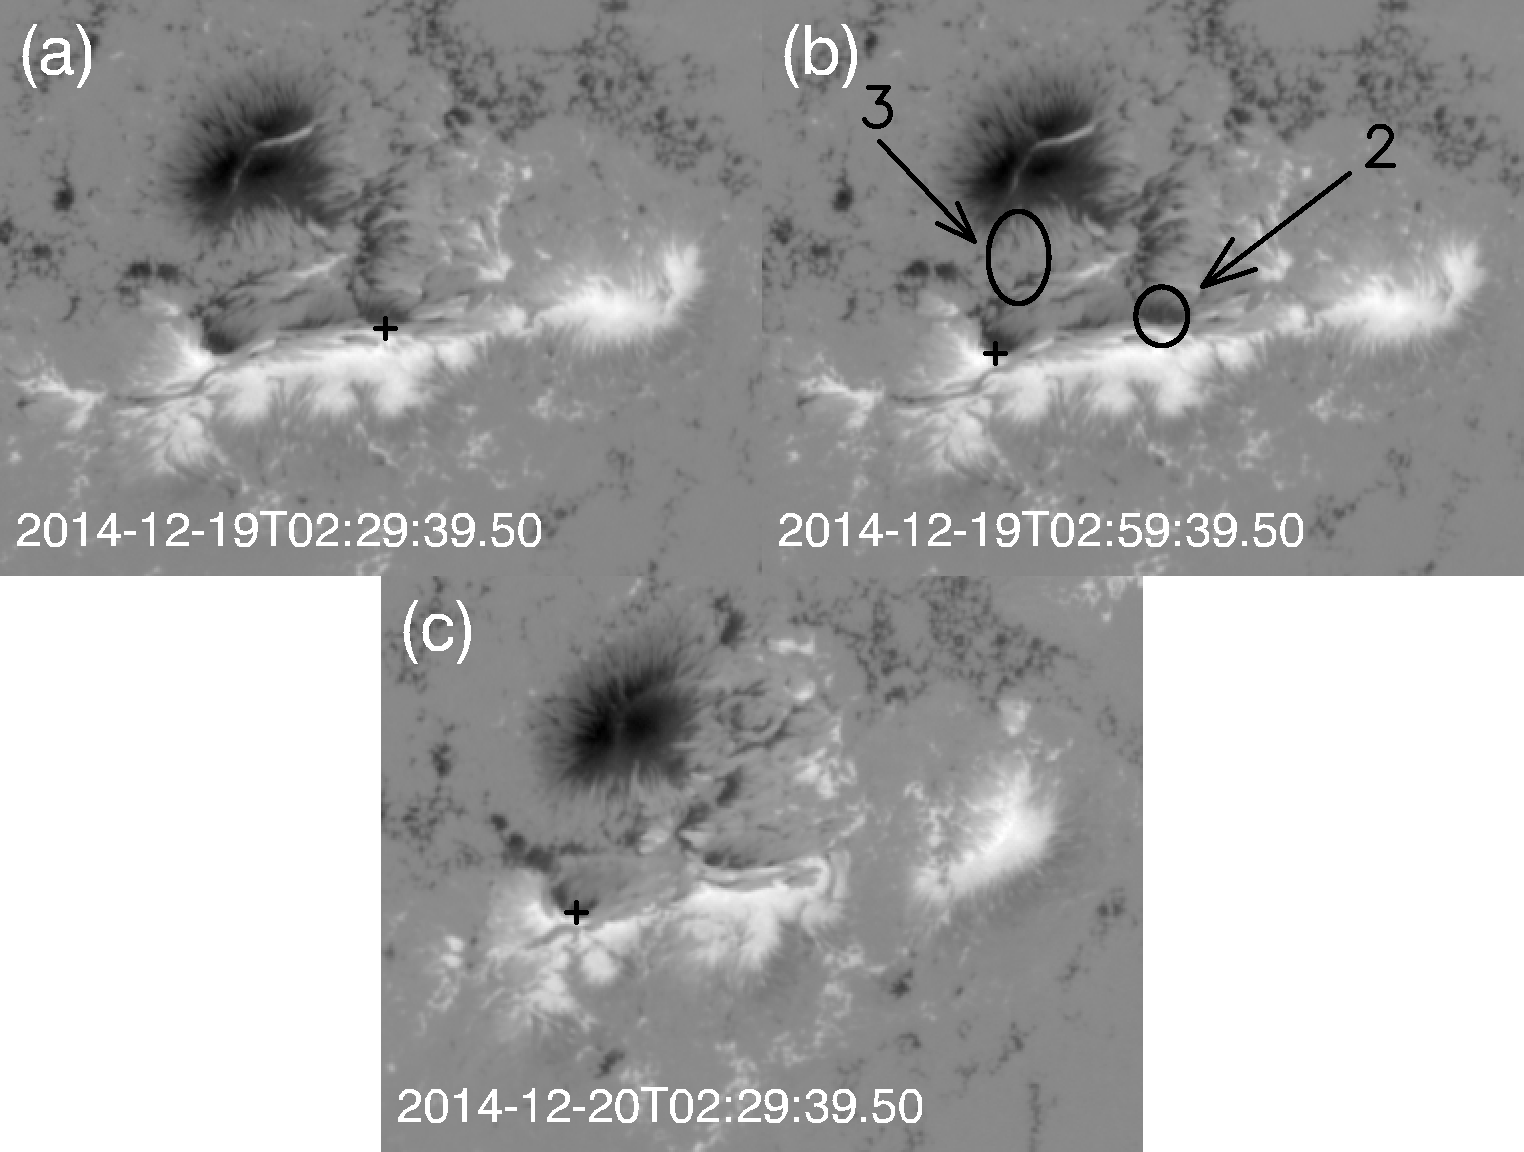
In Fig. 2, magnetograms show how the configuration of the magnetic field in AR 12242 changed from December 16 to 20: on December 18, a negative polarity field appeared to the south of the tail sunspot near the positive polarity field that existed on the previous day. Simultaneously, a negative polarity field westwardly approached the positive polarity field along the neutral line. The next day, on December 19, the opposite polarity fields got as close as possible at two sites near the neutral line (at points 2 and 3 marked by the corresponding arrows). On December 20, after the X1.8 flare, the negative polarity field at point 2 departed from the positive polarity field, while at point 3 the negative polarity field remained near the positive polarity field (see also Fig. 4c).
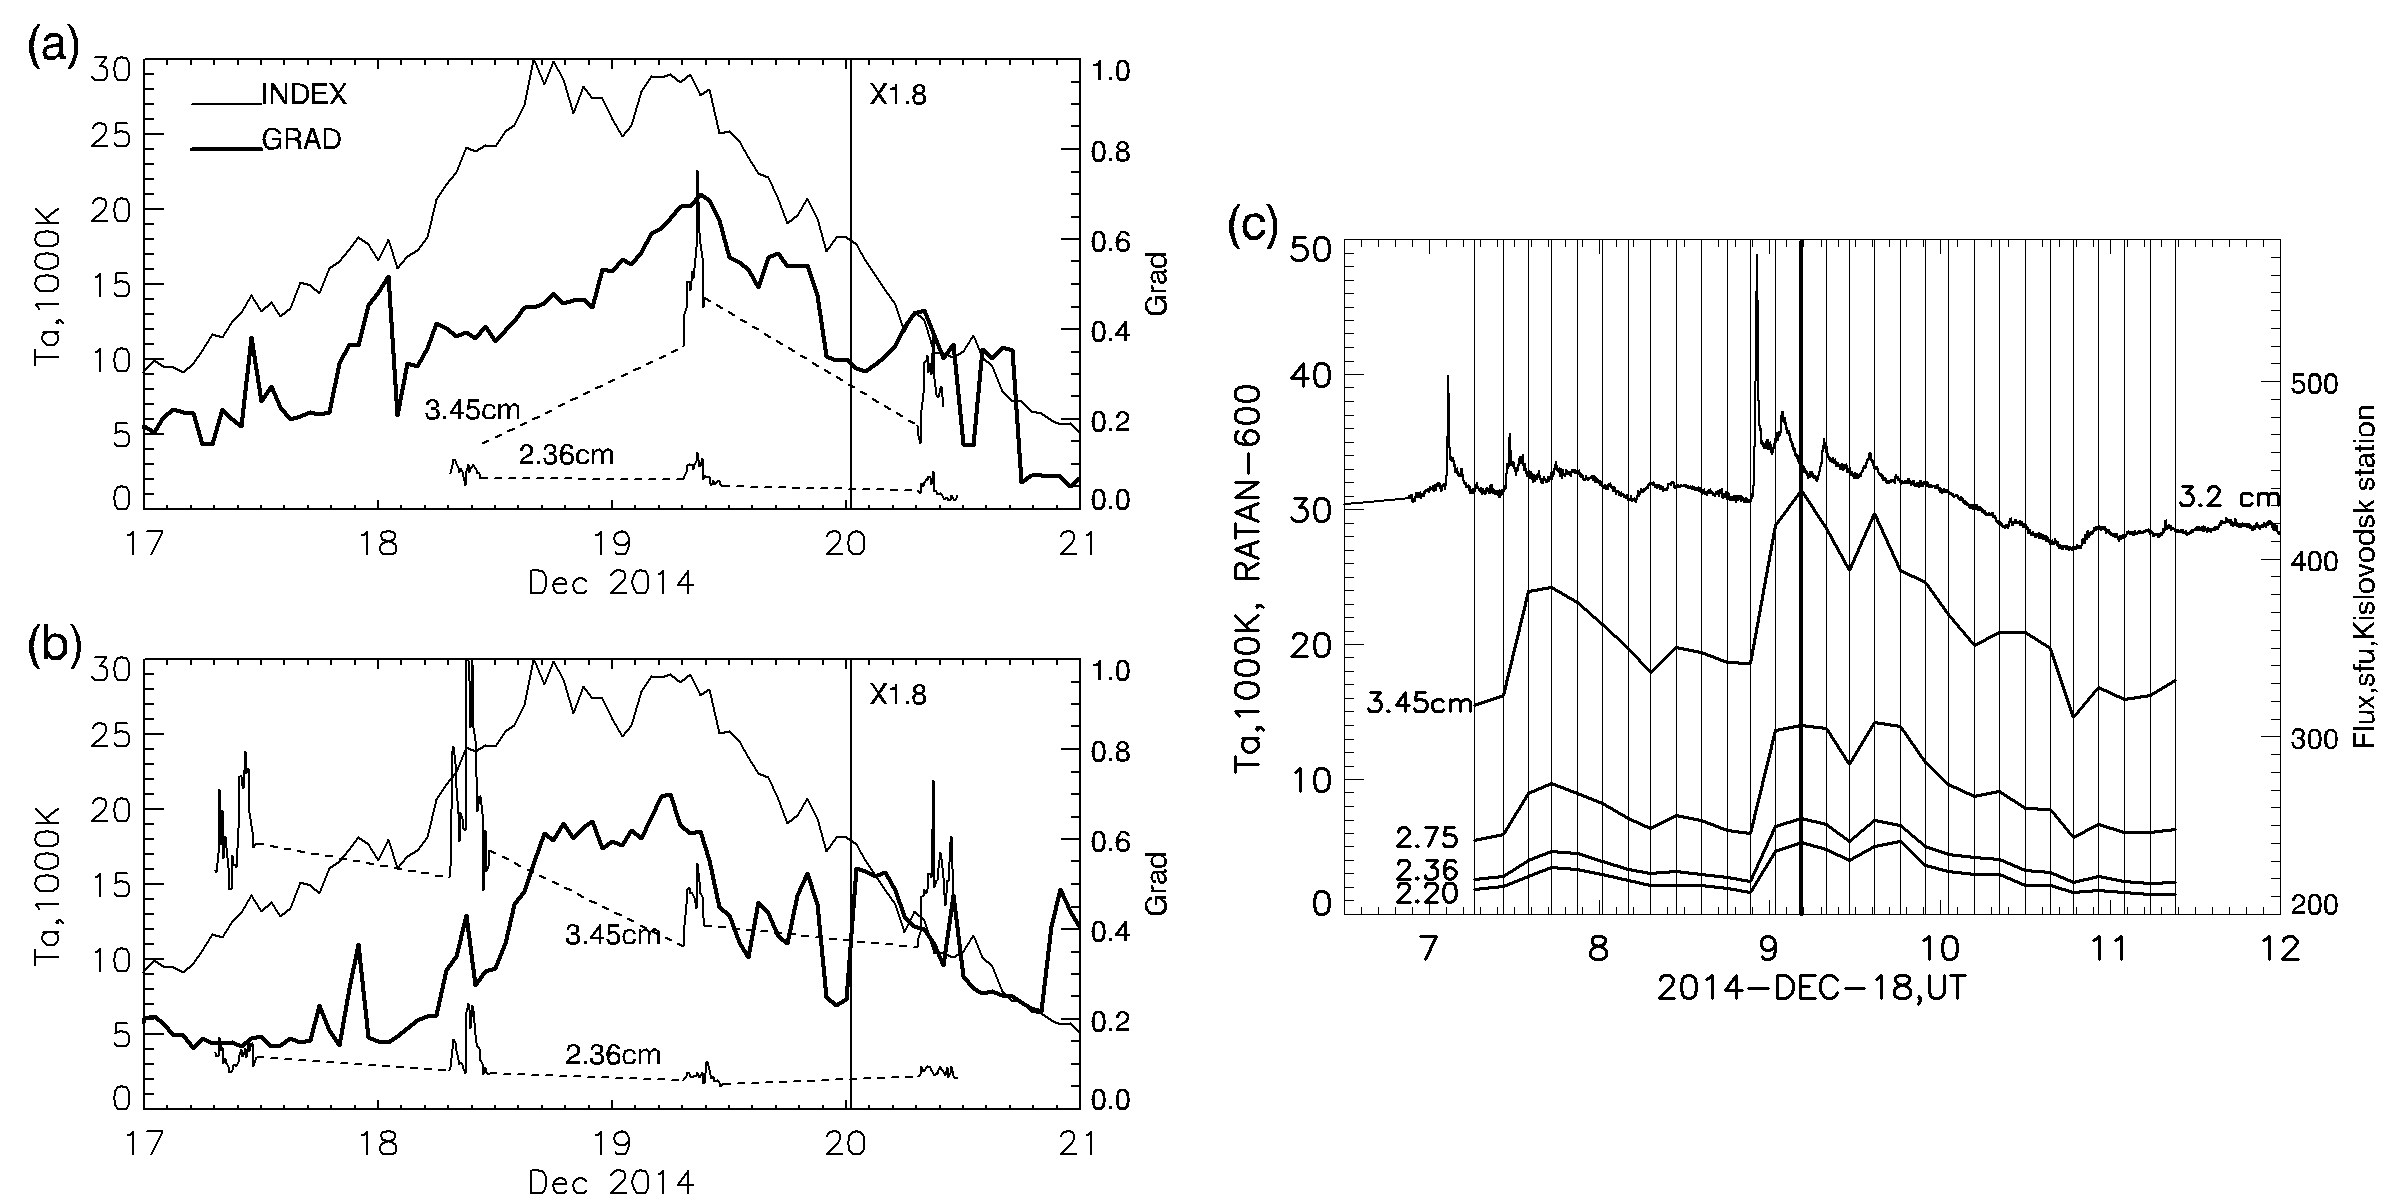
The magnetographic characteristics of the entire AR 12242 and specific regions 2 and 3 near the neutral line calculated based on the SDO/HMI data as described above are shown in Fig. 5, where the graphs of development of the total bipole moment index INDEX for the whole AR and magnitudes of gradients GRAD in separate regions 2 and 3 are given. A similar behavior in the development of both the total index and the gradients in both regions for the period from December 17 to 20 can be observed: the total index and gradients increase two days before the X-flare, and, after they pass a maximum (15-20 h before the flare), there is a decline before the X-flare.
In Fig. 4, the crosses on the AR magnetograms indicate the positions of the maximum gradient at times 02:29:39 and 02:59:09 UT. Calculations carried out with an interval of 10 30 min showed that, for the entire considered period starting from December 18, the maximum gradient in different time intervals for a long time was either in region 2 or in region 3. However, on December 19, the maximum gradient sites were alternately in regions 2 or 3, which is evident in the above examples on the magnetograms in Fig. 4a and 4b obtained with an interval of 30 min. After the X-flare on December 20, the gradient maximum was stably in region 3, and the gradient at point 2 decreased significantly. The negative polarity field moved away from the positive polarity field, and its intensity decreased by 20%.
5 ANALYSIS OF MICROWAVE OBSERVATIONS OF AR 12242
Let us consider the evolution of individual components of the microwave radiation of AR 12242 for December 17-20. Figure 5 shows changes in the intensity of individual components of AR microwave radiation in four days. Figures 5a and 5b show the intensities at 2.36 cm and 3.45 cm of microwave sources 2 (panel (a)) and 3 (panel (b)) expressed in antenna temperatures Ta over the observation periods with the RATAN-600 (daily in time intervals from 07:00 to 11:30 UT). In Fig. 5c, the evolution of source 3 at the wavelengths of 2.2, 2.36, 2.75, and 3.45 cm for December 18 is given in more detail. Here, in the upper part of the figure, the bolder line shows the change in the integral flux of the radio emission from the Sun at a wavelength of 3.2 cm according to observations at Mountain (Kislovodsk) Astronomical Station of the Pulkovo observatory. Vertical lines indicate the moments of radio observations in different azimuths. The thicker line corresponds to the observation time at the local noon. Figure 5c clearly shows a high correlation of variations in the intensity of the sources at all the given waves with variations in the integral flux of the Sun, which is due to microwave bursts associated with flares in AR 12242. A similar conclusion was drawn via comparison of variations in the intensity of sources 2 and 3 during observations with the RATAN-600 with variations in the integral flux of the Sun on other days.
Comparison of the evolution of the intensity of the sources that developed before the X-flare with the development of the magnetic field gradient in the regions near the neutral line with which they are identified (at points 2 and 3 in Fig. 2) is of particular interest. As can be seen from Fig. 5a, the evolution of source 2 (in particular, at 3.45 cm wavelength) reflects the evolution of the gradient 2 for December 18-20. Simultaneously, the intensity of source 3 changed insignificantly for the same period. This can be explained by the fact that the radiation of the sunspot microwave source associated with the tail sunspot of the group and, possibly, of the source generated near the neutral line associated with gradient 3 simultaneously entered a knife-edge antenna pattern. Apparently, the sunspot source radiation dominated, and it was quite stable (if we take into account that the field intensity in the tail spot for December 18-20 did not change by more than 10%).
The characteristics of the individual components of the microwave radiation of AR 12242 obtained from observations with the RATAN-600 were analyzed. Particular attention was paid to a comparison of the parameters of sources 2 and 3, the most intense microwave sources in the AR emission that were detected before the X1.8 flare (see Fig. 2).
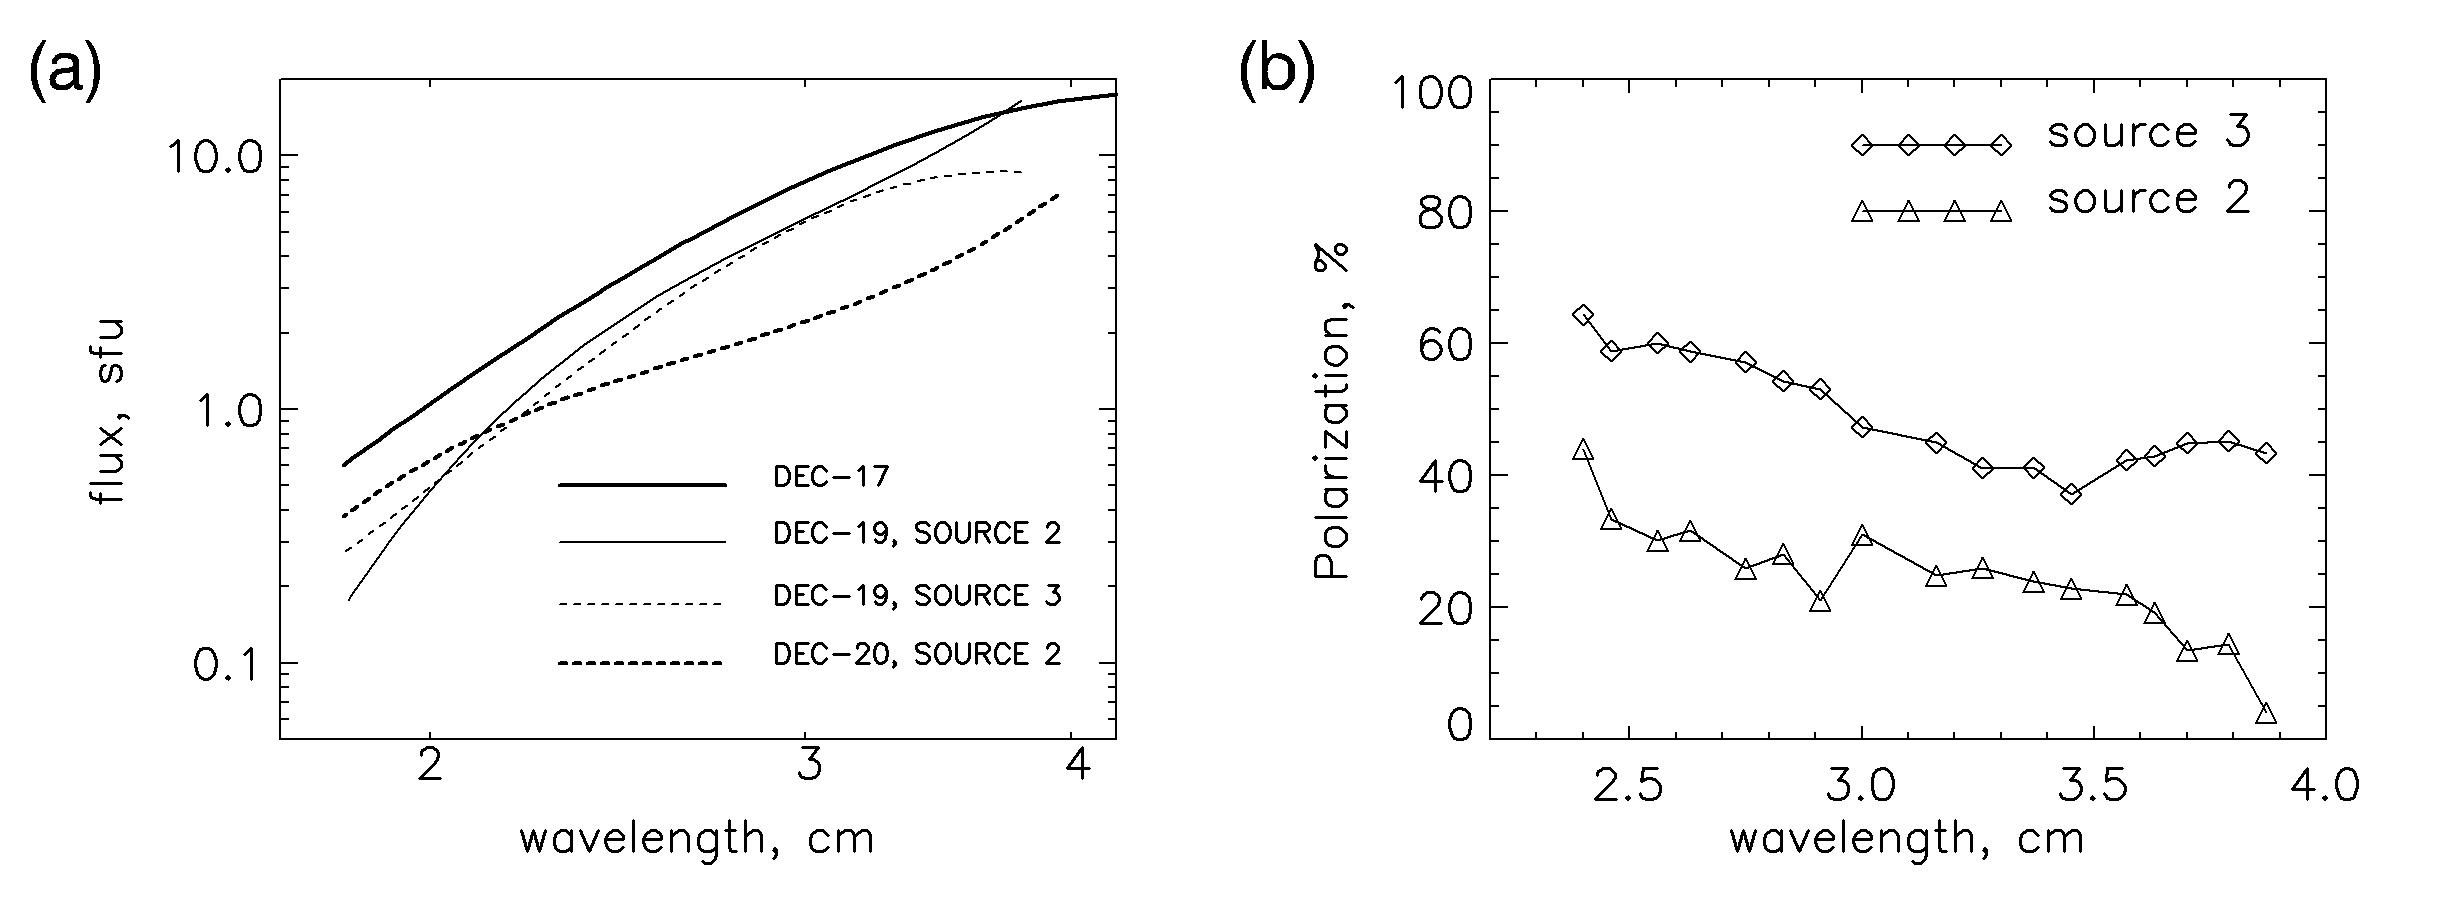
Figure 6a shows the spectra of source flux densities for different observation days. By comparing the spectra of the sources obtained on December 19 (for the times when there were no microwave bursts on the Sun), two main differences can be noted:
(a) In the short-wave part (at waves shorter than 2.5 cm), the source 2 spectrum slope is greater than that of source 3.
(b) In the case of the complete coincidence of the fluxes of both sources in the range of 2.5-3.2 cm, a difference in the fluxes (by 60%) on longer waves (about 4 cm) can be seen. If the angular sizes of both sources are close (as can be seen from the structure of the AR on short wavelengths), it can be assumed that the brightness temperatures of source 2 at wavelengths of about 4 cm are higher than those of source 3. However, it is impossible to reliably determine the brightness temperature of sources at wavelengths of about 4 cm because of the insufficient antenna resolution and, accordingly, because it is impossible to determine unambiguously the sizes of the sources. In this case, it can be stated that the brightness temperatures of the sources at wavelengths shorter than 3 cm are close and that they are about K at wavelengths longer than 3 cm.
Table 1 shows the spectral indices of the sources determined in the wavelength range of 1.8-2.5 cm according to observations on different days.
The spectrum of source 2 has the largest spectral index. The spectrum of source 3 has a smaller spectral index, which can be explained by the fact that the flux of source 3 was composed of the dominant flux of the sunspot source associated with a large tail sunspot and probably an existing source associated with the formed magnetic field gradient near the neutral line. However, when observing with a knife-edge antenna pattern, one cannot separate the radiation from these sources.
The spectrum of source 3 for December 17 reflects the total radiation of only two sunspot sources associated with large sunspots in the tail of the group (as seen in Fig. 2, the magnetic field gradient near the neutral line has not yet formed on this day). On December 20, the spectrum of the weak source remaining after the X-flare also has a low spectral index. Note that the gradient decreased significantly after the X-flare in this region near the neutral line as compared to what it was the day before the flare on December 19.
A comparison of the spectra of polarization degrees for sources 2 and 3 is presented in Fig. 5b. It can be seen that the polarization degree of source 2 is smaller than polarization degrees of source 3.
Thus, the main features by which the characteristics of microwave source 2 turned out to be different from these of source 3, in which the sunspot radiation prevails, were as follows: a steeper spectral slope (large spectral index) in the short-wavelength part of the centimeter range, small angular sizes comparable with the size of sunspot source, and a smaller polarization degree. Taking into account the fact that source 2 is identified with the site of the closest convergence of opposite polarity fields, i.e., with the site of the maximum gradient of the photospheric magnetic field near the neutral line, all of the above radio characteristics make it possible to attribute it to NLSs, which were repeatedly observed before large flares.
6 CONCLUSIONS
The results were presented for a study of the evolution of the microwave radiation and the magnetographic characteristics of NOAA AR 12242, in which there was a X1.8 flare on December 20, 2014 (according to the GOES classification). The analysis was carried out to identify the precursors of a large flare in the microwave range based on daily multiwavelength spectral-polarization observations of the Sun in the 1.65 10 cm range with the RATAN-600 radio telescope. SDO/HMI data were used to analyze the AR magnetographic characteristics.
Two days before the flare, the development of a new microwave source was detected; it became the dominant component in the AR radio emission the day before the X-flare and significantly decreased after the flare. It was found that the new source was identified with the site of the closest convergence of opposite polarity fields near the neutral line of the photospheric magnetic field. Magnetographic studies of AR 12242 showed that, during the development of the group, opposite polarity fields converged in the AR and strong gradients were formed near the neutral line, i.e., two days before the flare, a so-called it SHIL (strong-field, high-gradient polarity inversion line) formed in the AR that is now recognized by many researchers as the clearest AR precursor for a large flare (Schwijer et al., 2016; Harra et al., 2016; Turiumi et al., 2017).
The study of the evolution of the total gradient (flare index) of AR 12242 showed that, before the X-flare, the index first increased and then, after the maximum was passed (20 h before the flare), decreased before the X flare. Note that a similar conclusion was made by Korsos et al. (2014, 2015), who analyzed the parameters of sunspot groups in a number of flare regions and found that there is usually a sharp increase in the magnetic field gradient before large flares that reaches a high maximum, followed by its decrease just before the flare.
The identification of a microwave source that developed before the large flare with the site of the maximum gradient of the AR photospheric field near the neutral line and the parameters of its radio emission makes it possible to classify it as an NLS that was detected before flares in early solar observations with the RATAN-600, and were revealed as precursors of large flares in the analysis of a number of active events in 2011-2015 based on data from the RATAN-600 and SDO (Abramov-Maximov et al., 2015a,b).
The results make it possible to conclude that regular radio observations of the Sun in the microwave range can be used to identify precursors of large flares, based on which methods for their prediction can be developed.
7 ACKNOWLEDGMENTS
This study was partially supported by the Program of the Presidium of the Russian Academy of Sciences.
We thank the staff of the Special Astrophysical Observatory of the Russian Academy of Sciences for observations of the Sun with the RATAN-600 and A.D. Shramko for observations of the Sun at Mountain Astronomical Station of the Pulkovo observatory. We are grateful to the SDO team for the HMI(SDO) observational data. This work was performed using of the Nobeyama Radioheliograph operated by the International Consortium for the Continued Operation of Nobeyama Radioheliograph (ICCON). ICCON consists of the ISEE/Nagoya University, NAOC, KASI, NICT, and GSFC/NASA. L.V. Yasnov acknowledges the support of the Russian Foundation for Basic Research, project no. 16-02-00254. V.E. Abramov-Maximov acknowledges the support of the Russian Science Foundation, project no. 16-12-10448. We are grateful to the reviewer for helpful remarks.
References
- [1] Abramov-Maximov V.E., Borovik V.N., Opeikina L.V., Tlatov A.G. Dynamics of Microwave Sources Associated with the Neutral Line and the Magnetic-Field Parameters of Sunspots as a Factor in Predicting Large Flares // Solar Phys. V. 290. P. 53-77. 2015 .
- [2] Abramov-Maximov V.E., Borovik V.N., Opeikina L.V., Tlatov A.G. Precursors of the solar X flare on march 29, 2014, in the active region NOAA 12017 based on microwave radiation and magnetographic data // Geomagnetism and Aeronomy. V. 55. Issue 8. P 1097-1103. 2015b.
- [3] Akhmedov Sh.B., Borovik V.N., Gelfreikh G.B., Bogod V.M., Korzhavin A.N., Petrov Z.E., Dikij V.N., Lang K., Willson R. Structure of a solar active region from RATAN-600 and very large array observations // Astrophys.J. V. 301. P. 460-464. 1986.
- [4] Akhmedov Sh.B., Bogod, V.M., Borovik, V.N. et al. Structure of active regions on the Sun from VLA and RATAN-600 observations in July 1982 // Astrofiz. Issled. (Izv. SAO). V. 25. P. 105-134. 1987.
- [5] Akhmedov Sh.B., Borovik V.N., Gelfreikh G.B., Bogod V.M., Korzhavin A.N., Petrov Z.E., Hofmann A., Bachmann G. Cooperative magnetographic and radioastronomical investigations of the active solar region AR 3804 in July 1982 // Astrofiz. Issled. (Izvest. SAO). V. 28. P. 111-122. 1989.
- [6] Alissandrakis C.E., Gelfreikh G.B., Borovik V.N., Korzhavin A.N., Bogod V.M., Nindos A., Kundu M.R. Spectral observations of active region sources with RATAN-600 and WSRT // Astron. Astrophys. V. 270. P. 509-515. 1993.
- [7] Benz A. O. Flare Observations // Living Rev. Sol. Phys. V. 5. P. 1-59. 2017.
- [8] Bogod V.M., Zhekanis G.N., Mingaliev M.G., Tokhchukova S.Kh. Multi-azimuth regime of ob-servations at the RATAN-600 southern sector with periscope reflector // Radiophys. Quantum Electron. V. 47. No. 4. P. 227-237. 2004.
- [9] Bogod V.M., Alesin A.M., Pervakov A.A. RATAN-600 radio telescope in the 24th solar activity cycle. II. Multioctave spectral and polarization high resolution solar research system // Astrophys. Bull. V. 66. No. 2. P. 205-214. 2011.
- [10] Borovik V.N., Drake N.A., Golovko, A.A. Evolution of the magnetic flux in the flaring active region based on optical and radio observations // In: Teplitskaya, R.B. Ed. Solar Magnetic Fields and Corona, Proceedings of the XIII Consultation Meeting on Solar Physics, 26 September - 2 October, 1988, Odessa. Nauka. Siberion Division. Novosibirsk. V. 2. P. 162-166. 1989a.
- [11] Borovik V.N., Drake N.A., Korzhavin A.N., Plotnikov V.M. The evolution and structure of the flare-active region HR 16 631 (February 1980) based on RATAN-600 observations // Kinemat. Fiz. Nebesnyh Tel. V. 5. P. 63-67. 1989b.
- [12] Garaimov V.I. Processing of one-dimensional data vector arrays in Windows OS, WorkScan version 2.3 // Preprint no. 127T. Nizhnii Arkhyz: SAO. 1997.
- [13] Gyenge N., Ballai I., Baranyi T. Statistical study of spatio-temporal distribution of precursor so-lar flares associated with major flares // MNRAS. V. 459. P. 3532-3539. 2016.
- [14] Harra L.K. et al. The Characteristics of Solar X-Class Flares and CMEs: A Paradigm for Stellar Superflares and Eruptions? // Solar Phys. V. 291. P. 1761-1782. 2016.
- [15] Korsos M.B., Baranyi, T., Ludmany A. Pre-flare Dynamics of Sunspot Groups // Astrophys .J. V. 789. Id. 107. 7 P. 2014.
- [16] Korsos M.B., Gyenge N., Baranyi T., Ludmany A. Dynamic Precursors of Flares in Active Re-gion NOAA 10486 // Journal of Astrophysics and Astronomy. V. 36. Issue 1. P.111-121. 2015.
- [17] Korzhavin, A.N., Gelfreikh, G.B., Vatrushin, S.M. Peculiar sources of solar radio emission and their possible interpretation // In: Teplitskaya, R.B. Ed. Solar Magnetic Fields and Corona, Pro-ceedings of the XIII Consultation Meeting on Solar Physics, 26 September - 2 October, 1988, Odessa. Nauka. Siberion Division. Novosibirsk. V. 2 P. 119-124. 1989.
- [18] Kundu M.R., Alissandrakis C.E., Bregman J.D., Hin A.C. 6 centimeter observations of solar ac-tive regions with 6 SEC resolution // Astrophys.J. V. 213. P. 278-295. 1977.
- [19] Kundu M.R., Alissandrakis C.E. Structure and polarization of active region microwave emission. // Solar Phys. V. 94. P. 249-283. 1984.
- [20] Quinones J.A., Korzhavin A.N., Peterova N.G., Santos J. Observations of the solar eclipse on March 7, 1970 with the polarimeter of the Havana Radio Astronomical Station at 4.5 cm. // Soln. Dannye. 3. P.87-96. 1975.
- [21] Schrijver C.J. The nonpotentiality of coronae of solar active regions, the dynamics of the surface magnetic field, and the potential for large flares // Astrophys.J. V. 820. Id. 103. 2016.
- [22] Shibasaki K., Alissandrakis C.E., Pohjolainen S. Radio emission of the quite Sun and active re-gions // Solar Phys. V. 273. P. 309-337. 2011.
- [23] Tlatov A.G., Vasil’eva V.V., Makarova P.A., Otkidychev P.A. Applying an automatic image processing method to synoptic observations // Sol. Phys. V. 289. P. 1403-1413. 2014.
- [24] Toriumi S., Schrijver C.J., Harra L.K., Hudson H., Nagashima K. Magnetic properties of solar active regions that govern large solar flares and eruptions // Astrophys.J. V. 834. Id. 56. 2017.
- [25] Uralov A.M., Nakajima H., Zandanov V.G., Grechnev V.V. Current-sheet-associated radio sources and development of the magnetosphere of an active region revealed from 17 GHz and Yohkoh data // Solar Phys. V. 197. P. 275-312. 2000.
- [26] Uralov A.M., Rudenko G.V., Rudenko I.G. 17GHz Neutral Line Associated Sources: Birth, Mo-tion, and Projection Effect // Publications of the Astronomical Society of Japan. V. 58. No.1. P. 21-28. 2006.
- [27] Uralov A.M., Grechnev V.V., Rudenko G.V., Rudenko I.G., Nakajima H. Microwave Neutral Line Associated Source and a Current Sheet // Solar Phys. V. 249. P. 315-335. 2008.
- [28] Yasnov L.V. On the Nature of Neutral-Line-Associated Radio Sources // Solar Phys. V. 289. P.1215-1225. 2014.
| Date (December 2014) | Spectral index |
|---|---|
| 17 | 5.6 |
| 19, source 2 | 8.5 |
| 19, source 3 | 6.5 |
| 20, source 2 | 3.5 |