Searching for Extragalactic Sources in
the VISTA Variables in
the Vía Láctea Survey
Abstract
We search for extragalactic sources in the VISTA Variables in the Vía Láctea survey that are hidden by the Galaxy.
Herein, we describe our photometric procedure to find and characterize extragalactic objects using a combination of SExtractor and PSFEx. It was applied in two tiles of the survey: d010 and d115, without previous extragalactic IR detections, in order to obtain photometric parameters of the detected sources. The adopted criteria to define extragalactic candidates include ; 1.0 R; 2.1 C 5; and and the colors: 0.5 (J - Ks) 2.0 mag; 0.0 (J - H) 1.0 mag; 0.0 (H - Ks) 2.0 mag and (J - H) + 0.9 (H - Ks) 0.44 mag.
We detected 345 and 185 extragalactic candidates in the d010 and d115 tiles, respectively. All of them were visually inspected and confirmed to be galaxies. In general, they are small and more circular objects, due to the near-IR sensitivity to select more compact objects with higher surface brightness.
The procedure will be used to identify extragalactic objects in other tiles of the VVV disk, which will allow us to study the distribution of galaxies and filaments hidden by the Milky Way.
1 Introduction
The Milky Way (MW) complicates the study of extragalactic objects that are behind our Galaxy due to the presence of dust, gas and stars that absorb, obscure and reduce their brightness. However, some efforts were made in the past to find these objects with one of the pioneers being Renee Kraan-Kortewerg, who led in the 1990´s several studies in the plane of the Galaxy. Kraan-Korteweg (1999) discussed the importance of deep surveys in the optical, near-infrared (near-IR) and blind HI wavelength regimes, as well as associated systematic issues. Galactic dust obscuration attenuates the light coming from extragalactic sources in the optical region and it is transparent to the 21-cm line radiation of neutral hydrogen, favoring the detection of HI-rich galaxies. In the optical wavelengths, these authors defined a limiting diameter to discriminate between stars and galaxies, with objects of diameters greater than 0.2 arcmin being considered to be galaxy candidates. Using this procedure, Kraan-Korteweg (2000) observed objects in the Antlia and Hydra galaxy clusters, in the direction of the Cosmic Microwave Background radiation dipole and found more than 8000 new galaxy candidates. In addition, Woudt & Kraan-Korteweg (2001) studied the neighborhoods of the Crux (289 318∘ and 10∘) and the Great Attractor (289 338∘ and 10∘) regions.
Recently, McIntyre et al. (2015) presented a blind HI survey named the Arecibo L-band Feed Array Zone of Avoidance (ALFA ZOA) deep Survey, using the Arecibo Radio Telescope. On analyzing an area of 15 square degrees centered on l = 192∘ and b = −2∘, they encountered 61 galaxies and concluded that bright galaxies are likely to be identified in infrared surveys, with less probability at higher extinctions. Ramatsoku et al. (2016) focused their 21cm HI-line imaging survey on the Perseus-Pisces Supercluster filament crossing the ZOA and detected 211 galaxies in an area of 9.6∘, with 62% of these having near-IR counterparts in the UKIRT (UK InfraRed Telescope) Infrared Deep Sky Survey (UKIDSS; Lawrence et al. 2007). They also noted that near-IR selection favored early-type galaxies, in contrast with the late-types typically detected in HI samples. Moreover, Staveley–Smith et al. (2016) presented a HI survey of the extragalactic sources in the southern regions of the Galaxy (l=212∘ to l=36∘ and ) and discovered complex structures with three new galaxy concentrations in the Great Attractor region.
The older stellar population in galaxies emits most of the light in the near-infrared wavelength range. One of the most important near-IR surveys that has been carried out is the 2 Micron All Sky Survey (2MASS, Skrutskie et al. 2006), covering the whole sky in the J, H, and K passbands including the Point Source Catalog, and also the Extended Source Catalog (2MASSX). Jarrett et al. (2000a) described the basic algorithms utilized in this survey for the object detections and their characterizations, and Jarrett et al. (2000b) reported extended sources beyond the plane of our Galaxy. A complete detection of galaxies brighter than K, H 14.3 and J 15.0 mag was presented, over a wide range of surface brightnesses. In their star-galaxy separation, in order to resolve confusion among real galaxies, Galactic nebulae, double stars and other artifacts that could be bright stars or meteor streaks, they also used the (J - H) vs (H - Ks) color plane and a color separation of (J - Ks) between stars and galaxies. In this way, Jarrett et al. (2000b) confirmed 14 of the 2MASS galaxy candidates using follow-up observations in the ZOA using HI 21cm and optical spectroscopy. Deeper near-IR surveys than 2MASS are UKIDSS (Lawrence et al. 2007) and VISTA (Visible and Infrared Survey Telescope for Astronomy) Kilo-degree INfrared Galaxy survey (VIKING; Arnaboldi et al. 2007) probing other areas of the sky. Moreover, Williams, Kraan-Korteweg & Woudt (2014) and Said et al. (2016a, 2016b) obtained near-IR photometric properties of spiral galaxies using the Parkes deep HI survey of the ZOA (HIZOA, Henning, Kraan-Korteweg & Staveley-Smith 2005). They were interested in distance determinations and peculiar velocities using the Tully-Fischer relationship (Tully & Fischer, 1977).
The VISTA Variables in the Vía Láctea (VVV, Minniti et al. 2010) is a public European Southern Observatory (ESO) near-IR variability survey covering the MW Bulge (-10∘ l +10∘ and -10∘ b +5∘) and an adjacent section of the mid-plane (-65∘ l -10∘ and -2∘ b +2∘). This large survey offers an excellent opportunity to study extragalactic sources behind the MW, such as background galaxies and quasars. Using the VVV data, Amôres et al. (2012) visually identified 204 galaxy candidates in the d003 tile (l = 298.356∘, b = -1.650∘) by analyzing their size and colors. Later, Coldwell et al. (2014) obtained the photometric properties for the galaxy cluster Suzaku J1759-3450 at z=0.13 in the b261 tile (l = 356.597∘, b = -5.321∘).
In order to take advantage of the VVV data, the main goal of this work was to find and characterize extended objects behind our Galaxy. This is the first paper that describes in detail a methodology to search, detect and analyze the photometric properties of these objects in two tiles of the VVV survey. This paper is organized as follows: in 2 we briefly describe the VVV survey and in 3 the photometric pipeline of the SExtractor+PSFEx combination is presented. In 4, our procedure is compared with those obtained by the Cambridge Astronomical Survey Unit. We present in 5, the criteria to select the extragalactic sources, and in 6, their main photometric characteristics. Finally, 7 summarizes the main results of this study and suggests the future work.
2 Observational database: The Vista Variables in the Vía Láctea
The 4m VISTA telescope at ESO is equipped with a VIRCAM camera (Emerson, McPherson & Sutherland 2006; Dalton et al. 2006), which is an array of 1620482048 Raytheon VIRGO IR detectors with a scale of 0.339 arcsec/pix with five broad passbands: Z, Y, J, H and Ks and three narrow passbands at 0.98, 0.99, and 1.18 m. The VVV is one of the six largest ESO public surveys conducted using this telescope without any overlapping regions. The VVV images (Tiles) are produced by six single pointing observations with a total field of view of 1.64 square degrees. The survey area is fully covered by 348 tiles: 196 in the bulge and 152 in the disk of the MW. These data were reduced using the pipeline developed by the Cambridge Astronomical Survey Unit (hereafter CASU) within the VISTA data flow system (Lewis et al. 2006, Emerson, McPherson & Sutherland 2006). Due to the large amount of data, processing was performed on a night-by-night basis and consisted mainly of: mean dark current subtraction; a linear correction applied to the detectors; a flat-field correction made by dividing the mean twilight flat-field; and a sky background correction that removed the large-scale spatial background emission. The photometric data provided by CASU (Saito et al. 2012) mainly included the equatorial coordinates, the fluxes at different apertures, and a simple classification as stellar (flag=-1) or non-stellar (flag=+1) objects.
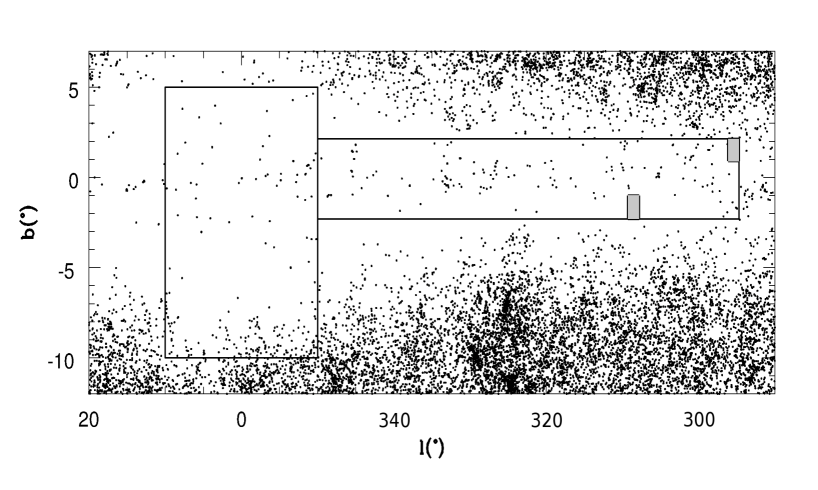
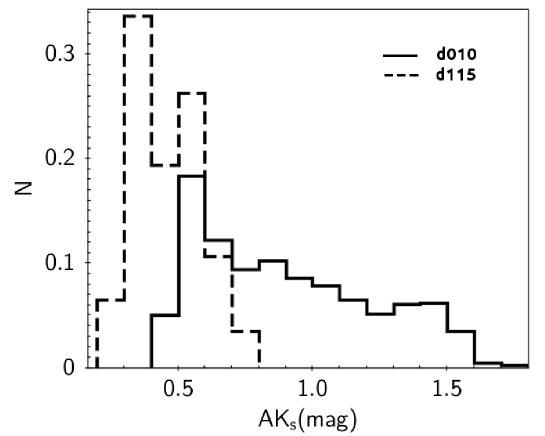
The main goal of the VVV project is to identify variable stars in the MW. However, there are additional scientific objectives such as searching for new star clusters, background quasars and extended objects. In this sense, our goal was to find extended objects in these regions by searching for extragalactic sources and to obtain and characterize their photometric properties. In this work, we analyzed two VVV regions in the disk with opposite galactic latitudes, corresponding to the tiles: d010 centered at J2000 , (l=308.569∘, b=-1.650∘) and d115 at J2000 , (l=295.438∘, b=1.627∘), with observing time of 20s for Z and Y; 10s for J and H; and 4s for Ks passbands. The two tiles were selected because there are no near-IR extended sources previously detected at these latitudes. In fact, in the d010 tile, the galaxy HIPASS J1341-64 was reported by Kilborn et al. (2002) with a radial velocity of 2473 km s-1. Recently, the HIZOA-S survey (Staveley-Smith et al. 2016) observed two galaxies in the region: HI J1341-64 and HI J1347-64. Figure 1 shows the distribution in galactic coordinates of the extended sources from 2MASSX at lower galactic regions, and includes a sketch of the area covered by the VVV. The studied tiles are highlighted in gray, which are located at the outermost parts of the VVV disk in the less crowded regions with smaller interstellar extinctions. Figure 2 shows the A distributions and the extinction in the Ks passband for the two tiles obtained from the Galactic dust extinction maps of Schlafly & Finkbeiner (2011). The median A values are 0.86 0.32 and 0.42 0.08 for the d010 and d115 tiles, respectively, with the d010 tile having a much more widespread distribution in A and showing regions of higher absorptions.
3 The photometric pipeline
Different photometric procedures which can separate stellar and extended objects and perform photometry have been utilized to determine sources in astronomical images. For example, SExtractor (Bertin & Arnouts 1996) is a program that analyzes images with the aim of producing a large amount of photometric data, and PSFEx (PSF Extractor, Bertin 2011) generates the Point Spread Function (PSF) from the images processed by SExtractor. The resulting PSF models can then be used for model-fitting photometry and morphological analyses111http://www.astromatic.net/software/sextractor and http://www.astromatic.net/software/psfex. Annunziatella et al. (2012) compared the extraction performances of using the combination of SExtractor with PSFEx against DAOPHOT (Stetson 1987) and ALLSTAR (Stetson 1994), which are the most traditional applications. The main conclusion was that DAOPHOT and ALLSTAR both provide optimal solutions for point-source photometry in stellar fields, whereas SExtractor and PSF photometry gave more accurate photometry for galaxies. Mauro et al. (2013) also created an automatic PSF-fitting photometric pipeline (the VVV-SkZ pipeline) based on DAOPHOT and produced a deeper stellar photometry with the VVV data. Here, based on the Annunziatella et al. (2012) results, we decided to use the SExtractor and PSFEx combination to detect and analyze the extended objects in the VVV survey, and in this section we describe our adopted procedure.
3.1 SExtractor
SExtractor has the ability to detect astronomical sources by identifying regions in images with different properties or features, such as brightness, color and texture, and has been used in different extragalactic studies. Varela et al. (2009) obtained the B and V photometry of the WIde Field Nearby Galaxy-cluster Survey (WINGS), while Durret et al. (2011) counted clusters of galaxies as a function of mass and redshift in the Canada France Hawaii Telescope Legacy Survey (CFHTLS). In addition, Nilo Castellón et al. (2014) obtained the galaxy morphological parameters of galaxy clusters with low-X ray emissions.
SExtractor uses various steps to separate objects. In the first part of the process, SExtractor identifies and separates an object from the background noise. Then, the object is defined as the sum of adjacent pixels, with signals coming from the contribution of the object itself, and also the background. A background map is created by defining a grid over the image, which divides the original frame into several boxes where the local background is calculated. A combination of clipping and mode estimation is applied over the grid, with a median filter used to suppress possible local background overestimation, and a bi-cubic-spline interpolation utilized to smooth out the background map. At this stage, the filtering is necessary to separate low surface brightness objects from spurious detections, such as optical defects, inhomogeneities in the images, cosmic rays and bright spikes from saturated objects. SExtractor applies convolution filters over the image, with the filtering selection depending on the image characteristics, atmospheric conditions, studied regions and source morphologies. In our case, we decided to choose the Gaussian filter, because it works well on the detection of faint and extended objects, and Gaussian functions were defined, with 55 pixels with convolution mask of a full width half maximum (FWHM) of 3 pixels. Finally, thresholding and deblending were performed after applying the convolution filter. For the detection and separation of objects from the background noise, SExtractor uses a minimum number of adjacent pixels defined with a flux in the Ks passband of above the local background, where is its dispersion. The deblending facility is one of the most important SExtractor features, which can analyze overlapping objects. This is carried out using a multi-thresholding algorithm, that employs a multiple isophotal analysis technique (Beard, McGillivray & Thanish 1990).
3.2 PSFEx
Based on small images previously processed by SExtractor, PSFEx automatically selects non-saturated stars to compute different PSF models. In our study we adopted a 2020 pixel kernel, and followed variations to the 3rd order. The PSF is modelled as a linear combination of basis functions as the Gaussian, or normal distributions derived using point sources with an S/N 20; elongations higher than 0.98; and a half-light Radius (R1/2, the radius that encloses 50% of the object total flux) in the range of 0.5 to 0.9 arcsec. The best PSF model was a two-dimensional modeling which minimized the goodness between the observed flux distribution and the model. It was applied to the images to perform PSF photometry, with the magnitudes being estimated by integrating the sources over the model.
3.3 SExtractor and PSFEx
Briefly, the photometric pipeline consists of three steps:
-
1.
SExtractor creates catalogs, which include the position of the objects, the morphology, some flags and small images associated with each detection.
-
2.
PSFEx takes the SExtractor catalogs and creates the best PSF model, by looking for unsaturated, circular, isolated and well defined objects, in order to model the PSF of each point source.
-
3.
Finally, SExtractor applies the PSF model to each source to obtain the astrometric, photometric and morphological properties.
SExtractor+PSFEx was used in the d010 and d115 tiles of the VVV survey, and we detected 752,233 and 310,283 sources, respectively. The results include astrometric and photometric data such as coordinates and PSF magnitudes and circular aperture magnitudes within a diameter of 2 arcsec that allow us to have a lower stellar contamination. The PSF magnitudes are total magnitude estimates obtained as an improvement of SExtractor MAG_AUTO magnitudes taking into account the flux wings (Annunziatella et al. 2013). With the total flux SExtractor+PSFEx also give the R1/2, the half-light radius and the ellipticity. Also, for the spheroid Sersic index (n, Sersic 1968), SExtractor+PSFEx compute the model for a single Sersic component convolved with the PSF model. The concentration index (C, Conselice, Bershady & Jangren 2000) is calculated as the ratio of two circular radii that contain 80 and 20 percent of the total Petrosian flux. The colors are obtained using the circular aperture magnitudes. All these parameters are used to separate stellar and extended objects, and also to characterize the photometric and morphological properties of the extended sources.
4 Comparison with CASU
4.1 Completeness and detection efficiency
We determined confidence levels and limiting magnitudes of our photometric procedure using all the detections obtained with SExtractor+PSFEx. We have used the Completeness Estimator of source extraction (ComEst) by Chiu, Desai & Liu (2016) to obtain the completeness of our detections. This program derives the detection rate of synthetic point sources and galaxies on optical and near-IR images. The observed sources detected by SExtractor were first removed from the images creating a source-free image. Then, artificial sources were added to this image. Simulated galaxies were created using GalSim (Rowe et al. 2015), which considered a mixture of bulge and disk components convolved with PSF models varying the half-light radius, the major-to-minor axis ratio, and the position angle in a range of Ks magnitudes between 14 and 20 mag. The sources are randomly placed on the source-free images assuming a number density of 15 galaxies per arcmin square. Figure 3 shows the Ks passband completeness of the two studied tiles. We find that the source detection efficiency reaches 50% for point and extended sources at about Ks = 18.0 mag. This is in agreement with the CASU completeness results of Saito et al. (2012). The different behavior for the two tiles are related to the extinctions shown in Figure 2.
4.2 Astrometry and photometry comparison
In order to check our photometric procedure, in this section, we compare the positions and magnitudes of the objects detected using the SExtractor+PSFEx photometry with those of CASU. Point sources were selected from the CASU catalogs222 http://horus.roe.ac.uk/vsa/ (flag=-1) and SExtractor+PSFEx catalogs (CLASS_STAR higher than 0.9). We cross-matched the sources in both catalogs within a distance radius of 0.1 arcsec and we used circular aperture magnitudes within a diameter of 2 arcsec considering only errors in the photometry smaller than 0.1 mag. Both magnitude systems are aperture corrected.
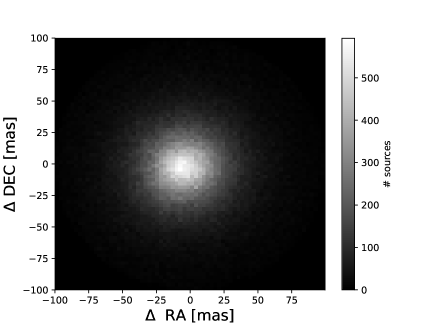
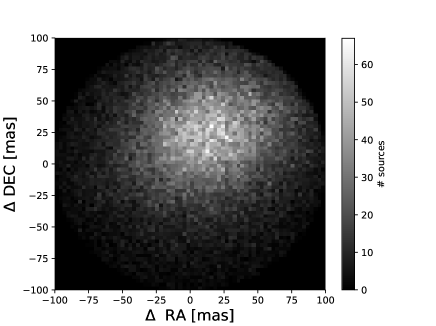
Figure 4 shows the comparisons in positions of detected point sources as density plots for the two tiles using both the SExtractor+PSFEx and CASU procedures. There are small offsets with median differences of RA cos(Dec) = -4.38 0.04 and 10.12 0.11 , and Dec = -2.30 0.04 and 19.19 0.11 , for the d010 and d115 tiles, respectively. The astrometric accuracy is quite good, and the position uncertainties are lower than 175 for Ks=18.0 mag reported by Saito et al. (2012) for the VVV survey.
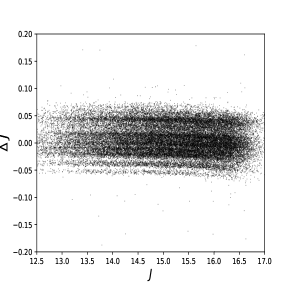
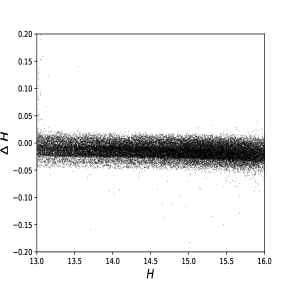
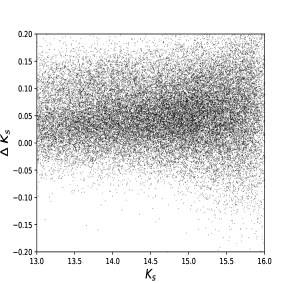
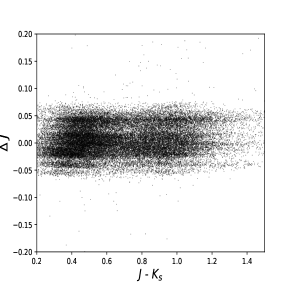
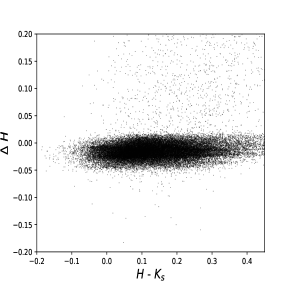
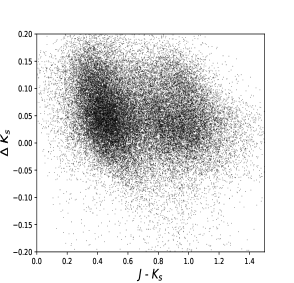
Figure 5 shows the differences for point source detections in the d115 tile between our circular aperture J, H, and Ks magnitudes and those of CASU as J, H and Ks, respectively vs our magnitudes. The median differences are J = 0.0040.001 mag, H = -0.0140.001 mag and Ks = 0.0460.001 mag. Similar results have been obtained for the d010 tile. The comparisons show some separate offsets between the magnitude systems, specially for the J passband. This effect is related to the CASU tiling process (González-Fernández et al. 2017). The PSF variations along the tiles are shown as systematic spatial offsets in the photometry. The CASU photometry takes this into account using a variable aperture correction. The differences with our procedure are lower than 0.1 mag, that is under our uncertainties. Figure 6 shows the same differences in J, H and Ks aperture magnitudes compared with our colors. The tiling effect is also present in these comparisons, which are better than 0.2 mag with no clear color dependence.
From the comparisons between CASU and SExtractor+PSFEx photometry, we are confident in using the SExtractor+PSFEx procedure for the search and analysis of extended objects in the VVV survey.
5 Searching for extragalactic objects
In this section, we present the results of our search of extended objects detected using SExtractor+PSFEx on the two studied VVV tiles. After automatic identification of these candidates using their morphological and photometric properties, we performed a visual inspection to check the detection quality.
5.1 Object classification
We classified the detected objects and we divided them in point and extended sources using a combination of four morphological parameters provided by SExtractor+PSFEx: the CLASS_STAR index; R1/2; the concentration index, C; and the SPREAD_MODEL () parameter.
The CLASS_STAR is a stellarity index associated with the light distribution of the source, which depends on the FWHM and the pixel scale of the image and ranges from 1 (for perfectly circular objects such as stars) to 0 (for extended objects, for example galaxies). On the other hand, is a normalized linear simplified discriminant included in the new SExtractor versions as another star-galaxy classifier. The use of neural networks and the SPREAD_MODEL parameter for object classification (Annunziatella et al. 2012) has produced deep catalogs, with a good star-galaxy separation as in the case of Desai et al. (2012). The parameters R1/2; and C have been defined previously in 3.2.
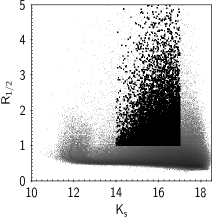
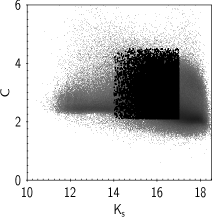
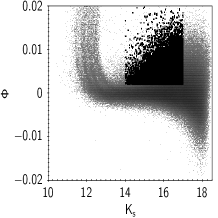
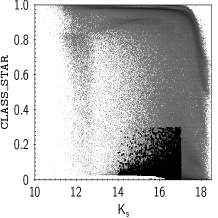
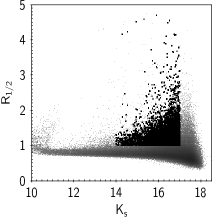
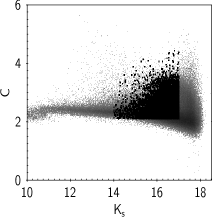
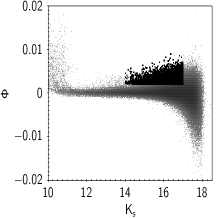
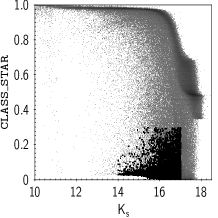
Taking into account the morphological properties of the objects detected simultaneously in the J, H and Ks passbands, our adopted criteria to define extended objects were: ; 1.0 R; 2.1 C 5; and . In this way, we obtained 17,889 and 7,055 extended objects for d010 and d115 tiles, respectively, which represents about 2.4% of the total detected objects. Figure 7 shows for all detections (from left to right), the parameters: R1/2; concentration index; SPREAD_MODEL and CLASS_STAR as a function of the Ks magnitudes without any extinction correction. Upper (bottom) panels display the results for the d010 (d115) tile. Gray points represent all detections and black points are the extended sources that satisfy our adopted criteria. The morphological parameters are better defined for sources in the d115 tile, related to lower extinction values with a better defined distribution found for this tile and shown in Figure 2.
5.2 The color criterion
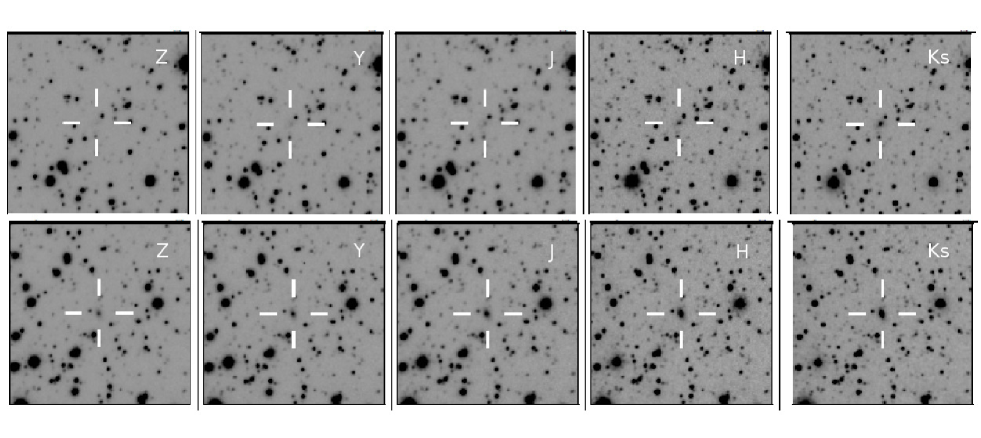
The SExtractor+PSFEx combination extracts sources above a defined threshold in surface brightness. Some extended sources are detected in the near-IR passbands at longer wavelengths (J, H and Ks passbands), and they are very faint or not even visible at shorter wavelengths (Z and Y passbands). In contrast, the stellar objects were clearly visible in the five passbands of the survey. Figure 8 shows the Z, Y, J, H and Ks images of two examples of extended sources with detections in three (upper panels) and five (bottom panels) passbands.
SExtractor+PSFEx may confuse some faint objects, with clumps of stars or star associations in the MW and they might be interpreted as single objects. In order to reduce the number of false detections and to better characterize the extended objects, we added the color as an additional criterion. The magnitudes and colors were first corrected by extinction along the line-of-sight using the maps of Schlafly & Finkbeiner (2011) and the relative extinctions of Catelan et al. (2011) for the VVV IR passbands.
At lower latitudes, the contamination by foreground stars is important. Williams, Kraan-Korteweg & Woudt (2014) used the KILLALL routine (Buta & McCall 1999) for star subtraction. We performed a visual inspection as a cross-check of the automatic identification and classification of extended sources obtained by SExtractor+PSFEx. About 10% of these objects have the presence of nearby stars that affect the magnitudes. We implemented a similar process based on DAOPHOT routines in IRAF333IRAF: the Image Reduction and Analysis Facility is distributed by the National Optical Astronomy Observatories, which is operated by the Association of Universities for Research in Astronomy, Inc. (AURA) under cooperative agreement with the National Science Foundation (NSF). (Tody 1993): we detected stars above 4.0 of the background; we performed the photometry and PSF determinations based on an appropriate star selection; and finally, the stars were subtracted from the images. Then, we re-run SExtractor+PSFEx on these star-subtracted images to obtain the corrected photometric parameters.
Amôres et al. (2012) and Jarrett et al. (2000a and 2000b), have previously used color cuts to select and separate their sources, with Amôres et al. (2012) reporting that the galaxy candidates had colors 0.5 (J - H) 1.8 mag; 0.3 (H - Ks) 1.3 mag; 0.5 (Y - J) 1.5 mag and 0.5 (Z - Y) 1.3 mag (their Figure 4). Jarrett et al. (2000a) noted that in the IR the light of the galaxies was dominated by older and redder stellar populations, and defined a color score to separate extragalactic sources from stars, with the former having redder colors and a more extended appearance than other objects. Jarrett et al. (2000b) confirmed by spectroscopy the extragalactic nature of their extended sources, which had intrinsically red colors, (J - Ks) 1.0 mag.
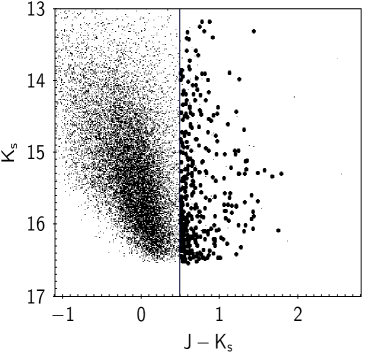
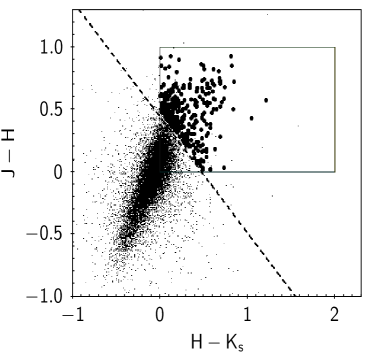
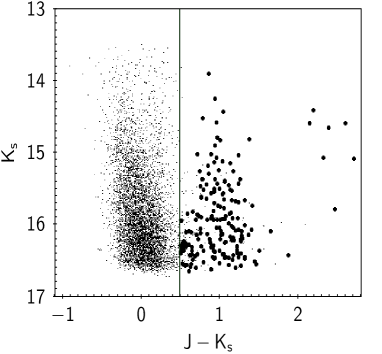
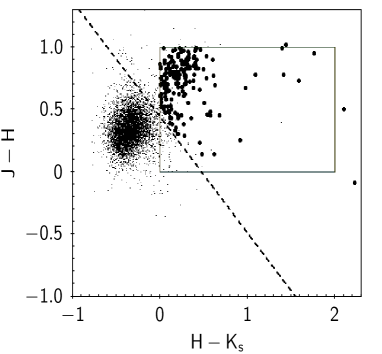
Figure 9 shows the Color-Magnitude and Color-Color Diagrams for the extended objects detected in three J, H and Ks passbands in the d010 (upper panels) and d115 (bottom panels) tiles, which are represented by small dots. We visually found the presence of false detections, mainly double stars, triple stars, and more complex stellar associations. We used the following color cuts: 0.5 (J - Ks) 2.0 mag; 0.0 (J - H) 1.0 mag and 0.0 (H - Ks) 2.0 mag to eliminate these false detections based on previous analyses of Amôres et al. (2012) and Jarrett et al. (2000a and 2000b) and our visual inspection. These color cuts are represented with solid lines in the Figure 9. We also defined a straight line (dashed line in the figure) and the extragalactic candidates have ”distances” to this line defined as (J - H) + 0.9 (H - Ks) 0.44 mag. These objects are represented by larger circles in the figure. This additional constraint is similar to the color score defined in Jarrett et al. (2000a). There are some objects with reddest colors and they have the strongest stellar contamination. Their magnitudes were corrected but they should be taken with caution.
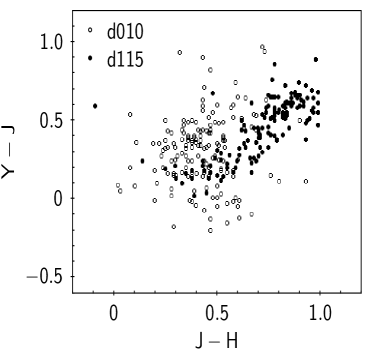
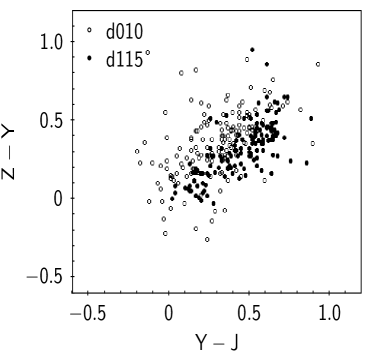
In total, we have 345 and 185 extragalactic candidates detected in the d010 and d115 tiles, respectively. Of them, 193 (in d010 tile) and 43 (in d115 tile) were detected only in J, H and Ks passbands. The others, 152 (in d010 tile) and 142 (in d115 tile) were detected in the 5 passbands. These objects should also satisfy -0.3 (Y - J) 1.0 mag and -0.3 (Z - Y) 1.0 mag. Figure 10 shows the Y - J vs J - H and Z - Y vs Y - J Color-Color Diagrams for these detections in the d010 (d115) tile represented by open (filled) circles.
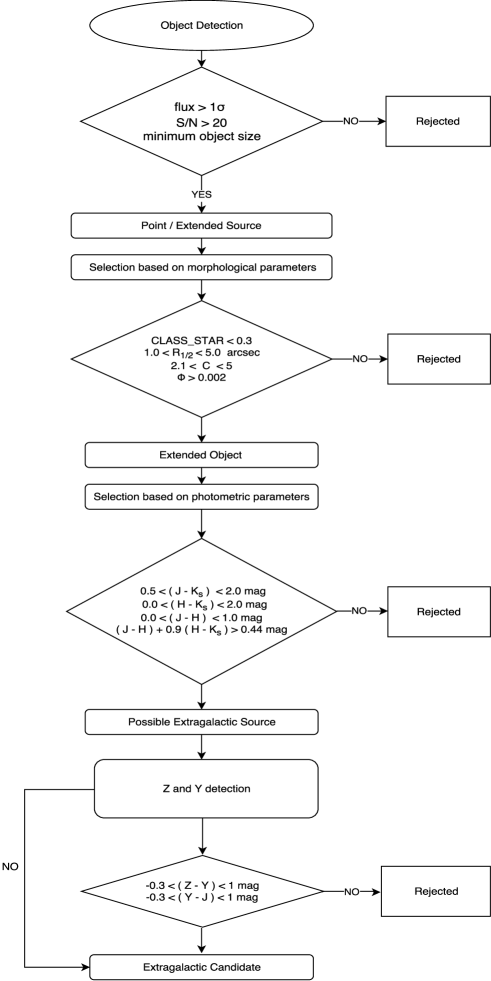
Figure 11 shows a flowchart representing our complete selection algorithm. All the extragalactic candidates were visually checked and confirm the robustness of our adopted selection criteria. They are, in general, extended and widespread in the images and have the reddest colors. We may consider our visual inspection as a lower limit on the reliability of our photometric procedure to detect extragalactic sources. However, it is important to note that the final confirmation of the extragalactic nature is always given by spectroscopic data.
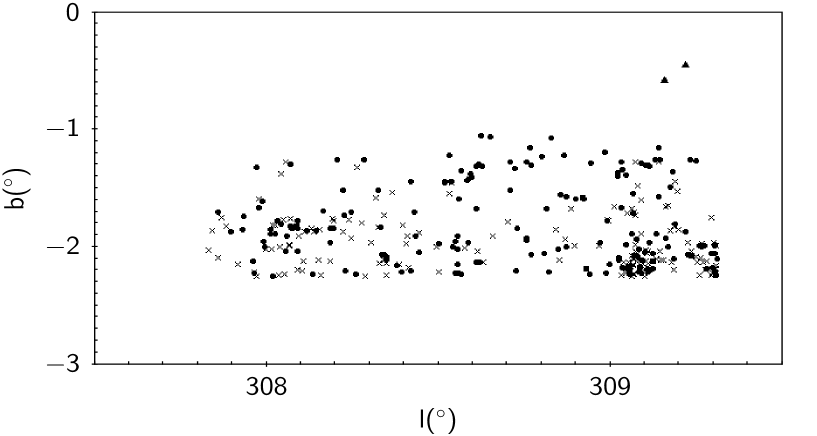
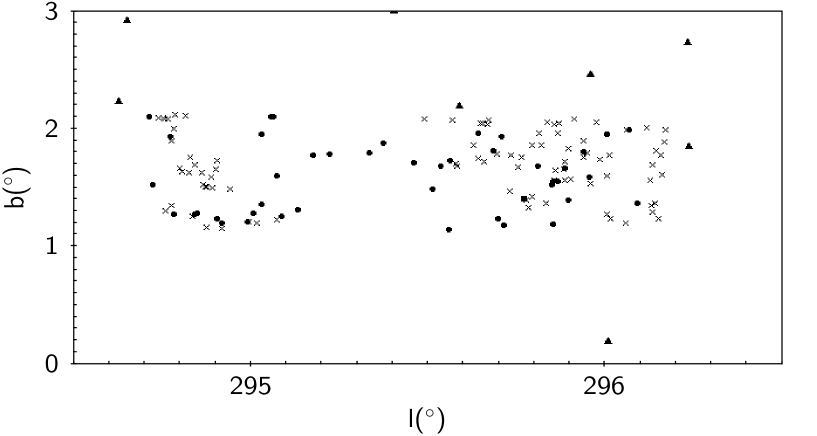
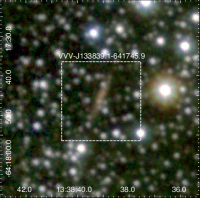
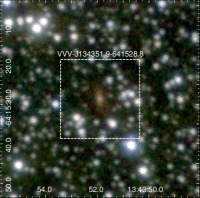
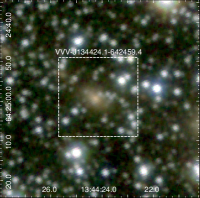
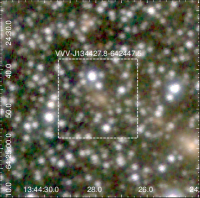
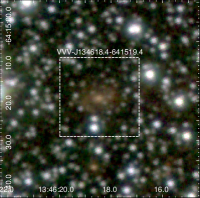
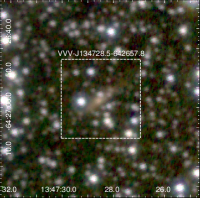
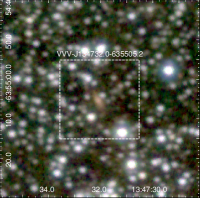
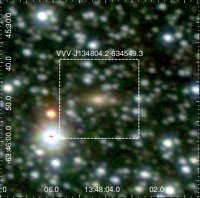
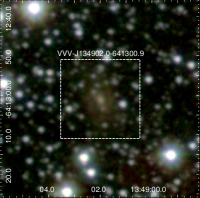
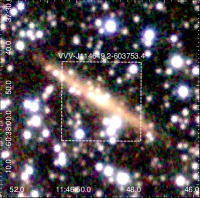
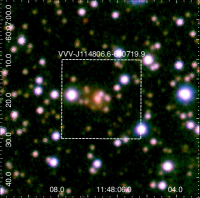
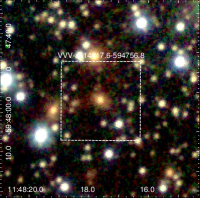
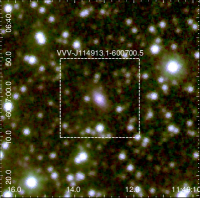
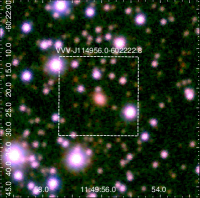
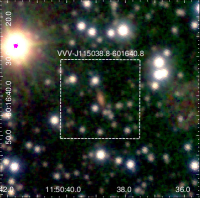
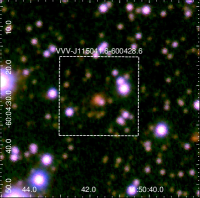
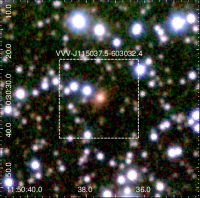
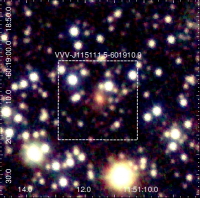
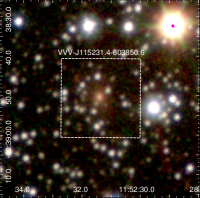
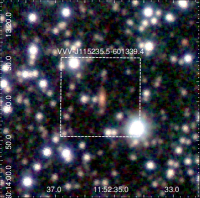
The distribution of the extragalactic candidates in galactic coordinates for the two tiles is shown in Figure 12. We identified with different symbols those detections in three (filled circles) and five (crosses) passbands. The 2MASSX objects in the neighborhood of the studied regions are also included, which reveals the lack of previous studied sources. The two galaxies reported by Staveley–Smith et al. (2016) in the HIZOA-S survey are not included here since they do not have IR counterparts. The photometric catalog of these extragalactic candidates is published in its entirety in machine-readable format. The first 10 sources are shown in Table 1 for guidance regarding form and content. The table gives the identification (column 1), the J2000 coordinates (columns 2 and 3), the PSF Z, Y, J, H and Ks magnitudes and aperture magnitudes within a diameter of 2 arcsec (columns 4 to 13), and the morphological parameters: R1/2, C, ellipticity and spheroid Sersic index (columns 14 to 17). Column 18 includes comments about the object morphology and, if present, the contamination by nearby stars. Some examples of these detections are shown in color composed images in Figure 13.
6 Photometric properties of the extragalactic candidates
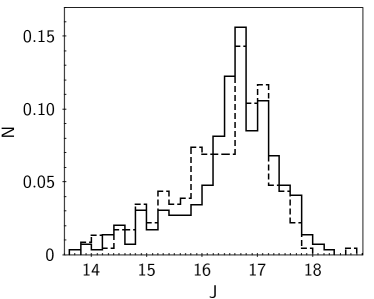
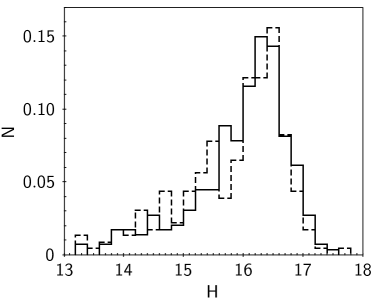
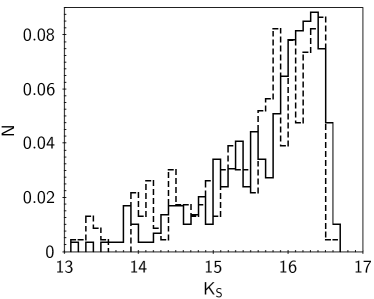
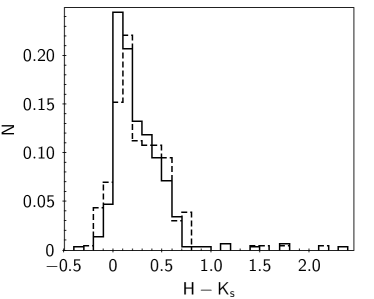
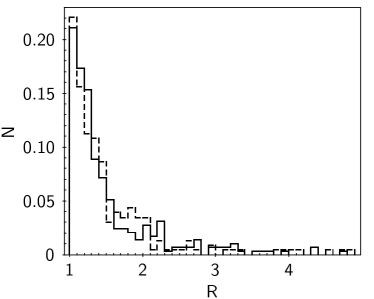
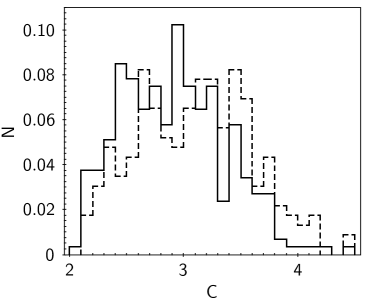
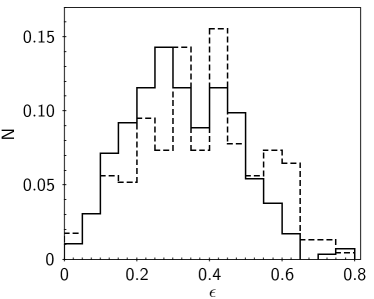
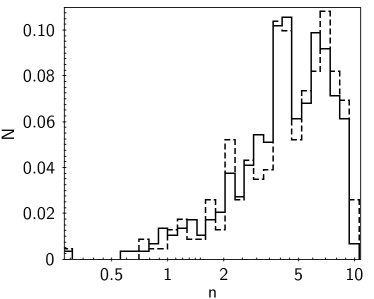
In this section, we analyze general properties of the extragalactic candidates found in the two tiles of the VVV survey. Figure 14 shows the normalized extinction corrected magnitude and (H - Ks) color distributions for these extragalactic candidates. The distributions for the detections in the five passbands (Z, Y, J, H and Ks) are represented with solid lines and those detections in only three passbands (J, H and Ks) with dashed lines. Figure 15 shows the normalized distributions of some of the structural properties: R1/2, C, ellipticity and spheroid n Sersic index (on a logarithmic scale). The histograms are represented as in the previous figure. In general, the two distributions are similar. In the Ks distribution, the detections in the three passbands are slightly shifted towards brighter Ks magnitudes. In the C distribution, there are more detections in the three passbands for C 3.5 and more detections in the five passbands for C 3.5.
In the studied regions, there is no extragalactic sources with IR data coming from other surveys and a direct comparison cannot be made. However, we have IR properties of extended objects behind the MW plane from the studies of HI galaxies as Williams, Kraan-Korteweg & Woudt (2014) and Said et al. (2016b). Their main goal was to perform surface photometry on the star-subtracted images to produce deep near-IR catalogs, 2 magnitudes deeper than 2MASS from HIZOA galaxies. They obtained ellipticities, isophotal magnitudes and extrapolated total magnitudes of 578 galaxies with recession velocities out to 6000 km s-1 (Williams, Kraan-Korteweg & Woudt 2014) and 674 galaxies with confirmed counterparts in the HIZOA catalogs (Said et al. 2016b). Comparing their results with our distributions, our sample of extragalactic sources contains fainter objects than that of late-type galaxies in the HIZOA survey. For ellipticities smaller than 0.3, there is a slight increase of extragalactic sources with five passband detections and, on the contrary, the other distribution has an increase for higher values. Our results are different from Said et al. (2016b), who found similar number of objects with ellipticies between 0.2 to 0.6 but their selection favored late-type galaxies. In general, our sample had smaller and more circular objects, mainly due to the near-IR sensitivity to select more compact objects with higher surface brightness.
Andrews et al. (2014) analyzed three near-IR surveys: 2MASS, UKIDSS and VIKING and made a comparison of some structural measurements, such as the Sersic index. For optical wavelengths, the distribution of the Sersic indices is bimodal (Kelvin et al. 2012), with peaks centered at 1 and 3.5 that correspond to late and early-type galaxies, respectively. The near-IR is more sensitive to the older stellar population in galaxies and the two peaks are less defined as shown in Andrews et al. (2014). The Sersic index distributions found in this study are similar to those of previous analyses. As a conclusion, the extragalactic sources are found, in general, smaller; with R1/2 values having a peak at about 1.3 arcsec; with concentration indices between 2.5 to 3.5; ellipticities ranging from 0.1 to 0.6; and the Sersic index varying from 1 to 7, with a peak around 4. This latter index was mainly associated with bulges with a peak of around 4. Lower n values corresponded to late-types whereas higher values indicated more concentrated objects.
Table 2 summarizes the median values of PSF and aperture near-IR magnitudes, colors, and some structural parameters obtained for the extragalactic sources detected in three and five passbands. In general, these results are similar between the two sets of detections.
7 Comments and Future Plans
The VVV is an ESO near-IR variability survey of the MW, whose goal is to study the stellar objects in the Galaxy, mainly variable stars. This has provided us with the opportunity to search for extragalactic sources that are hidden by the presence of our Galaxy.
Herein, we described our procedure to use the VVV high quality images to search for extended objects and we utilized photometric parameters based on Point-Spread Function fitting photometry. The photometric pipeline is the combination of SExtractor and PSFEx, and was applied for the first time to the tiles d010 and d115 of the survey, thereby obtaining astrometric, photometric and morphological parameters of the detected sources.
Our results for stellar objects were compared with those provided by CASU. On applying the SExtractor+PSFEx combination for the two tiles, we found differences of RA 3 and Dec 8 in the source positions. The magnitude comparison has median differences of J = 0.0040.001 mag, H = -0.0140.001 mag and Ks = 0.0460.001 mag without any dependence on color.
Using SExtractor+PSFEx, we obtained photometric data of the d010 and d115 tiles in the five passbands of the survey: Z, Y, J, H and Ks passbands, which include equatorial coordinates, magnitudes, ellipticities, the half-light radius, fitting model and morphological parameters. In order to define extragalactic candidates, the adopted criteria include the structural parameters , 1.0 R, 2.1 C 5, and . The following color criteria was also added to eliminate false detections: 0.5 (J - Ks) 2.0 mag, 0.0 (J - H) 1.0 mag, 0.0 (H - Ks) 2.0 mag, and (J - H) + 0.9 (H - Ks) 0.44 mag.
Summarizing, 345 extragalactic candidates were found in the d010 tile and 185 in the d115 tile, making a total of 530 sources detected in the J, H and Ks passbands. Some of these sources: 152 (in the d010 tile) and 142 (in the d115 tile) had also detections in Z and Y passbands, or a total of 294 sources. They also satisfied -0.3 (Y - J) 1.0 mag and -0.3 (Z - Y) 1.0 mag. All of these extragalactic candidates were visually inspected and they are confirmed to be galaxies. In general, it is observed a slight increase of the number of extragalactic candidates with five passband detections for ellipticities smaller than 0.3. The opposite is observed for ellipticities higher than 0.3. The R1/2 distribution has a peak at a median value of about 1.3 arcsec and the Sersic index varying from 1 to 7, with a peak around 4. The extragalactic sources found in the two tiles of the VVV survey are, in general, small; more circular and red, mainly due to the near-IR sensitivity to select more compact objects with higher surface brightness.
This is the first paper of a series that defines the methodology to search for extragalactic sources in the VVV survey. We also plan to apply this analysis to other regions of the disk. In this sense, we are analyzing the d015 tile as a galaxy cluster candidate has been identified (Baravalle et al. 2017) and we have obtained spectroscopic data using Flamingos-2 at the Gemini telescope (GS-2016A-FT-18) to establish cluster membership. It would be very useful to be able to confirm the extragalactic nature of other sources through spectroscopic measurements. The new VVV eXtended Survey (VVVX) will cover from −130∘ l +20∘ and contain new northern and southern bulge extensions together with a new northern disk and a large southern disk extensions. The whole VVVX area will be observed using the J, H and Ks passbands, and this will allow us to search for interesting connections in the filaments linked with the GA in order to provide information about the distribution of galaxies in galaxy clusters and filaments in this hidden part of the sky.
ACKNOWLEDGEMENTS
We would like to thank the anonymous referee for the suggestions to improve the manuscript. We would also thank I-Non Chiu for assisting us with the use of the ComEst package and Darío Graña for his technical support. This work was partially supported by grants from the Secretaría de Ciencia y Técnica (Secyt) of Universidad Nacional de Córdoba (UNC) and Consejo de Investigaciones Científicas y Técnicas (CONICET, PIP No. 112-20110101014). LDB acknowledges the financial support for her PhD thesis from Secyt (UNC) and CONICET. JLNC is also grateful for financial support received from the Programa de Incentivo a la Investigación Académica de la Dirección de Investigación de la Universidad de La Serena (PIA-DIULS), Programa DIULS de Iniciación Científica No. PI15142. JLNC also acknowledges the financial support from the GRANT PROGRAM No. FA9550-15-1-0167 of the Southern Office of Aerospace Research and Development (SOARD), a branch of the Air Force Office of the Scientific Research’s International Office of the United States (AFOSR/IO). JCB acknowledges support from programa ESO-Cómite mixto, Gobierno de Chile.
We gratefully acknowledge data from the ESO Public Survey program ID 179.B-2002 taken with the VISTA telescope, and products from the Cambridge Astronomical Survey Unit (CASU). DM is supported by the BASAL Center for Astrophysics and Associated Technologies (CATA) through grant PFB-06, by the Ministry for the Economy, Development and Tourism, Programa Iniciativa Científica Milenio grant IC120009, awarded to the Millennium Institute of Astrophysics (MAS), and by FONDECYT No. 1170121.
References
- Amôres et al. (2012) Amôres, E. B., Sodré, L., Minniti, D., et al. 2012, AJ, 144, 127
- Andrews et al. (2014) Andrews, S. K., Kelvin, L. S., Driver, S. P., & Robotham, A. S. G. 2014, PASA, 31, e004
- Annunziatella et al. (2013) Annunziatella, M., Mercurio, A., Brescia, M., Cavuoti, S., & Longo, G. 2013, PASP, 125, 68
- Arnaboldi et al. (2007) Arnaboldi, M., Gerhard, O., Okamura, S., et al. 2007, PASJ, 59, 419
- Baravalle et al. (2017) Baravalle, L. D., et al. 2017, in preparation
- Beard et al. (1990) Beard, S. M., MacGillivray, H. T., & Thanisch, P. F. 1990, MNRAS, 247, 311
- Bertin & Arnouts (1996) Bertin, E., & Arnouts, S. 1996, A&AS, 117, 393
- Bertin (2011) Bertin, E. 2011, Astronomical Data Analysis Software and Systems XX, 442, 435
- Buta & McCall (1999) Buta, R. J., & McCall, M. L. 1999, ApJS, 124, 33
- Catelan et al. (2011) Catelan, M., Minniti, D., Lucas, P. W., et al. 2011, RR Lyrae Stars, Metal-Poor Stars, and the Galaxy, 5, 145
- Chiu et al. (2016) Chiu, I., Desai, S., & Liu, J. 2016, Astronomy and Computing, 16, 79
- Coldwell et al. (2014) Coldwell, G., Alonso, S., Duplancic, F., et al. 2014, A&A, 569, A49
- Conselice et al. (2000) Conselice, C. J., Bershady, M. A., & Jangren, A. 2000, ApJ, 529, 886
- Dalton et al. (2006) Dalton, G. B., Caldwell, M., Ward, A. K., et al. 2006, Proc. SPIE, 6269, 62690X
- Desai et al. (2012) Desai, S., Armstrong, R., Mohr, J. J., et al. 2012, ApJ, 757, 83
- Durret et al. (2011) Durret, F., Adami, C., Cappi, A., et al. 2011, A&A, 535, A65
- Emerson et al. (2006) Emerson, J., McPherson, A., & Sutherland, W. 2006, The Messenger, 126, 41
- González-Fernández et al. (2017) González-Fernández, C., Hodgkin, S. T., Irwin, M. J., et al. 2017, arXiv:1711.08805
- Henning et al. (2005) Henning, P. A., Kraan-Korteweg, R. C., & Staveley-Smith, L. 2005, Nearby Large-Scale Structures and the Zone of Avoidance, 329, Fairall
- Jarrett et al. (2000) Jarrett, T. H., Chester, T., Cutri, R., et al. 2000a, AJ, 119, 2498
- Jarrett et al. (2000) Jarrett, T. H., Chester, T., Cutri, R., et al. 2000b, AJ, 120, 298
- Kelvin et al. (2012) Kelvin, L. S., Driver, S. P., Robotham, A. S. G., et al. 2012, MNRAS, 421, 1007
- Kilborn et al. (2002) Kilborn, V. A., Webster, R. L., Staveley-Smith, L., et al. 2002, AJ, 124, 690
- Kraan-Korteweg (1999) Kraan-Korteweg, R. C. 1999, The Low Surface Brightness Universe, 170, 103
- Kraan-Korteweg (2000) Kraan-Korteweg, R. C. 2000, A&AS, 141, 123
- Lawrence et al. (2007) Lawrence, A., Warren, S. J., Almaini, O., et al. 2007, MNRAS, 379, 1599
- Lewis et al. (2006) Lewis, J. R., Irwin, M. J., Gonzalez-Solares, E. A., et al. 2006, Astronomical Data Analysis Software and Systems XV, 351, 255
- Mauro et al. (2013) Mauro, F., Moni Bidin, C., Chené, A.-N., et al. 2013, Rev. Mexicana Astron. Astrofis., 49, 189
- McIntyre et al. (2015) McIntyre, T. P., Henning, P. A., Minchin, R. F., Momjian, E., & Butcher, Z. 2015, AJ, 150, 28
- Minniti et al. (2010) Minniti, D., Lucas, P. W., Emerson, J. P., et al. 2010, New A, 15, 433
- Nilo Castellón et al. (2014) Nilo Castellón, J. L., Alonso, M. V., García Lambas, D., et al. 2014, MNRAS, 437, 2607
- Ramatsoku et al. (2016) Ramatsoku, M., Verheijen, M. A. W., Kraan-Korteweg, R. C., et al. 2016, MNRAS, 460, 923
- Rowe et al. (2015) Rowe, B. T. P., Jarvis, M., Mandelbaum, R., et al. 2015, Astronomy and Computing, 10, 121
- Said et al. (2016) Said, K., Kraan-Korteweg, R. C., Staveley-Smith, L., et al. 2016a, MNRAS, 457, 2366
- Said et al. (2016) Said, K., Kraan-Korteweg, R. C., Jarrett, T. H., Staveley-Smith, L., & Williams, W. L. 2016b, MNRAS, 462, 3386
- Saito et al. (2012) Saito, R. K., Minniti, D., Dias, B., et al. 2012, A&A, 544, A147
- Schlafly & Finkbeiner (2011) Schlafly, E. F., & Finkbeiner, D. P. 2011, ApJ, 737, 103
- Sersic (1968) Sersic, J. L. 1968, Cordoba, Argentina: Observatorio Astronomico, 1968
- Skrutskie et al. (2006) Skrutskie, M. F., Cutri, R. M., Stiening, R., et al. 2006, AJ, 131, 1163
- Staveley-Smith et al. (2016) Staveley-Smith, L., Kraan-Korteweg, R. C., Schröder, A. C., et al. 2016, AJ, 151, 52
- Stetson (1987) Stetson, P. B. 1987, PASP, 99, 191
- Stetson (1994) Stetson, P. B. 1994, PASP, 106, 250
- Tody (1993) Tody, D. 1993, Astronomical Data Analysis Software and Systems II, 52, 173
- Tully & Fisher (1977) Tully, R. B., & Fisher, J. R. 1977, A&A, 54, 661
- Varela et al. (2009) Varela, J., D’Onofrio, M., Marmo, C., et al. 2009, A&A, 497, 667
- Williams et al. (2014) Williams, W. L., Kraan-Korteweg, R. C., & Woudt, P. A. 2014, MNRAS, 443, 41
- Woudt & Kraan-Korteweg (2001) Woudt, P. A., & Kraan-Korteweg, R. C. 2001, A&A, 380, 441

| Id. | RA (J2000) | Dec (J2000) | Z | Y | J | H | Ks | Z2′′ | Y2′′ | J2′′ | H2′′ | Ks2′′ | R1/2 | C | n | Notes | |
|---|---|---|---|---|---|---|---|---|---|---|---|---|---|---|---|---|---|
| VVV-J114419.03-603025.9 | 11:44:19.03 | -60:30:25.9 | 15.86 | 15.85 | 15.76 | 15.30 | 15.02 | 15.96 | 15.94 | 15.77 | 15.19 | 15.06 | 2.46 | 3.54 | 0.14 | 3.97 | |
| VVV-J114428.39-603158.4 | 11:44:28.39 | -60:31:58.4 | - | - | 17.17 | 17.00 | 16.44 | - | - | 17.14 | 16.91 | 16.46 | 1.03 | 2.34 | 0.50 | 7.38 | |
| VVV-J114431.78-601626.8 | 11:44:31.78 | -60:16:26.8 | - | - | 16.81 | 16.34 | 16.27 | - | - | 16.82 | 16.35 | 16.25 | 1.25 | 3.34 | 0.10 | 7.18 | |
| VVV-J114433.70-602742.8 | 11:44:33.70 | -60:27:42.8 | 16.82 | 16.78 | 16.63 | 16.20 | 16.11 | 16.83 | 16.77 | 16.65 | 16.13 | 16.08 | 1.09 | 2.56 | 0.18 | 4.12 | |
| VVV-J114450.83-603356.9 | 11:44:50.83 | -60:33:56.9 | 17.18 | 17.02 | 16.75 | 16.22 | 16.06 | 17.16 | 16.97 | 16.80 | 16.13 | 16.05 | 2.20 | 3.65 | 0.43 | 8.36 | |
| VVV-J114456.52-603249.6 | 11:44:56.52 | -60:32:49.6 | - | - | 16.56 | 16.02 | 15.86 | - | - | 16.60 | 15.96 | 15.89 | 1.25 | 2.46 | 0.35 | 2.64 | |
| VVV-J114457.91-603958.3 | 11:44:57.91 | -60:39:58.3 | 17.80 | 17.76 | 17.60 | 17.31 | 16.43 | 17.77 | 17.76 | 17.57 | 17.32 | 16.40 | 2.51 | 3.09 | 0.42 | 4.90 | |
| VVV-J114458.73-603252.1 | 11:44:58.73 | -60:32:52.1 | - | - | 16.57 | 15.83 | 15.45 | - | - | 16.61 | 15.88 | 15.50 | 1.23 | 2.51 | 0.42 | 1.99 | 1 |
| VVV-J114516.94-604110.3 | 11:45:16.94 | -60:41:10.3 | 17.39 | 17.05 | 16.71 | 16.16 | 16.09 | 17.32 | 17.05 | 16.73 | 16.12 | 16.12 | 1.02 | 2.43 | 0.33 | 3.74 | |
| VVV-J114520.81-603555.3 | 11:45:20.81 | -60:35:55.3 | - | - | 16.86 | 16.3 | 15.77 | - | - | 16.78 | 16.11 | 15.73 | 1.34 | 2.79 | 0.47 | 4.49 | |
| ††footnotetext: 1. galaxy pair ††footnotetext: 2. late-type galaxy: elongated shape ††footnotetext: 3. late-type galaxy: with spiral arms ††footnotetext: 4. early-type galaxy: bright elliptical galaxy ††footnotetext: 5. star near the galaxy nucleus |
| Parameter | JHKs detections | ZYJHKs detections |
| Z [mag] | – | 17.29 0.06 |
| Y [mag] | – | 16.99 0.05 |
| J [mag] | 16.51 0.04 | 16.63 0.05 |
| H [mag] | 16.05 0.03 | 16.16 0.05 |
| Ks [mag] | 15.79 0.03 | 15.94 0.04 |
| (Z - Y) [mag] | – | 0.340 0.013 |
| (Y - J) [mag] | – | 0.380 0.012 |
| (J - H) [mag] | 0.530 0.015 | 0.540 0.015 |
| (J - Ks) [mag] | 0.740 0.024 | 0.730 0.019 |
| (H - Ks) [mag] | 0.260 0.015 | 0.200 0.015 |
| R1/2 [arcsec] | 1.31 0.03 | 1.28 0.04 |
| C | 3.13 0.03 | 2.91 0.03 |
| 0.370 0.004 | 0.320 0.008 | |
| n | 4.60 0.16 | 4.45 0.13 |