ALMA detection of extended [CII] emission in Himiko at z=6.6
Abstract
Himiko is one of the most luminous Ly emitters at . It has three star forming clumps detected in the rest-frame UV, with a total SFR = 20M⊙ yr-1. We report the ALMA detection of the [Cii]158m line emission in this galaxy with a significance of 9. The total [CII] luminosity (L[CII]= L⊙) is fully consistent with the local L[CII]-SFR relation. The ALMA high-angular resolution reveals that the [Cii] emission is made of two distinct components. The brightest [Cii] clump is extended over 4 kpc and is located on the peak of the Ly nebula, which is spatially offset by 1 kpc relative to the brightest UV clump. The second [Cii] component is spatially unresolved (size 2 kpc) and coincident with one of the three UV clumps. While the latter component is consitent with the local L[CII]-SFR relation, the other components are scattered above and below the local relation. We shortly discuss the possible origin of the [CII] components and their relation with the star forming clumps traced by the UV emission.
Subject headings:
galaxies: formation — galaxies: high-redshift — infrared: ISM — galaxies: evolution1. Introduction
One of the key science goals of the Atacama Large Millimitre/submillimetre Array (ALMA) is the detection and investigation of star-forming galaxies in the early Universe through the observations of the far-infrared (FIR) lines. In particular, ALMA observations of the strongest FIR lines, such as the [Cii]158m and [Oiii]88m, allow us to probe the properties of the interstellar medium (ISM) in galaxies at (e.g. Maiolino et al., 2015; Pentericci et al., 2016; Carniani et al., 2017; Inoue et al., 2016; Matthee et al., 2017; Smit et al., 2017), which are responsible for cosmic reionisation.
The [Cii] () transition at 157.74 m is one of the dominant coolants of the ISM. The [Cii] emission can be excited by the UV radiation field, produced by young stars, in photodissociation regions (associated with neutral atomic and molecular gas), but is also associated with partly ionized gas. Therefore, this transition can be used as tracer of on-going star-formation in local and distant galaxies (e.g. De Looze et al., 2014; Vallini et al., 2015; Herrera-Camus et al., 2015).
In the last five years ALMA observations targeting the [Cii] line emission in “normal” star-forming galaxies (with SFR = 3-100 M⊙ yr-1) have yielded a variety of results (Ouchi et al., 2013; Ota et al., 2014; Willott et al., 2015; Maiolino et al., 2015; Pentericci et al., 2016; Bradač et al., 2016; Knudsen et al., 2016; Matthee et al., 2017; Smit et al., 2017). The L[CII]-SFR relation observed in these high- systems seems to have an intrinsic dispersion larger than that observed in the local Universe, which probably results from the wide range of global properties characterising primeval galaxies (Vallini et al., 2015; Matthee et al., 2017; Lagache et al., 2017, Carniani et al. in prep.) The properties of the [Cii] emission are even more puzzling in luminous Ly emitters (LAEs), in which the [Cii] emission is very faint or not detected (Ouchi et al., 2013; Ota et al., 2014; Willott et al., 2015; Schaerer et al., 2015), placing these sources below the L[CII]-SFR relation found in the local Universe (De Looze et al., 2014). Simulations and models have attempted to explain this [Cii] deficit by taking into account the low metal content in high- galaxies, the excitation by the CMB radiation, and the effect of galactic expelling large amounts of gas (Vallini et al., 2013, 2015; Pallottini et al., 2017a, b). However, Matthee et al. (2017) have recently reported the [Cii] detection in the most luminous LAE at , CR7, making the scenario even more complex. Indeed CR7 has a SFR=40 M⊙ yr-1, which is comparable to the other previous LAEs showing a [Cii] deficit, but its [Cii] luminosity places this galaxy along the local SFR-[Cii] relation.
In this letter, we re-analyse archival ALMA [Cii] observations of Himiko, one of the most famous LAE, at (Ouchi et al., 2009). Himiko is located in the Ultra Deep South field. Its Ly nebula has a luminosity erg/s and extends over 17 kpc. The redshift of the source was spectroscopically confirmed trough Keck/DEIMOS and VLT/Xshooter observations of the Ly (Ouchi et al., 2013; Zabl et al., 2015). Hubble Space Telescope (HST) observations with WFC3 in bands J125 and H160 (rest-frame UV at ) show that Himiko comprises of three bright clumps, A, B and C (Figure 1) with similar UV magnitudes. Clumps A and B are separated by a projected distance of 6.4 kpc, while the other two clumps have a separation of 2.5 kpc (Zabl et al., 2015). The Ly emission nebula embeds all the tree clumps, but its peak is located between clumps A and B (Ouchi et al., 2013). The first ALMA observations aimed at detecting [Cii] emission in Himiko system were obtained in Cycle 0 and presented in Ouchi et al. (2013), who reported a non detection for this galaxy placing an upper limit for the [Cii] luminosity at L[CII] L⊙. Himiko was also observed with ALMA in Cycle 1 but the analysis of these new observations have not been published so far.
In this paper we present an analysis of both Cycle 0 and Cycle 1 data. When combined together, we show that such data present a clear detection of [Cii] with a luminosity expected by the local [Cii]-SFR relation, and also present a clumpy morphology relative to the UV distribution.
Throughout this paper we adopt the standard cosmological parameters km s-1 Mpc-1 , , = 0.70, according to which 1 arcsec at = 6.7 corresponds to a proper distance of 6.48 kpc. Astronomical coordinates and magnitude are given in the J2000 epoch and AB system, respectively.
2. Observation and data reduction
Himiko was observed with ALMA in band 6 in July 2012 and July 2015 as part of the programs #2011.0.00115.S (Cycle 0) and #2012.1.00033.S (Cycle 1). The former program was carried out by using a semi-compact array configuration with 25 12-m antennae and with a maximum baseline length of 440 m. An extended-array configuration was instead used for Cycle-1 observations, with 44 12-m antennae and baseline lengths up to 1600 m. The total on-source integration time was 3.2h for both programs. The perceptible water vapour ranged between 1.1 and 2.7 mm. Both observations were performed in frequency division mode with a total bandwidth of 7.5 GHz and a spectral resolution of 0.488 kHz (0.5 km/s). One of the four spectral windows (each 1.875 GHz Wide) was set to the expected frequency of the [Cii] line at (=250.24 GHz).
The absolute flux scale was established by observations of Callisto, Neptune, Ceres, and J0238+166. While 3C454.3, J2357-5311, J0423-0120, J2357-5311, and J0334-4008 were observed as bandpass calibrators. The phase calibration was based on the observations of J0423-013, J028-0047 and J2357-5311.
The two datasets have been calibrated by using the standard scripts for ALMA reduction corresponding to the release data of the observations. We used the software CASA (McMullin et al., 2007) version 3.4.0 and 4.7.2 respectively for the two datasets. For each dataset we have generated the continuum map from the line-free channels and cubes with spectral channels of 5 km/s by using the CASA task clean with a natural weighting. The resulting sensitivities and angular resolution of the continuum map and cubes are listed in Table 1. We note that the sensitivities and angular resolution of the final images obtained from the Cycle-0 dataset are in agreement with those presented by Ouchi et al. (2013).
We have also combined the observations of both programs to obtain maps and cubes with higher sensitivity. The imaging of the combined dataset has been performed by using CASA version 4.7.2 and natural weighting, achieving a continuum sensitivity of 9 Jy/beam and an angular resolution of 0.30″ at the observed frequency of [Cii]. To optimise the signal-to-nose ratio (S/N) of the [Cii] detection, we have produced a spatially smoothed cube using a uv tapering of 0.2″ so to recover the spatially extended emission. We report the properties of combined and smoothed images in Table 1.
We have registered the ALMA and HST data by matching ALMA calibrator and foreground sources to the GAIA Data Release 1 catalogue (Gaia Collaboration et al., 2016).
| dataset | ton | antennae | beam | ||
| [h] | [Jy] | [Jy] | |||
| (a) | (b) | (c) | (d) | (e) | |
| 2011.0.00115.S | 3.2 | 25 | 0.81″0.57″ | 17 | 130 |
| 2012.1.00033.S | 3.2 | 44 | 0.28″0.22″ | 11 | 98 |
| combined | 6.4 | 44 | 0.39″0.31″ | 9 | 88 |
| combined and uv-tapered | 6.4 | 44 | 0.48″0.40″ | 11 | 101 |
| Notes: (a) On-source exposure time. (b) Number of antennae. (c) Angular resolution. (d) Continuum sensitivity at 158 m. (e) Sensitivity in a spectral channel of 100 km/s. | |||||
3. Results
3.1. Continuum emission at 158m
The dust continuum emission at 158m () is not detected, indicating a low dust mass content, as already discussed by Ouchi et al. (2013). We estimate a 3 upper limit on the continuum emission Jy that results into an upper limit on the infrared luminosity , if assuming grey-body emission with a dust temperature of 35 K and a spectral emissivity index of 1.5 (Ota et al., 2014; Schaerer et al., 2015; Willott et al., 2015). If we assume the relation presented in Kennicutt & Evans (2012), the infrared luminosity translates into an upper limit on the dust obscured . We note that such upper limit on is about four times lower than the total inferred from the rest-frame UV emission (see Table 2), indicating that most of the star formation is unobscured by dust.
3.2. [CII] line emission
(a)
 (b)
(b)
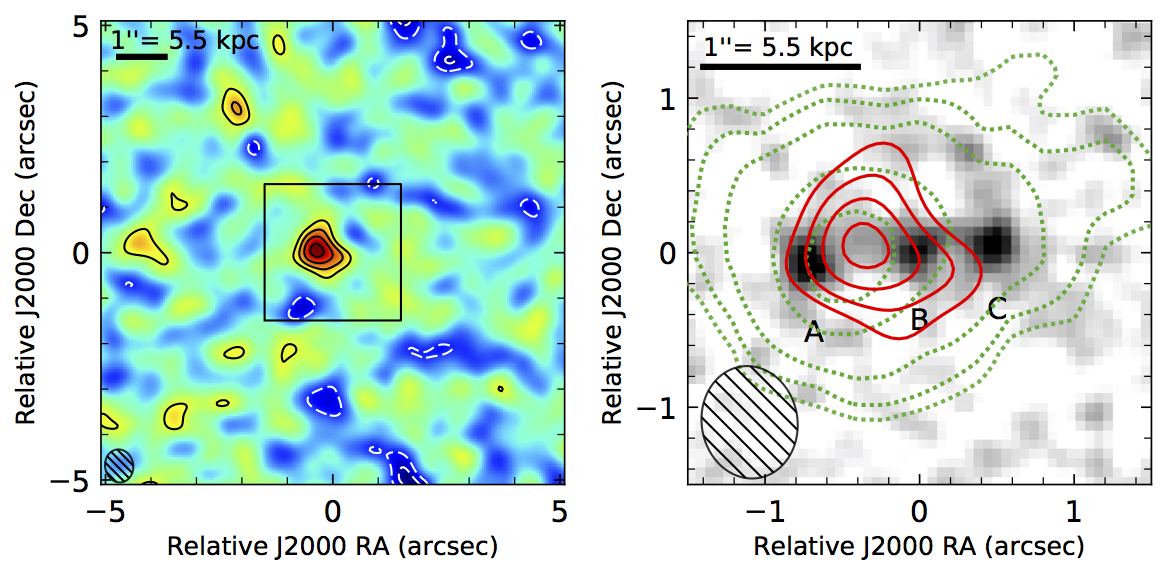
We detect an emission line consistent with the [Cii] emission at the redshift and at the location of Himiko in the combined uv-tapered ALMA cube. Figure 1a shows the map of the line extracted with a spectral width of 270 km/s and centred at -185 km/s relative to the redshift inferred by Ly, . The peak of the [Cii] emission has a significance of 5.5 and is located between the UV clumps A and B. However, the [Cii] emission is spatially resolved, hence the significance of the total emission is higher than the peak flux in the map and specifically, as we will see below, the total significance is 9. The distribution of the [Cii] emission has a beam-deconvolved size of , which corresponds to a physical size of , embedding both UV clumps A and B.
The reliability of the [Cii] detection is also supported by the fact that the line is marginally detected at the same location in the two individual datasets. More specifically, in the Cycle-0 data the peak of the [Cii] emission is detected with a S/N=4.2 and a flux level ( mJy km/s) consistent with the value observed in the combined cube. The peak of the [Cii] emission is only marginally detected with S/N=3.2 ( mJy km/s) in the Cycle-1 observations. The lower significance in the Cycle 1 data is due to the high angular resolution of these data (7.6 and 3.1 times higher than that of the Cycle-0 and uv-tapered combined cube, respectively). Indeed, although the Cycle-1 dataset has a sensitivity higher than that of Cycle-0, the diffuse emission is resolved out in the extended-array configuration observations and a fraction () of the total [Cii] emission is missed. A similar scenario has already been reported by Carniani et al. (2017) for the ALMA observations of the star-forming galaxy BDF-3299, where the bulk of the emission is ascribed diffuse gas extended on scales larger than 1 kpc and the new high-angular resolution observations have revealed only of the total [Cii] emission.
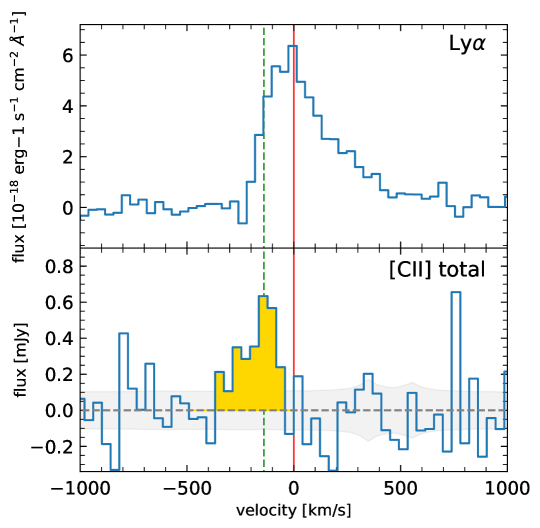
Since the emission is resolved, we extract the [Cii] spectrum over a region within the [Cii] contours shown in Figure 1a. The resulting spectrum, with a spectral rebinning of 40 km/s, is presented in Figure 1b, together with the optical spectrum of the Ly line obtained from X-shooter observations (Zabl et al., 2015). The line is offset by km/s relative to the and has a line width of km/s. The velocity offsets between Ly and [Cii] emission is similar to those estimated in other high- [Cii]-emitting sources observed with ALMA (Maiolino et al., 2015; Pentericci et al., 2016; Matthee et al., 2017). While the [Cii] line is a good tracer of the systemic velocity of galaxies in the early Universe, the Ly profile is affected by intergalactic medium (IGM) absorption; galactic outflows can also shift the peak of the line by up to few hundred km/s. Zabl et al. (2015) discuss that the strong blue asymmetry of the Ly profile is likely associated with the ISM/IGM absorption and, therefore, its centroid/peak results into an apparent redshift slightly higher than the systemic systemic redshift estimated from [Cii], but fully consistent once the Ly asymmetry is taken into account.
The integrated intensity of the [Cii] line is mJy km/s. The resulting [Cii] luminosity 108 L⊙, which is about two times higher than the upper limit estimated by Ouchi et al. (2013). This tension can be explained with the fact that, not having a priori knowledge on the location of the [Cii] emission (spatially and spectrally) Ouchi et al. (2013) extracted an upper limit with an arbitrary line width and not taking into account fluctuations which may have been potentially associated with a real signal. This issue may be common also to other [Cii] non-detections in the literature, in the sense that some of the upper limits estimated in the past may be too low.
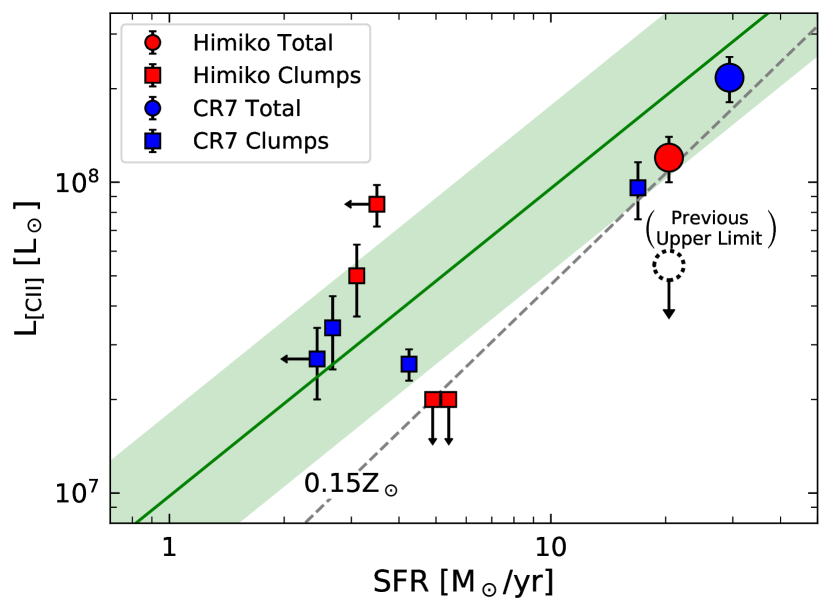
The measured [Cii] luminosity is comparable to those measured in some other star-forming galaxies with similar SFRUV. In particular it is akin to the L[CII] observed in the CR7 (Matthee et al., 2017), which is a LAE with properties similar to Himiko (MUV = -21.2, SFR = 44M⊙ yr-1). In contrast to previous claims, our detection places Himiko along the local L[CII]-SFR given by De Looze et al. (2014), as illustrated in Fig.2.
Recent cosmological simulations by Vallini et al. (2015) and Olsen et al. (2017) show that at fixed SFR the [Cii] luminosity in galaxies decreases with the decreasing of the metallicity content. By using their best-fit relations we obtain a rough estimate of gas metallicity for Himiko of , which is in line with that obtained from the spectral-energy-distribution fitting (; Zabl et al., 2015).
| Himiko | |||||
| Total | Clump A | A[CII] (Ly peak) | Clump B (B[CII]) | Clump C | |
| RA [J2000] | - | 2:17:57.61 | 2:17:57.59 | 2:17:57.57 | 2:17:57.53 |
| DEC [J2000] | - | -5:08:44.96 | -5:08:44.77 | -5:08:44.87 | -5:08:44.82 |
| 6.595 | 6.595 | 6.595 | 6.595 | 6.595 | |
| [Å] | |||||
| - | - | ||||
| [km/s] | - | - | |||
| - | - | ||||
| ‡ | |||||
| ‡ | |||||
| [Cii] size [kpc] | - | - | |||
| Note: The upper limits on the [Cii] emission are estimated by assuming a km/s. | |||||
3.3. Multi-component system
Given the multi-clump shape of Himiko in the rest-frame UV images and the extended [Cii] emission detected in the smoothed ALMA observations, in this section we investigate the morphology of [Cii] emission and its connection with the UV and Ly counterparts.
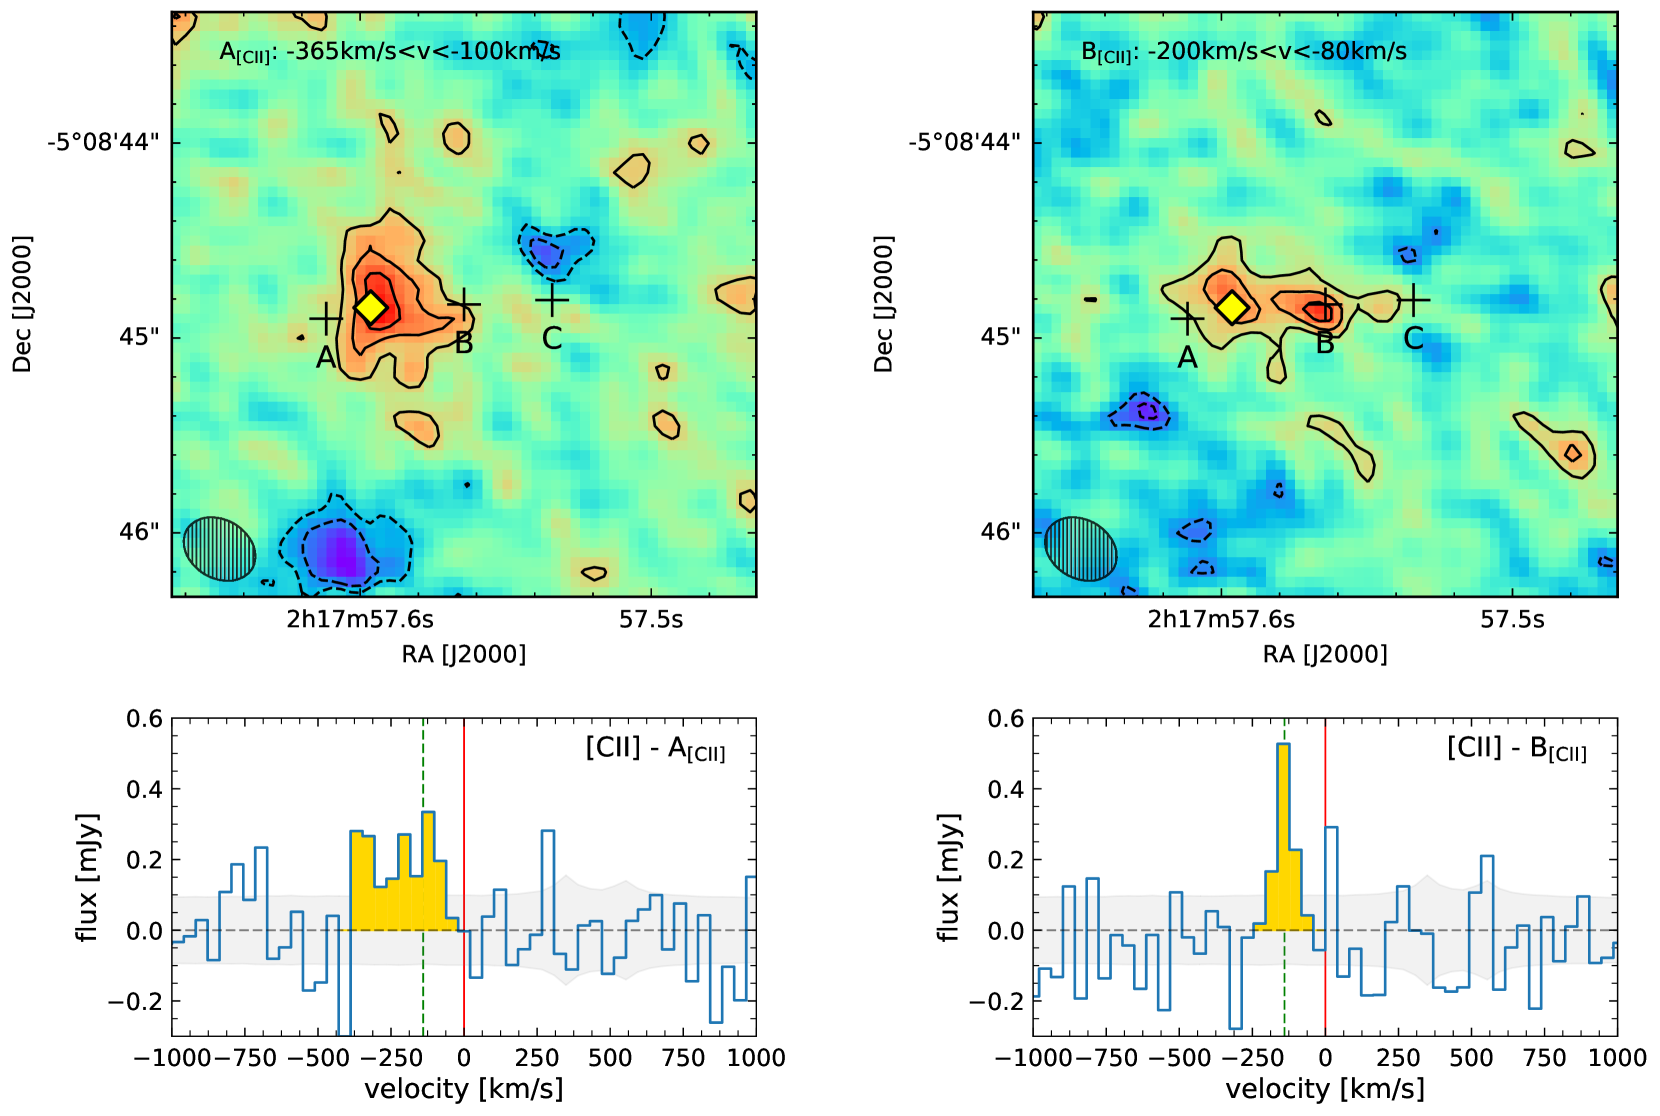
A channel map analysis performed on the non-smoothed combined cube, which has an angular resolution of 0.39″0.31″, reveals that the extended [Cii] emission discussed in the previous Section is the result of two distinct components, which will be referred to as A[CII] and B[CII]. The flux maps and spectra of these two components are shown in Figure 3.
We identify the component A[CII] with a S/N=5 in the channel map from -100 km/s to -365 km/s. The centroid of the emission is spatially offset by 0.2″ toward the West relative to the UV position of the (brightest) clump-A, but it is fully consistent with the peak of the extended Ly nebula observed by Ouchi et al. (2013) (yellow diamond in Fig.3). We exclude that this [Cii] component is directly associated with the UV clump A since the [Cii] emission level at the location of the UV emission is lower than . As we will discuss later, positional offsets between UV and FIR line emission are not so rare in primeval galaxies (Maiolino et al., 2015; Willott et al., 2015; Carniani et al., 2017). By fitting a 2D elliptical Gaussian profile to the channel map, we find that the [Cii] emission of component A[CII] is spatially resolved with a beam-deconvolved size of , which corresponds to a physical size of kpc. The [Cii] profile peaks at km/s and has a line width of km/s. We measure L[CII] L⊙ that corresponds to the 70% of the total [Cii] luminosity inferred for Himiko.
The other component, B[CII], peaks at km/s and is narrower ( FWHM = km/s) than the former component. The knot of the [CII] emission is co-aligned with the UV position of clump-B, indicating that [CII] and UV emission arise from the same region. Since components B[CII] and A[CII] overlap in velocity, the flux map B[CII] shows also a tail emission extending to the west that is assocaited with the A[CII] component. The core of the B[CII] emission is not spatially resolved indicating the the [Cii] line is powered by a compact source with physical size kpc. For this component we infer a [Cii] luminosity L[CII] L⊙.
Since around the Ly redshift we do not detect any emission close to the UV clumps A and C, we search for line emission in the ALMA cube between -1000 km/s and 1000 km/s relative to the redshift of Ly and with level of significance . Only a putative detection is found at km/s and located at the UV position of the clump C. Because of the low significance (S/N=3.2), the emission can be spurious due to noise fluctuation, hence we consider it as a non detection. For the two UV clumps A and C, we therefore infer an upper limit on the [Cii] luminosity L[CII] L⊙ where we assume a line width of 100 km/s.
We note that while the [Cii] emission in clump is fully consistent with the local L[CII]–SFR relation, clumps A, C and A[CII] are scattered outside the local relation (Figure 2), as observed in other high- galaxies (e.g. Maiolino et al., 2015).
As discussed in Carniani et al. (2017), positional offsets between UV and [Cii] emission may be ascribed to spatially distinct regions of the galaxy, and of their circumgalactic environment, characterised by different physical properties. For instance, the low [Cii] luminosity at the location of the UV regions can be interpreted as a consequence of a local low metal enrichment level in these star-forming regions, but also in terms of strong feedback ionizing or expelling gas (Vallini et al., 2015; Katz et al., 2016; Olsen et al., 2017). Spatially-offset [Cii] emission may also be explained in terms of dust obscuration and/or outflowing/inflowing gas. In the former scenario [Cii] is excited in-situ by star-formation whose UV emission is heavily dust-obscured. In this context we note that Ouchi et al. (2013) infer a dust attenuation for Himiko of E(B-V)=0.15, which can hide a significant fraction of star forming regions traced by the UV emission. On the other hand, the spatially-offset [Cii] can be associated to a satellite clumps in the process of accreting, or clumps expelled by galactic outflows; in these cases the [Cii] emission is excited by the UV radiation of the closest star-formation region (e.g. clump A). This last scenario is also supported by the fact that Himiko reveals a triple major merger event whose extended Ly nebula emission may be powered by both star formation and galactic winds (Ouchi et al., 2013; Zabl et al., 2015).
In summary UV and [Cii] emission can trace different regions that should be treated as different sub-components of the same system. A detailed discussion of multiple sub-components observed in star-forming galaxies, as well as their offset relative to the star forming regions traced by the UV emission, is presented in a companion paper (Carniani et al. in prep.).
4. Conclusions
We have presented the analysis of archival ALMA data targeting the [Cii] emission in the famous and luminous LAE Himiko, at . We have detected the FIR line with a level of significance of 9 for the total, spatially integrated emission.
The measured luminosity of the line (L[CII] L⊙) is fully consistent with the local L[CII]-SFR relation, thereby mitigating the discrepancy with the local L[CII]-SFR relation claimed in previous studies.
The ALMA data reveal that the [Cii] profile is blueshifted by -145 km/s relative to the peak of Ly, consistent with the fact that the asymmetric, blueward profile of Ly is associated with absorption by the neutral intergalactic medium.
The [Cii] emission is spatially resolved over kpc and breaks into two sub-components. The location of the faintest [Cii] component (which is spatially unresolved) is consistent with the UV emission of clump B, which is the central UV clump out of the three associated with Himiko. Instead, the brightest [Cii] component is spatially extended (over 4 kpc) and its centroid is coincident with the peak of the Ly nebula, and is spatially offset by (1kpc) relative to the nearest (and brightest) UV clump. While the [Cii] luminosity of clump B is fully consistent with the local L[CII]-SFR relation, all other clumps are scattered around the local relation, both above and below.
As already discussed in other works, the offsets between [Cii] and UV emission, and the multi-clump nature of the [Cii] emission, are likely associated with various effects, such as dust obscuration (preventing the detection of UV associated with [Cii] emission), strong feedback (ionizing or removing gas in intense star forming regions), minor/major mergers and circumgalactic accreting/outflowing gas. A more extensive discussion of the multicomponent [Cii] properties of high- galaxies, their morphologies and offsets relative to the UV emission, is presented in a more extensive paper, discussing several more galaxies at , in a companion paper (Carniani et al. in prep.).
Finally, we note that the previous works had not detected the [Cii] line in Himiko, giving an upper limit a factor of two lower than our detection. This is due to the difficulty of properly estimating the upper limit without prior knowledge about the location, redshift and width of the [Cii] emission. This issue may affect also other past results; in particular, past upper limits on the [Cii] emission in other high-z galaxies may be too low.
References
- Bradač et al. (2016) Bradač, M., Garcia-Appadoo, D., Huang, K.-H., et al. 2016, ArXiv e-prints, arXiv:1610.02099
- Carniani et al. (2017) Carniani, S., Maiolino, R., Pallottini, A., et al. 2017, A&A, 605, A42
- De Looze et al. (2014) De Looze, I., Cormier, D., Lebouteiller, V., et al. 2014, A&A, 568, A62
- Gaia Collaboration et al. (2016) Gaia Collaboration, Brown, A. G. A., Vallenari, A., et al. 2016, A&A, 595, A2
- Herrera-Camus et al. (2015) Herrera-Camus, R., Bolatto, A. D., Wolfire, M. G., et al. 2015, ApJ, 800, 1
- Inoue et al. (2016) Inoue, A. K., Tamura, Y., Matsuo, H., et al. 2016, Science, 352, 1559
- Katz et al. (2016) Katz, H., Kimm, T., Sijacki, D., & Haehnelt, M. 2016, ArXiv e-prints, arXiv:1612.01786
- Kennicutt & Evans (2012) Kennicutt, R. C., & Evans, N. J. 2012, ARA&A, 50, 531
- Knudsen et al. (2016) Knudsen, K. K., Richard, J., Kneib, J.-P., et al. 2016, ArXiv e-prints, arXiv:1603.02277
- Lagache et al. (2017) Lagache, G., Cousin, M., & Chatzikos, M. 2017, ArXiv e-prints, arXiv:1711.00798
- Maiolino et al. (2015) Maiolino, R., Carniani, S., Fontana, A., et al. 2015, MNRAS, 452, 54
- Matthee et al. (2017) Matthee, J., Sobral, D., Boone, F., et al. 2017, ArXiv e-prints, arXiv:1709.06569
- McMullin et al. (2007) McMullin, J. P., Waters, B., Schiebel, D., Young, W., & Golap, K. 2007, in Astronomical Society of the Pacific Conference Series, Vol. 376, Astronomical Data Analysis Software and Systems XVI, ed. R. A. Shaw, F. Hill, & D. J. Bell, 127
- Olsen et al. (2017) Olsen, K., Greve, T. R., Narayanan, D., et al. 2017, ApJ, 846, 105
- Ota et al. (2014) Ota, K., Walter, F., Ohta, K., et al. 2014, ApJ, 792, 34
- Ouchi et al. (2009) Ouchi, M., Mobasher, B., Shimasaku, K., et al. 2009, ApJ, 706, 1136
- Ouchi et al. (2013) Ouchi, M., Ellis, R., Ono, Y., et al. 2013, ApJ, 778, 102
- Pallottini et al. (2017a) Pallottini, A., Ferrara, A., Bovino, S., et al. 2017a, MNRAS, 471, 4128
- Pallottini et al. (2017b) Pallottini, A., Ferrara, A., Gallerani, S., et al. 2017b, MNRAS, 465, 2540
- Pentericci et al. (2016) Pentericci, L., Carniani, S., Castellano, M., et al. 2016, ArXiv e-prints, arXiv:1608.08837
- Schaerer et al. (2015) Schaerer, D., Boone, F., Jones, T., et al. 2015, A&A, 576, L2
- Smit et al. (2017) Smit, R., Bouwens, R. J., Carniani, S., et al. 2017, ArXiv e-prints, arXiv:1706.04614
- Vallini et al. (2013) Vallini, L., Gallerani, S., Ferrara, A., & Baek, S. 2013, MNRAS, 433, 1567
- Vallini et al. (2015) Vallini, L., Gallerani, S., Ferrara, A., Pallottini, A., & Yue, B. 2015, ApJ, 813, 36
- Willott et al. (2015) Willott, C. J., Carilli, C. L., Wagg, J., & Wang, R. 2015, ApJ, 807, 180
- Zabl et al. (2015) Zabl, J., Nørgaard-Nielsen, H. U., Fynbo, J. P. U., et al. 2015, MNRAS, 451, 2050