Experimental demonstration of an isotope-sensitive warhead verification technique using nuclear resonance fluorescence
Abstract
Future nuclear arms reduction efforts will require technologies to verify that warheads slated for dismantlement are authentic without revealing any sensitive weapons design information to international inspectors. Despite several decades of research, no technology has met these requirements simultaneously. Recent work by Kemp et al. [Kemp RS, Danagoulian A, Macdonald RR, Vavrek JR (2016) Proc Natl Acad Sci USA 113:8618–8623] has produced a novel physical cryptographic verification protocol that approaches this treaty verification problem by exploiting the isotope-specific nature of nuclear resonance fluorescence (NRF) measurements to verify the authenticity of a warhead. To protect sensitive information, the NRF signal from the warhead is convolved with that of an encryption foil that contains key warhead isotopes in amounts unknown to the inspector. The convolved spectrum from a candidate warhead is statistically compared against that from an authenticated template warhead to determine whether the candidate itself is authentic. Here we report on recent proof-of-concept warhead verification experiments conducted at the Massachusetts Institute of Technology. Using high-purity germanium (HPGe) detectors, we measured NRF spectra from the interrogation of proxy ‘genuine’ and ‘hoax’ objects by a 2.52 MeV endpoint bremsstrahlung beam. The observed differences in NRF intensities near 2.2 MeV indicate that the physical cryptographic protocol can distinguish between proxy genuine and hoax objects with high confidence in realistic measurement times.
Nuclear arms reduction treaties have traditionally suffered from the disarmament verification problem: how can one confidently identify a warhead as authentic without having access to any sensitive design information that proves it is authentic? Rather than confront this apparent paradox, treaties such as the New Strategic Arms Reduction Treaty (New START) have relied on verification of warhead delivery vehicles—e.g., missiles and bomber aircraft—rather than direct verification of warheads themselves. Future arms control agreements, however, may require some mechanism for the verification of individual warheads Drell et al. (1993); Comley et al. (2000); Spears (2001); Fuller (2010) to ensure that a country does not dispose of fraudulent or ‘hoax’ warheads in a gambit to obtain a strategic nuclear advantage.
Warhead verification
In a warhead verification protocol, a warhead owner (‘host’) attempts to prove to an inspection team (‘inspector’) that an object submitted for inspection and subsequent dismantlement and disposition is indeed a genuine nuclear warhead. An object successfully verified may then be dismantled by the host under a secure chain of custody Bunch et al. (2014) and counted towards the host’s obligations under an arms reduction treaty. At the same time, the host seeks to prevent the inspector from learning any sensitive information about the design of the warhead, whether to prevent proliferation of nuclear weapons technology or disclosure of warhead architecture and vulnerabilities. Thus, the verification measurement must be designed and performed in such a way as to provide a strong test of authenticity while while minimizing intrusiveness and maximizing information security. Non-authentic warheads (‘hoaxes’) fall into two broad categories: isotopic hoaxes, in which a valuable weapon component (e.g., the weapons-grade Pu fissile fuel) is replaced by a less-valuable surrogate of similar geometry (e.g., reactor grade Pu); and geometric hoaxes, in which isotopes are present in their correct amounts but in a non-weapons-usable configuration (e.g., rough slabs of Pu rather than highly-engineered spherical shells).
Past approaches to warhead verification have generally focused on the ‘attribute’ approach, in which the protocol measures a set of key characteristics thought to define a warhead, such as the total mass of plutonium and the isotopic ratio of Pu-239 to Pu-240 in the object Defense Threat Reduction Agency (2001). Such measurements are highly intrusive, and so are conducted behind an ‘information barrier’ (IB), an electronic or software layer that shields the classified raw measurement data and presents the inspector with only a binary pass/fail answer for each of the attribute measurements Close et al. (2001). However, certifying that an electronic or (especially) software IB does not contain any hidden backdoors or functionalities—which a nefarious inspector could exploit to obtain sensitive information or a nefarious host could use to fraudulently simulate a ‘genuine’ result—is exceedingly difficult, and may never be satisfactorily proven. Moreover, attributes must be chosen specifically to describe real nuclear warheads, and thus may constitute sensitive information themselves. Even then, the set of attributes may not be complete, opening the door to hoax objects that pass all the attribute tests but nevertheless are not real warheads.
More recent work has therefore focused on the ‘template’ approach to verification, in which comparison to a known genuine object (the “template”) is used to certify subsequent objects presented for inspection Yan and Glaser (2015a); Fuller (2010); Marleau et al. (2015). In such a protocol, the measurements of both the template and subsequent objects are encrypted using the same method, so that only the encrypted signals (or “hashes”) must be compared to authenticate. The hash should be unique to a particular combination of geometry and isotopic makeup (i.e., a particular warhead design), while containing no sensitive information about the object. As such, the hash is useless on its own, and only has any use in comparison against the hash of another object—a warhead that is already known to be genuine. This authenticated template warhead could be established for instance via an unannounced visit by the inspector to a random launch facility in the host country, and then by selecting a random warhead from an active-duty intercontinental ballistic missile.111In any template warhead verification protocol, the utility of every measurement hinges on the authenticity of the template. A complete solution to the question of first establishing such an authentic template will require classified knowledge of the chain of custody of a country’s nuclear stockpile, and therefore is an open question beyond the scope of this article. A measurement of the authenticated template would then be used as the standard against which to compare the measurements from the same model of warhead covered by the arms control treaty.
Recent papers have put forth template verification protocols that aim to make a verification measurement of a warhead while protecting sensitive design information. A team of researchers at Princeton proposed and later experimentally demonstrated a verification protocol using superheated bubble detectors and fast neutron radiography Glaser et al. (2014); Philippe et al. (2016). In parallel, a team at the Massachusetts Institute of Technology (MIT) developed an alternative approach using isotopic tomography via transmission nuclear resonance fluorescence (tNRF) Kemp et al. (2016); the present work is an experimental demonstration of the MIT tNRF protocol. Further techniques using coded-aperture-based passive neutron counters Marleau and Krentz-Wee (2017) and epithermal neutron resonance radiography Hecla and Danagoulian (2017), from Sandia National Laboratories and MIT, respectively, have been proposed in the past year.
The strengths and weaknesses of the aforementioned proposals can be compared by examining the three requirements of an ideal warhead verification protocol:
-
1.
completeness: the ideal protocol must clear all real warheads;
-
2.
soundness: the ideal protocol must raise an alarm on all hoax warheads;
- 3.
The Princeton protocol is essentially zero-knowledge, returning a flat image (up to statistical variation) if the host has submitted a real warhead. In its original form Glaser et al. (2014), the measurement faces a challenge in the soundness requirement: fast neutron radiography is insensitive to the isotopic or (in some cases) elemental composition of the object, and cannot on its own distinguish between weapon materials and well-chosen hoax materials. Additional measurement modes using multiple incident neutron energies Yan and Glaser (2015b) have been proposed to increase the protocol’s discrimination between fissionable and fissile isotopes. Similarly, work on the Sandia coded-aperture protocol has focused on satisfying the completeness and information security aspects of the problem, but has not demonstrated resistance to hoaxing by a neutron source of similar geometry and activity.
Unlike the Princeton and Sandia protocols, the two MIT protocols are highly sensitive to isotopics through their use of isotope-specific resonant phenomena, making them highly robust against a large class of hoaxes. While the MIT tNRF protocol is not zero-knowledge (since the inspector has access to the hashed measurements rather than solely a binary genuine/hoax determination), and thus there are uncertainties about the extent of the information security of the MIT tNRF protocol, there are methods to make it sufficiently secure Kemp et al. (2016). This work demonstrates the core measurement of the MIT tNRF protocol, and is an experimental implementation of an isotopically-sensitive warhead verification measurement.
Nuclear resonance fluorescence measurements
Nuclear resonance fluorescence (NRF) describes the XX reaction in which a photon is resonantly absorbed by the nucleus X and then re-emitted as the excited nucleus subsequently transitions to its ground state Metzger (1959); Kneissl et al. (1996). The cross section for an NRF interaction with absorption via the resonant energy level is given by the Breit-Wigner distribution
| (1) |
where is the width of the level at , is the partial width for transitions between and the ground state, and is a statistical factor as described in SI Appendix §S1. For high- isotopes of interest, these fundamental widths are typically meV but the effective width of the cross section is increased to eV through Doppler broadening by thermal motion of the target nuclei. Imperfect detector resolution further broadens the measurable NRF resolution to widths of keV. Since the NRF lines of an isotope are still typically 10 keV apart, the set of resonance energies provides a resolvable, one-to-one map between measurement space and isotopic space.
The MIT verification protocol exploits the isotope-specific nature of NRF to make a template measurement of the mass and geometry of the isotopes of interest to the inspector. As discussed in the following section and illustrated in Fig. 1, the measurement uses a broad-spectrum bremsstrahlung photon source to irradiate the measurement object; NRF interactions in the object preferentially attenuate the photon flux at specific energies determined by the unique nuclear energy level structure of each isotope according to how much of the isotope is present in the warhead. The remaining transmitted flux at these energies goes on to induce further NRF interactions in an encryption foil, leading to NRF emission into high-purity germanium (HPGe) photon detectors at an observed rate (SI Appendix Eq. S11) that has been reduced by the presence of the NRF isotope in the warhead. The hashed measurements required for the template verification protocol are thus the recorded spectra, since it is impossible to precisely determine the warhead composition (i.e., the thickness in SI Appendix Eqs. S10 and S11) from the height of the NRF peaks in the observed spectrum without knowledge of the detailed composition of the foil (i.e., the thickness in SI Appendix Eq. S11). The exact foil design is therefore decided by the host and kept secret from the inspector. The influence of the warhead composition on the height of the NRF peaks—and thus any sensitive warhead design information—is then said to be physically encrypted by the foil. This technique uses the laws of physics to mask sensitive information, rather than electronic or computer-based information barriers, making it substantially more robust against tampering and hoaxing than previously proposed techniques Close et al. (2001). Although the detailed construction of the foil is kept secret from the inspector in order to maintain the encryption, the mere presence of certain characteristic NRF lines in the detected spectrum corresponds to the presence of certain isotopes in the encryption foil, a fact the inspector may use to validate the utility of a given foil without breaking the encryption. The foil may also be placed under joint custody of the host and inspector to ensure it has not been altered between the template and candidate measurements. As an additional layer of information security, the host may add optional ‘encryption plates’ of warhead materials to the measured object so that even if precise inference about the measured object is possible, it is impossible to infer anything about the warhead alone.
To protect against geometric hoaxes, the MIT protocol includes measurements of template and candidate warheads in random or multiple random orientations due to the difficulty for the host to engineer a hoax warhead that could mimic the template signal successfully along multiple projections. To increase the information security of this protocol, each orientation may be paired with a unique cryptographic foil to dilute the information content of the multiple measurements. Ref. Kemp et al. (2016) discusses the required complexity of such geometric hoaxes, which increases rapidly with number of projections measured.
Experimental design
Following the design depicted in Fig. 1, a bremsstrahlung beam was used to illuminate a circular section of the object undergoing interrogation. Since no real nuclear warheads were available in an academic setting, several proxy warheads were constructed. The proxy warheads were objects with a set of isotopes—U-238 and Al-27—that form the basis for proof-of-concept NRF experiments and subsequent extrapolations to more realistic settings involving weapon isotopes such as U-235, Pu-239, and Pu-240. The first proxy genuine target (“template I”) was constructed from DU plates of total thickness mm (wrapped in thin layers of Al foil, amounting to a total thickness of mm) encased between two mm-thick layers of high-density polyethylene (HDPE) as proxy high explosives. In the first hoax target (“hoax Ia”), the DU was replaced by mm of Pb sheets in order to match the nominal areal densities of high- material to better than . A second measurement of template I was made on the following day of experiments to emulate the verification of a genuine candidate warhead (“candidate Ig”). The Pb hoax was similarly re-measured (“hoax Ib”). To emulate measurements on different warhead designs, a second genuine target (“template II”) with double the thickness of DU was also tested against a hoax with double the thickness of Pb (“hoax IIc”) and against a partial hoax (“hoax IId”) in which only half the DU was replaced. In total, seven measurements were conducted on five different targets (see Table 1 and Figs. S10–S14).
Experiments were performed at MIT’s High Voltage Research Laboratory (HVRL), which houses a continuous-wave Van de Graaff electron accelerator capable of producing electron kinetic energies of – MeV at beam currents of up to µA. For the physical cryptography measurements, a MeV electron beam at the maximum stable current (between 25–30 µA) was directed towards a water-cooled bremsstrahlung radiator consisting of a µm-thick Au foil and approximately cm of Cu backing. The resulting MeV endpoint bremsstrahlung photon beam was then collimated with a 20 cm-long conical collimator of entry diameter mm and exit diameter mm, producing an opening half-angle of about . The beam configuration and stability are discussed in SI Appendix §S2.
Optional encryption plates directly after the collimator may be included as an additional layer of information security. The encryption plates are composed of warhead materials in amounts unknown to the inspector, so that any inference about the warhead composition will in fact be an inference on the warhead plus encryption plates, thus protecting the warhead information. As with the encryption foil, the encryption plates must remain constant between the template and candidate measurements. In these experiments, no such encryption plates were included in order to maximize the available flux and thus the statistical precision and sensitivity of the measurements.
After passing through the proxy warhead or hoax, the transmitted flux then impinged on the encryption foil, which was constructed from mm of DU plates followed by mm of aluminum plates. The uranium and aluminum components demonstrate the verification measurement for high- and low- materials, respectively. Specifically, the measurements in this work are designed to show the detection of high- material diversions and the verification of low- material consistency.
The combined NRF signature of the measurement target plus encryption foil—at this point physically encrypted—was measured using three mechanically cooled Ortec relative efficiency GEM P-type coaxial HPGe photon detectors. The detectors were placed cm from the foil at an angle of 55∘ to the beam axis, and surrounded by lead to shield against NRF photons directly from the warhead, as well as active backgrounds from the experimental setting which would otherwise limit the performance of the detectors. The shielding moreover prevents the detectors from observing any passive photon spectra generated by radioactive material in the test objects. The lead shielding thickness ranged from mm below the detectors to – mm along the line of sight from the collimator and warhead to the detectors. Only a mm lead filter was placed between the detectors and encryption foil. This reduced by multiple orders of magnitude the low energy photon flux, which can cause pileup and dead time in the detectors, with only a moderate reduction in the NRF signal. Finally, Canberra Lynx Digital Signal Analyzers were used to record the photon spectra in acquisition periods of five minutes (real time) in order to save the spectra for offline analysis and to estimate the detector dead time.
A mm right square cylinder lanthanum bromide (LaBr3) crystal was placed downstream from the foil as an independent diagnostic for the bremsstrahlung beam flux. It should be emphasized that such additional measurements are not part of the verification protocol. They are, however, useful in an experimental setting for determining the bremsstrahlung endpoint energy of MeV (despite the MV reading of the accelerator terminal voltage—see SI Appendix §S2.2) as small shifts in electron energy can have a large effect on absolute photon flux (and thus measurement time) near the endpoint. The LaBr3 scintillator was chosen for its extremely fast decay time ( ns) and encased in a lead hut in order to avoid high pileup rates that could complicate the endpoint measurement—the detector was directly downbeam from the radiator, otherwise shielded only by the warhead and encryption foil. The detector was controlled using the ROOT-based Brun and Rademakers (1997) ADAQAcquisition software Hartwig (2016) and a CAEN DT-5790M digitizer.
Results and analysis
For each measured object, photon spectra222Data and analysis code are available at https://github.com/jvavrek/PNAS2018 from multiple acquisition periods and three separate detectors are combined into a single live-charge-normalized333The term ‘live’ is used to denote measurement times calculated using live time, i.e., the real time minus the detector’s dead time. ‘Live charge’ therefore corresponds to the product of beam current with live time. spectrum in order to improve the signal-to-noise ratio (see SI Appendix §S3). Each spectrum is then fit with a series of Gaussian functions for the eight observed NRF peaks in the signal region near – MeV, on top of an exponentially decaying continuum background. U-238 contributes the 2.176, 2.209, and 2.245 MeV peaks, the branched decays keV below each of these three, and a small peak with no branch at 2.146 MeV. Al-27 contributes the intense 2.212 MeV peak. The Pb isotopes have no NRF lines below 2.3 MeV. Altogether, the spectral fitting function is written as
| (2) |
where and describe the shape of the continuum, and , , and are the area, mean, and standard deviation fit parameters of the peak. With eight sets of three peak parameters and two parameters for the continuum, this results in a total of 26 parameters per spectrum.
Once the 26-parameter fit (and set of associated fit parameter uncertainties) for each spectrum is computed using Eq. 2, the detected NRF rate in each peak in counts per live µAs, as predicted by integration of SI Appendix Eq. S11, can be extracted as simply , where is the value of the area fit parameter for the peak, and the division by the spectrum bin width enforces proper dimensions and normalization (Bevington and Robinson, 2003, p. 171). Similarly, the uncertainty in the NRF rate is (where is used to express the standard deviation uncertainty in a value so as to distinguish it from other uses of the symbol ) where is the uncertainty in the fit parameter as reported by ROOT’s TH1::Fit() subroutines Brun and Rademakers (1997).
One possible test statistic for comparing the NRF peaks of a single isotope is the sum of net rates (above the fit background) of the six U-238 peaks well-separated from the doublet: , , , , , and MeV. The 2.209 MeV component of the 2.209 and 2.212 MeV doublet tends to have a larger uncertainty such that it does not contribute reliably to , and thus is excluded. Moreover, since the amount of Al-27 (and the total high- areal density) does not change between the warhead and hoax objects, the MeV peak rate is consistent throughout the measurements (up to day-to-day beam variations—see SI Appendix §S2.2). To compare the NRF spectrum of a candidate object to that of the genuine template, the discrepancy is defined as the difference in divided by the uncertainty in the difference:
| (3) |
As the presence of an NRF isotope in the object reduces the corresponding observed NRF rate (and thus ), indicates a possible diversion of the isotope in the candidate compared to the template, while indicates a possible addition. Under the null hypothesis that the candidate object is a real nuclear warhead, , so that (due to statistics alone) is normally distributed with mean 0 and standard deviation 1: . As such, measures the discrepancy from the null hypothesis in number of standard deviations (“sigmas”) where, e.g., the probability of observing a discrepancy (regardless of sign) by chance alone, i.e., , is . Setting an alarm threshold by necessity trades-off the probability that the measurement declares a genuine warhead to be a hoax (type I error) and the probability that it declares a hoax warhead to be genuine (type II error). If low type I error is prioritized, a suitable alarm threshold may be , while may be more suitable if low type II error is desired.
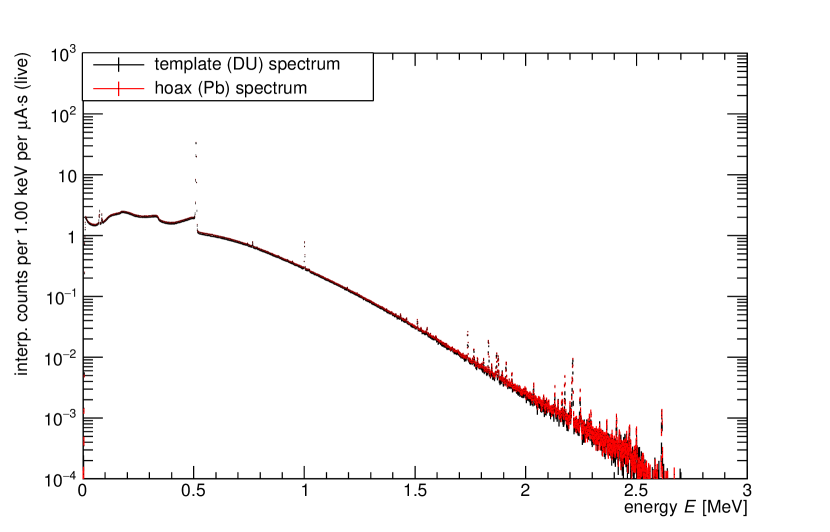
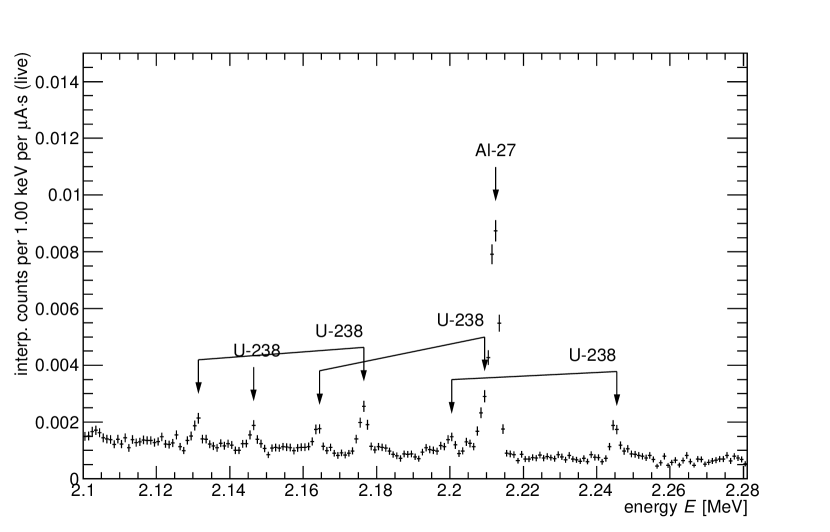
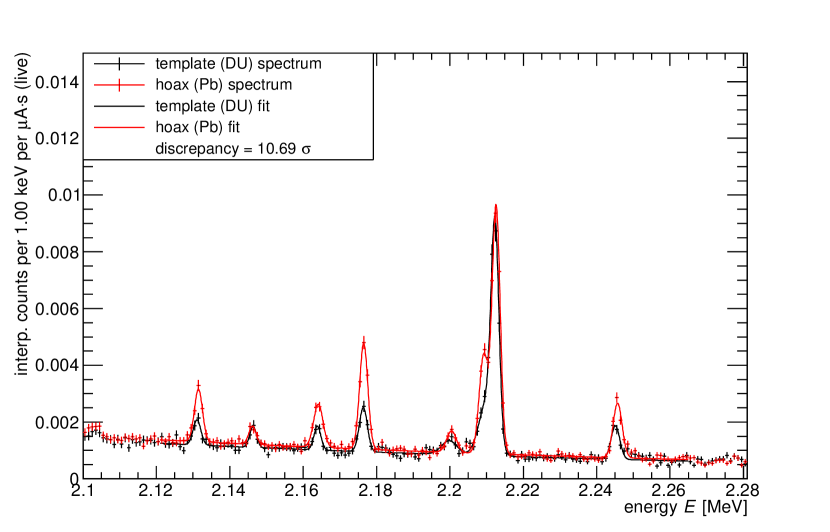
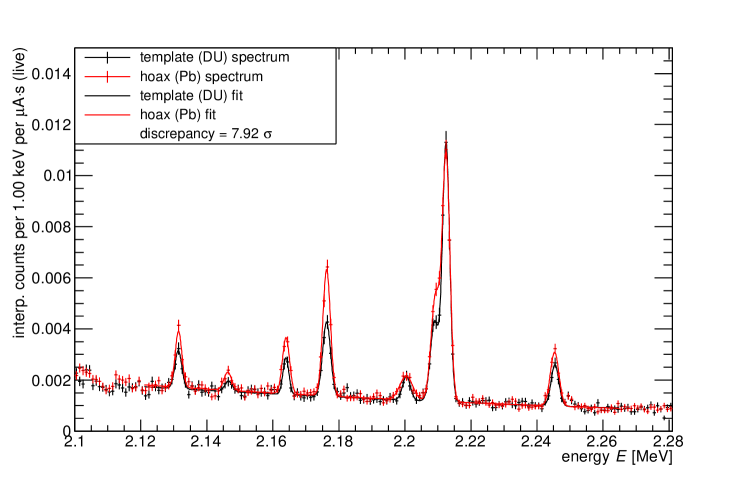
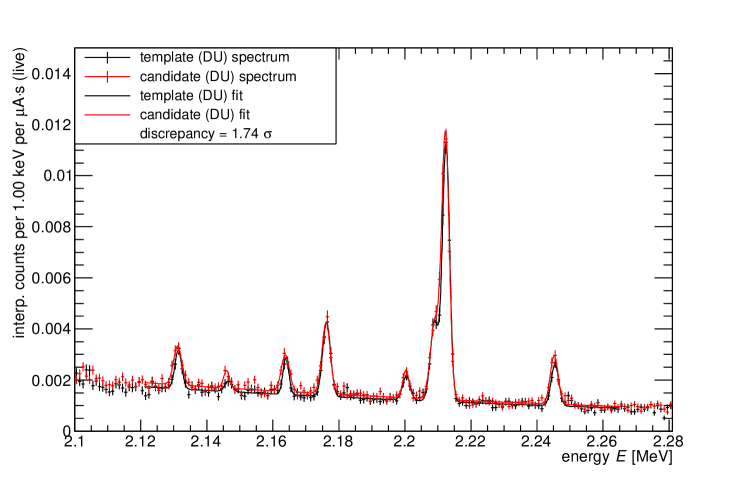
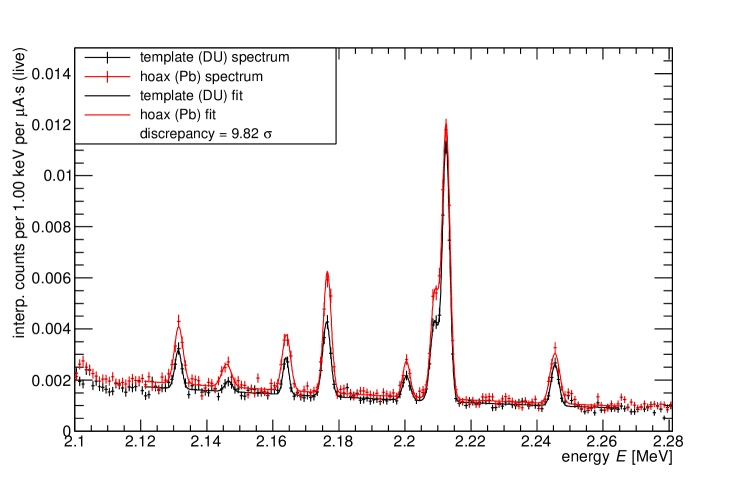
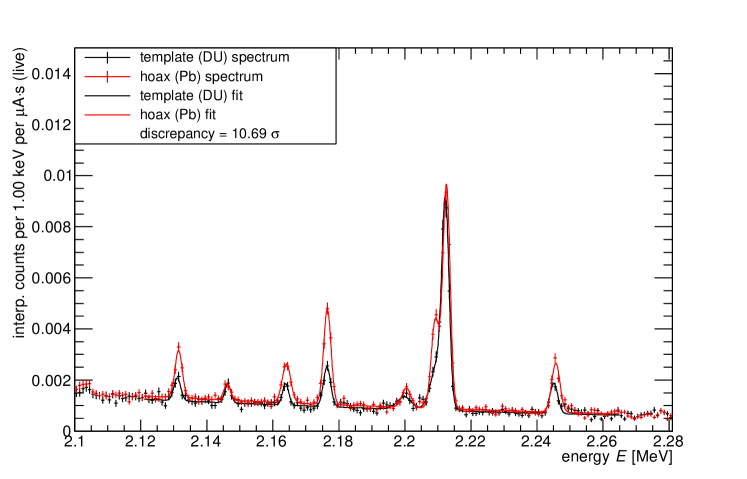
Figs. 2, 3, and 4 show the culmination of the above analysis procedure for the fourth verification scenario listed in Table 1 (template II vs hoax IIc). Fig. 2 contains the two combined spectra measured for the template II (DU) and hoax IIc (Pb) proxy warheads; in this unzoomed energy range, the genuine and hoax spectra at first appear to match quite closely, with no obvious distinguishing features. Focusing on the NRF signal region in Fig. 3 (where only the template II spectrum is shown for clarity), the NRF peaks from U-238 and Al-27 become visible; Fig. 4 subsequently shows the 26-parameter fits to the two spectra and the computed discrepancy of . The discrepancies for all verification scenarios are shown in Table 1 (see also SI Appendix Table S1). In all four hoax scenarios, a discrepancy in greater than an alarm threshold of was attained in µAh (live, on three detectors) per measured object, indicating diversions in the uranium component. In the genuine candidate scenario, the discrepancy in uranium (primarily a result of day-to-day beam variations) does not trigger the alarm at , and is clearly delineated from the much larger observed discrepancies in the hoax cases. Similarly, the Al-27 comparisons all exhibit , indicating consistency in the aluminum component across all measurement scenarios.
The continua underlying the peaks—generated from both pileup and secondary electron bremsstrahlung in the foil—also provide some insight. For the spectra in Fig. 2, the integrals from – MeV differ by . The differences rise to – when comparing measurements performed on different days due to beam variations, but are only in the other same-day measurements. Though these small differences are significant given the high statistics at low energies, the close matching of continua between the template and hoax scenarios suggests that the continuum background may not encode any appreciable information about the isotopic content of the weapon. This lack of distinguishing information in the majority of the spectrum also may indicate that non-resonant photon transmission measurements such as radiographs would likely fail to detect hoaxes of the same areal density.
| # | scenario | Al-27 discrep. | U-238 discrep. |
|---|---|---|---|
| - | - | (vs template) | (vs template) |
| 0 | template I | - | - |
| 1 | hoax Ia (100% Pb) | 0.051 | 7.9 |
| 2 | genuine candidate Ig | 0.76 | 1.7 |
| 3 | hoax Ib (100% Pb) | 1.7 | 9.8 |
| 4 | template II | - | - |
| 5 | hoax IIc (100% Pb) | 0.25 | 10.7 |
| 6 | hoax IId (50% Pb) | 1.9 | 4.6 |
Discussion
Extrapolation to future systems
The proxy warheads used in this article are relatively thin—templates I and II have total on-axis areal densities of and g/cm2, respectively—and do not accurately represent typical areal densities of real warheads. More realistic warhead models in the open literature range from the compact ( g/cm2) Black Sea-type warhead used in Kemp et al. (2016) to the thicker ( g/cm2) models of Fetter et al. Fetter et al. (1990a). Moreover, verification measurements conducted on real warheads will use the NRF lines associated with the fuel isotopes U-235 or Pu-239, whose strongest lines are 2–5 less intense than the U-238 lines considered in this work Bertozzi et al. (2008). In the present experimental design, verification of realistic weapon designs would therefore require several orders of magnitude longer measurement times than the detector live µAh used here (see Table 2). In a dedicated warhead verification facility, however, these unrealistically long measurement times could be ameliorated by increasing the electron beam current and the number of detectors (see SI Appendix §S4). A modern commercially available electron accelerator may have a continuous wave beam current of at least 5 mA at 3 MeV IBA Industrial (2017), a factor of improvement over the 25 µA used in this experiment. While this increase in beam current would affect the event rate in the detectors (thus reducing the effective live time), the increase in the event rate is only 30 due to the increased attenuation of realistic warheads (see SI Appendix §S4). This increase may be mitigated by reducing the detector sizes and the operating with more detectors, by optimizing the balance of the detector event rate and the available measurement time, or by taking advantage of future developments of high-rate HPGe detectors capable of operating at MHz rates Fast et al. (2013). Additionally, the shielding and detector filters used in this experiment could be signficantly optimize to reduce the low energy photon rate in the HPGe detectors to further alleviate this effect. Extending the array of detectors from three to 30 would provide another factor of reduction in measurement time, and would provide the additional benefit of reducing the dose to the warhead—here estimated at Gy per 1 hour measurement at 25 µA for template I—required to achieve the same confidence. Doses for other warhead configurations are presented in Ref. Kemp et al. (2016). Such a dedicated verification system would be capable of attaining confidence in a single NRF line in a Pb hoax scenario involving the Fetter et al. uranium-uranium model of Table 2 in – minutes per projection per object, for a capital cost on the order of USD 5M. This required runtime increases to hours for the worst-case plutonium-uranium model in Table 2. For thinner warheads, or for warheads that have been partially disassembled, even lower measurement times would be required, creating opportunities for measurements at multiple warhead orientations, for measurements of isotopes with weaker NRF lines, or for ruling out less discernible hoaxes. More information on the calculation of the required runtimes for realistic warhead configurations may be found in SI Appendix Section S4.
| comparison (model ref.) | NRF line | foil | det. live µA hr |
|---|---|---|---|
| WGU+W vs Pb+W Fetter et al. (1990a) | U-235 1.733 MeV | WGU | |
| WGU+DU vs Pb+DU Fetter et al. (1990a) | U-235 1.733 MeV | WGU | |
| WGPu+W vs Pb+W Fetter et al. (1990a) | Pu-239 2.431 MeV | WGPu | |
| WGPu+DU vs Pb+DU Fetter et al. (1990a) | Pu-239 2.431 MeV | WGPu | |
| WGU vs Pb Kemp et al. (2016) | U-235 1.733 MeV | WGU | |
| WGPu vs Pb Kemp et al. (2016) | Pu-239 2.431 MeV | WGPu |
Information security
The equation for the predicted NRF rates (SI Appendix Eq. S11 or its integrated form), contains multiple quantities that are kept secret from the inspector, and thus cannot be used alone to infer the warhead thickness from a physically encrypted spectrum. However, it may be possible to construct a system of equations from SI Appendix Eq. S11—one equation per NRF peak—and make a series of simplifying approximations, in which case there may be at least as many equations as unknowns and inference may be possible. As previously shown in Fig. 1 and described in (Kemp et al., 2016, SI §7.1), a solution to this multi-line inference problem is to include optional encryption plates of relevant materials of unknown thickness to the collimator output. As such, any inference on the isotope of interest will estimate only an upper bound . In fact, if such encryption plates are used, the foil parameter no longer needs to be kept secret from the inspector, eliminating the information security complexities of ensuring that the foil has not been nefariously designed.
Lastly, the continuum background may contain sensitive information, especially given the large number of photons it comprises over the entire range of the spectrum (see Fig. 2). The ‘logarithmic slope’ parameter in Eq. 2, for instance, depends moderately on the atomic number of the foil materials Bertozzi et al. (2007). As discussed above, however, the continuum appears to encode very little information about the of the warhead materials for a fixed areal density. A thorough analysis of the continuum information content is therefore a vital next step in the analysis of the physical cryptographic NRF protocol. For a more complete discussion of information security issues and possible solutions, the reader is referred to Kemp et al. (2016).
Conclusions and future work
We have reported on the successful demonstration of the MIT tNRF physical cryptographic warhead verification protocol. The isotope-sensitive tNRF measurement is capable of distinguishing proxy nuclear warheads from hoax objects with high confidence in total measurement times of around one hour per object. Extrapolations to more realistic warhead designs indicate that a dedicated warhead verification facility could conduct verification measurements in less than an hour while protecting sensitive warhead design information.
The NRF verification technique may be expanded to other isotopes that may be found in nuclear weapons (beyond U-238 and Al-27) such as U-235 or Pu-239 in the fissile fuel and nitrogen and carbon isotopes in the high explosives Caggiano et al. (2007). Similarly, testing the measurement’s sensitivity to geometric hoaxes would be a useful development. Finally, an additional layer of information security may be added through analog-to-digital converters (ADCs) with non-uniform binning, which are currently being developed. Such ADCs would act as very low-level, more easily-verifiable information barriers. If installed in the acquisition systems of the HPGe detectors, such ADCs could be used to remove all spectral features except one NRF line per isotope from the observed spectrum, thus eliminating possible information security concerns such as the continuum and the multi-line inference problem.
In a broader context, the implementation of any warhead verification protocol in a real arms control agreement faces two challenges. First, an assessment of the protocol’s utility and security must be made by nuclear weapons laboratories. To this end, future work on any warhead verification protocol should involve collaboration with the US and possibly Russian national laboratories, and possibly combining multiple proposed verification techniques as part of an overarching protocol. Such a joint effort will enable research that otherwise could not be conducted in academic settings, such as the aforementioned measurements involving weapons isotopes and realistic, classified weapon geometries. Finally, the implementation of a warhead verification protocol is predicated on the existence of future arms control frameworks, and thus requires a commitment to the goal of deep reductions in the world’s nuclear arsenals.
Acknowledgements.
This work was funded in part by the Consortium for Verification Technology under Department of Energy National Nuclear Security Administration award number DE-NA0002534. BSH gratefully acknowledges the support of the Stanton Foundation’s Nuclear Security Fellowship program. The authors thank Chathan Cooke for operating the HVRL accelerator, Charles Epstein and Richard Milner for their electron beam diagnostics, Rob Goldston for useful discussions, and R. Scott Kemp for offering comments on the manuscript.References
- Drell et al. (1993) S. Drell, C. Callan, J. Cornwall, F. Dyson, and D. Eardley, Verification of Dismantlement of Nuclear Warheads and Controls on Nuclear Materials, Tech. Rep. JSR-92-331 (MITRE Corp JASON Program Office, McLean, VA, 1993).
- Comley et al. (2000) C. Comley, M. Comley, and P. Eggins, Confidence, security and verification: The challenge of global nuclear weapons arms control, Tech. Rep. AWE/TR/2000/001 (United Kingdom Ministry of Defence, Whitehall, London, 2000).
- Spears (2001) D. Spears, US Department of Energy, National Nuclear Security Administration, Defense Nuclear Nonproliferation Programs, Washington, DC (2001).
- Fuller (2010) J. Fuller, Arms Control Today 40, 19 (2010).
- Bunch et al. (2014) K. J. Bunch, M. Jones, P. Ramuhalli, J. Benz, and L. S. Denlinger, Sci. Glob. Sec. 22, 111 (2014), https://doi.org/10.1080/08929882.2014.917924 .
- Defense Threat Reduction Agency (2001) Defense Threat Reduction Agency, Technical Overview of Fissile Material Transparency Technology Demonstration, Tech. Rep. (Los Alamos National Laboratory, Los Alamos, NM, 2001) retrieved from http://www.lanl.gov/orgs/n/n1/FMTTD/presentations/pdf_docs/exec_sum.pdf on December 4, 2017.
- Close et al. (2001) D. Close, D. MacArthur, and N. Nicholas, Information Barriers—A Historical Perspective, Tech. Rep. LA-UR-01-2180 (Los Alamos National Laboratory, Los Alamos, NM, 2001) retrieved from http://lib-www.lanl.gov/la-pubs/00796106.pdf on December 4, 2017.
- Yan and Glaser (2015a) J. Yan and A. Glaser, Sci. Glob. Sec. 23, 157 (2015a), http://scienceandglobalsecurity.org/archive/sgs23jieyan.pdf .
- Marleau et al. (2015) P. Marleau, E. Brubaker, S. Deland, N. Hilton, M. McDaniel, R. Schroeppel, K. Seager, M. C. Stoddard, and D. MacArthur, Report on a zero-knowledge protocol tabletop exercise, Tech. Rep. SAND2015-5075 (Sandia National Laboratories, Los Alamos National Laboratories, Livermore, CA and Los Alamos, NM, 2015).
- Glaser et al. (2014) A. Glaser, B. Barak, and R. Goldston, Nature 510, 497 (2014).
- Philippe et al. (2016) S. Philippe, R. J. Goldston, A. Glaser, and F. d’Errico, Nat Commun 7, 12890 (2016).
- Kemp et al. (2016) R. S. Kemp, A. Danagoulian, R. R. Macdonald, and J. R. Vavrek, Proc Natl Acad Sci USA 113, 8618 (2016).
- Marleau and Krentz-Wee (2017) P. Marleau and R. Krentz-Wee, Investigation into practical implementations of a zero knowledge protocol, Tech. Rep. SAND2017-1649 (Sandia National Laboratories, Livermore, CA, 2017).
- Hecla and Danagoulian (2017) J. J. Hecla and A. Danagoulian, arXiv preprint arXiv:1709.09736 (2017).
- Goldwasser et al. (1989) S. Goldwasser, S. Micali, and C. Rackoff, SIAM Journal on Computing 18, 186 (1989).
- Blum et al. (1988) M. Blum, P. Feldman, and S. Micali, in Proc. of the 20th Annual Association for Computing Machinery Symposium on Theory of Computing (Chicago, IL, 1988) pp. 103–112.
- Yan and Glaser (2015b) J. Yan and A. Glaser, in Proc. 56th Annual INMM Meeting (2015) retrieved from http://www.princeton.edu/~aglaser/PU105-Yan-Jie-Glaser-2015.pdf on Oct. 23, 2017.
- Metzger (1959) F. Metzger, Prog Nucl Phys 7, 54 (1959).
- Kneissl et al. (1996) U. Kneissl, H. Pitz, and A. Zilges, Prog Part Nucl Phys 37, 349 (1996).
- Brun and Rademakers (1997) R. Brun and F. Rademakers (ROOT), Nucl Instrum Methods in Phys Res A 389, 81 (1997).
- Hartwig (2016) Z. S. Hartwig, Nucl Instrum Methods Phys Res A 815, 42 (2016).
- Bevington and Robinson (2003) P. R. Bevington and D. K. Robinson, Data reduction and error analysis for the physical sciences (McGraw-Hill, New York, NY, 2003).
- Fetter et al. (1990a) S. Fetter, V. A. Frolov, M. Miller, R. Mozley, O. F. Prilutsky, S. N. Rodionov, and R. Z. Sagdeev, Sci. Glob. Sec. 1, 225 (1990a).
- Bertozzi et al. (2008) W. Bertozzi, J. Caggiano, W. Hensley, M. Johnson, S. Korbly, R. Ledoux, D. McNabb, E. Norman, W. Park, and G. Warren, Phys Rev C 78, 041601 (2008).
- IBA Industrial (2017) IBA Industrial, “IBA Dynamitron,” (2017), retrieved from http://www.iba-industrial.com/accelerators#dynamitron-e-beam-accelerator on Oct. 20, 2017.
- Fast et al. (2013) J. Fast, M. Dion, D. Rodriguez, B. VanDevender, L. Wood, and M. Wright, Performance of the Ultra-High Rate Germanium (UHRGe) System, Tech. Rep. PNNL-23084 (Pacific Northwest National Laboratory, Richland, WA, 2013).
- Bertozzi et al. (2007) W. Bertozzi, S. E. Korbly, R. J. Ledoux, and W. Park, Nucl Instrum Methods Phys Res B 261, 331 (2007).
- Caggiano et al. (2007) J. A. Caggiano, G. A. Warren, S. E. Korbly, R. A. Hasty, A. Klimenko, and W. H. Park, in Nuclear Science Symposium Conference Record, 2007. NSS’07. IEEE, Vol. 3 (IEEE, Honolulu, HI, 2007) pp. 2045–2046.
- Browne and Tuli (2015) E. Browne and J. Tuli, Nuclear Data Sheets 127, 191 (2015).
- Pruet et al. (2006) J. Pruet, D. McNabb, C. Hagmann, F. Hartemann, and C. Barty, Journal of Applied Physics 99, 123102 (2006).
- Quiter et al. (2011) B. J. Quiter, B. A. Ludewigt, V. V. Mozin, C. Wilson, and S. Korbly, Nucl Instrum Methods Phys Res B 269, 1130 (2011).
- Hamilton (1940) D. R. Hamilton, Physical Review 58, 122 (1940).
- Quiter (2010) B. Quiter, Nuclear resonance fluorescence for nuclear materials assay, Ph.D. thesis, University of California, Berkeley (2010).
- AMETEK Inc. (2017) AMETEK Inc., “GEM series coaxial HPGe detector product configuration guide,” (2017), retrieved from http://www.ortec-online.com/-/media/ametekortec/brochures/gem.pdf on Oct. 23, 2017.
- Vavrek et al. (2017) J. R. Vavrek, S. J. Collins, A. Danagoulian, R. S. Henderson, R. S. Kemp, R. Lanza, and R. Macdonald, in Proc. 58th Annual INMM Meeting (Institute for Nuclear Materials Management, 2017).
- Kirkpatrick and Miyake (1932) P. Kirkpatrick and I. Miyake, Review of Scientific Instruments 3, 1 (1932).
- Mirion Technologies , Inc.(2017) (Canberra) Mirion Technologies (Canberra), Inc., “LABR-1.5x1.5 data sheet,” (2017), retrieved from http://www.canberra.com/products/detectors/pdf/LABR-SS-C39490.pdf on Oct. 23, 2017.
- Quarati et al. (2013) F. G. A. Quarati et al., Nucl Instrum Methods Phys Res A 729, 596 (2013).
- Agostinelli et al. (2003) S. Agostinelli et al. (GEANT4), Nucl. Instrum. Meth. A506, 250 (2003).
- Fetter et al. (1990b) S. Fetter, T. B. Cochran, L. Grodzins, H. L. Lynch, and M. S. Zucker, Science 248, 828 (1990b).
Appendix S1 Nuclear resonance fluorescence
Nuclear resonance fluorescence (NRF) describes the XX reaction in which a photon is resonantly absorbed by the nucleus X and then re-emitted as the excited nucleus subsequently relaxes to its ground state Metzger (1959); Kneissl et al. (1996). Due to the discrete energy level structure of the nucleus, the probability that an incident photon of energy undergoes an NRF interaction is only significant if is approximately equal to one of the resonance energies of the nucleus, given by
| (S4) |
where is the energy of a nuclear level and the latter term corrects for the recoil energy (20 eV for U-238 and MeV) of the nucleus X with mass . The probability of absorption by state is then given by the NRF cross section, which is most accurately described by a Doppler-broadened version of the Lorentzian profile of Eq. 1:
| (S5) | ||||
where
| (S6) | |||
| (S7) |
is the intrinsic width of the excited state , and
| (S8) |
is the Doppler-broadened width of the state at temperature . For NRF lines of high- isotopes, – meV Browne and Tuli (2015) while eV. For greater accuracy, the and thus may be evaluated using the effective temperature instead of the physical temperature of the target Metzger (1959). The is a statistical factor that accounts for the number of available spin states at the ground and resonant states:
| (S9) |
where for is the spin of the level. The branching ratio from the resonant state to ground also enters the calculation as , where is the partial width for the decay and . The therefore also give the probabilities of the resonant state decaying either directly to the ground state, emitting a photon of energy (neglecting recoil), or through the intermediate state , emitting a photon of energy .
Given Eq. S5, the NRF measurement described in the main paper can be described by a slightly simplified 1D model (see e.g. Fig. 1) in which a parallel incident bremsstrahlung beam is incident on a single-isotope rectangular slab warhead of thickness . The transmitted flux then interacts with a rectangular slab foil of thickness composed of the warhead isotope. In this case, the transmitted flux through the warhead can be written as
| (S10) |
where the terms denote linear attenuation coefficients if is expressed as a length, or mass attenuation coefficients if it is expressed as an areal density. This equation assumes that every NRF or non-resonant (‘nr’) interaction (e.g. Compton scattering, pair production, etc.) results in the loss of forward-going flux at energy . Because of the sharp -dependence of , the forward-going flux is preferentially attenuated or ‘notched’ at the resonance energies of the isotopes present in the warhead. The above assumption regarding photon losses can break down via a process known as ‘notch refill,’ by which photons undergo small-angle Compton scattering to the resonance energies, thus replenishing the available flux in the notches and reducing the sensitivity of the measurement to the warhead Pruet et al. (2006). Since the notches are narrow, notch refill is only significant for relatively thick measurement targets (e.g. a correction factor of for areal densities g/cm2 Quiter et al. (2011)) with many opportunities for downscatter.
For a single transition from (dropping subscripts for brevity), the double-differential NRF count rate induced by the transmitted flux as observed by a single HPGe detector is
| (S11) | ||||
where is the angular correlation function for successive gamma rays Hamilton (1940) and is the intrinsic peak efficiency of the HPGe detector. A high- (typically Pb) filter may be placed between the foil and detector in order to preferentially attenuate low-energy photons and reduce detector dead time, in which case is the probability that an NRF photon of energy will be transmitted through the filter. The effective attenuation coefficient
| (S12) |
accounts for attenuation in the foil of incoming photons (of energy ) via NRF and non-resonant processes as well as the attenuation of outgoing NRF photons (of energy ) through the path at angle pointing to the detector. Integration of Eq. S11 over all energies and the solid angle of the detector then gives the predicted count rate for a single NRF peak as observed by the detector. The peak will appear not as a perfectly sharp emission line at , but as a Gaussian centered at due to the imperfect resolution of the detector.
We note that the sharp -dependence of in the exponential terms of Eqs. S10 and S11 can substantially affect the predicted detected count rate (Quiter, 2010, Fig. 3.25): while the Doppler-broadened Lorentzian profile of Eq. S5 is the most accurate, a Gaussian approximation Metzger (1959) to the cross section is often sufficient. The rectangular cross section approximation—a constant value of cross section over an energy range on the order of eV such that the integral of Eq. S5 over (the ‘integrated cross section’) is preserved—is only accurate to about and should be avoided unless computational efficiency is required at the expense of accuracy.
Appendix S2 Experimental Methods
S2.1 Data acquisition
Data acquisition (DAQ) was accomplished using a Canberra Lynx Digital Signal Analyzer (DSA) connected to each HPGe detector AMETEK Inc. (2017). Instead of using the standard Genie2K acquisition software, the three detectors and DAQs were controlled simultaneously using the custom-written Python Readout with Lynx for Physical Cryptography (PROLyPhyC) wrapper classes sitting atop the Lynx Software Development Kit (SDK). Events were recorded in pulse-height analysis (PHA) mode, resulting in a 32768-channel pulse height spectrum produced for each detector at the end of each acquisition time. To guard against data corruption due to beam instability, acquisition times were set to five minutes (real time); each measurement therefore consisted of 10 such acquisition periods summed together using the procedure described in Section S3. The raw pulse height spectra were converted to energy (deposition) spectra using linear calibrations of channel number vs energy using Cs-137 ( MeV) and Co-60 (, MeV) check sources taken before and throughout the week of experiments.
The integrated beam charge over the course of an acquisition period was determined by using a Keithley Model 614 Electrometer to measure the beam-induced current from the radiator to ground. The analog output of the electrometer was digitized by a Measurement Computing Model USB-201 analogue-to-digital converter at a sample rate of 1 kHz, and read to a plain text file on a laptop for persistent storage. The average current over the acquisition time was then computed for use in Eq. S13 and compared against the display of the electrometer throughout the run for consistency.


S2.2 Beam characterization and stability
The stability and reproducibility of the electron beam settings (most notably, the beam energy, current, and position relative to the gold radiator foil) directly affects the validity of comparisons between template/candidate scenarios, especially when the integrated beam charge is used to normalize measurements. In particular, preliminary experiments that tested elements of the physical cryptographic protocol prior to the work reported here indicated that the absolute rate of NRF photon detection was lower than expected from simulation and analytic calculations by a factor of – Vavrek et al. (2017). A number of possible explanations for this observation were explored, and uncertainties in the electron beam position, emittance, and energy were identified as the most likely causes of the discrepancy. While knowledge of the absolute bremsstrahlung flux is not required to perform the relative spectral comparisons between template and candidate warheads, any temporal variance in the flux could make such comparisons invalid. Due to this, several operational procedures and diagnostics were implemented to complement and enhance the existing HVRL beam diagnostics. The results of these diagnostics are presented in this section, demonstrating that while variations in the beam may have affected previous experiments, the beam conditions were well-understood and constrained for the data presented in this work due to the improvements.
S2.2.1 Electron beam energy
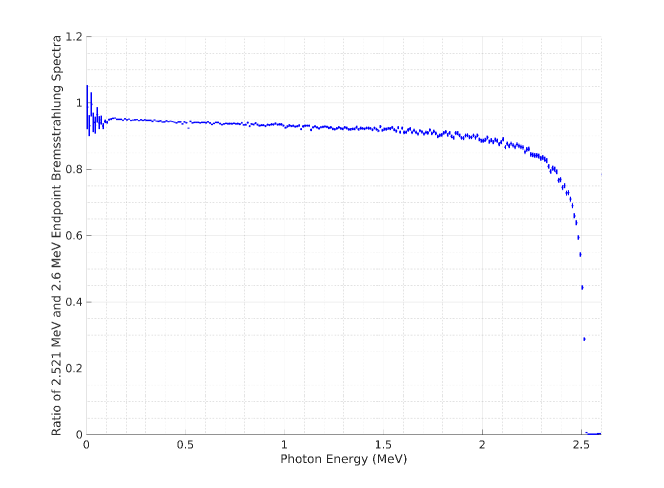
The electron beam kinetic energy was chosen as 2.6 MeV as a compromise of several competing factors. An ideal beam for this application maximizes the number of photons at the specific energies of the NRF lines of interest while minimizing photons at other energies. Photons above the NRF energies may undergo various physical processes that may cause them to scatter into the detectors resulting in background counts in the region of the spectrum near the NRF energies and additionally contribute to the notch refill effect discussed in Section S1. Below the NRF energies, photons contribute to pile-up effects in detectors and add to the radiation dose to which inspected objects are exposed. To balance these effects when studying NRF lines, it is most effective to choose an endpoint energy a few hundred keV above the NRF energies. For a photon source produced by the bremsstrahlung of electrons, the number of photons rapidly decreases as a function of energy with no photons produced above the energy of the incident electrons, as visible in the spectra shown in Fig. S3. Due to this sharp drop-off in the spectrum, however, the total flux of photons at the NRF energies depends strongly on the precise location of the endpoint. This is illustrated in Fig. S4, which shows the ratio of the forward bremsstrahlung fluxes of electron beams of nominal (2.6 MeV) energy and of energy below nominal (2.521 MeV). This 3% change in the beam energy results in 10% change at the NRF lines energies, which is further magnified by the even greater reduction at higher energies (since these photons can downscatter within the mock warhead and/or foil to add to the flux). While the absolute flux of the bremsstrahlung beam is not required for the comparative measurements presented here, this effect necessitates establishing that the beam energy was consistent between measurements. The HVRL electron beam energy was set using a generating voltmeter (GVM), which measured the potential across the accelerator terminals Kirkpatrick and Miyake (1932). When used for this purpose, however, GVMs require regular, independent calibration to the actual electron beam energy, a process that had not been conducted for the HVRL beam for some time prior to the experiments described in this work. Additionally, since the GVM reading was not recorded throughout the run (so as to monitor its fluctuations), it is critical to establish the stability of the beam energy between the different measurements.
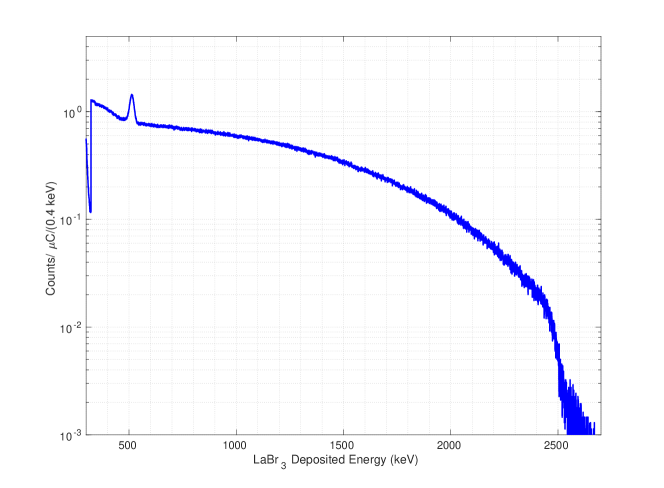
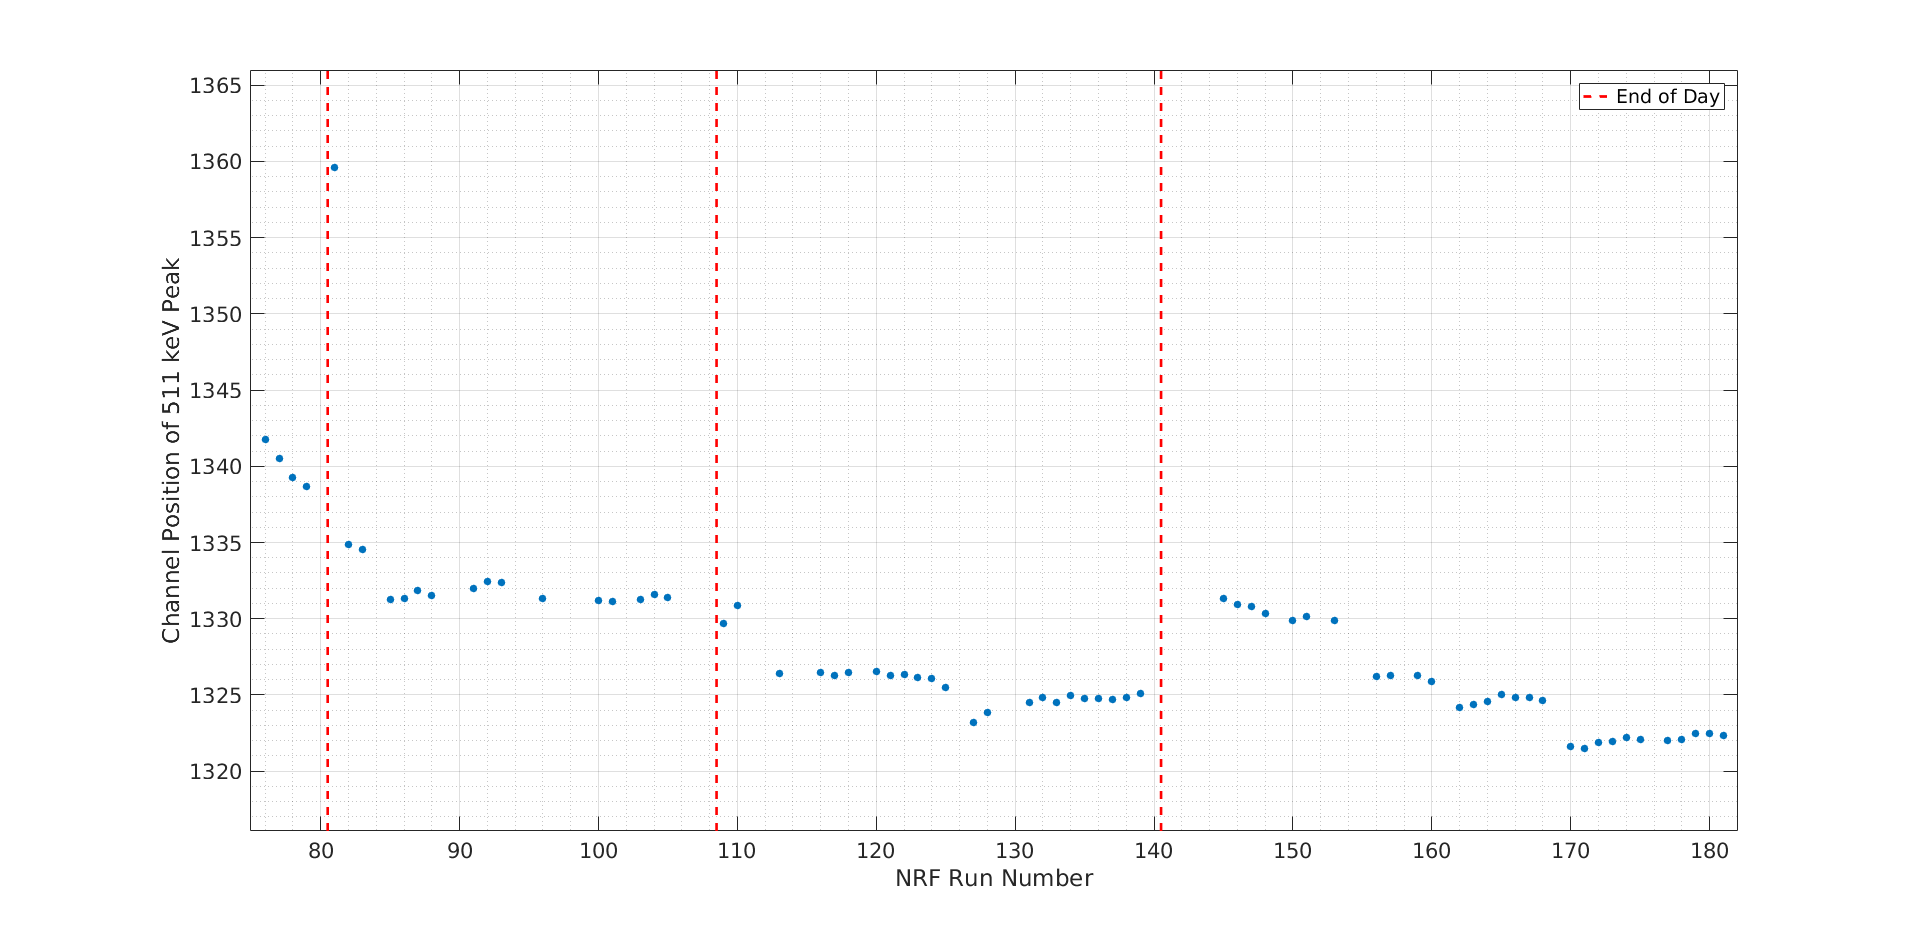
To measure the electron beam energy, the LaBr3 scintillator spectra of the bremsstrahlung photons for each data run were examined. The LaBr3 detector Mirion Technologies , Inc.(2017) (Canberra) is especially well-suited for examining spectral features in the vicinity of 2.0–2.7 MeV due to the presence of intrinsic spectral lines in this region that are due to alpha decays from the decay chain of Ac-227, which is a contaminant in LaBr3 due to the chemical similarities of La and Ac Quarati et al. (2013). The electronic-equivalent energy depositions from several of these decays allow a precise calibration of the ADC-photon energy calibration of the detector in this region. Following the experimental run, a long sample of the intrinsic spectrum of the detector was collected to provide a precise energy calibration. To account for a possible shift in the gain of the detector over the course of the experimental run, the ADC channel position corresponding to the 511 keV peak (caused by the plentiful pair production interactions caused by photons with energy greater than 1022 keV in the bremsstrahlung beam) was determined for each of the data runs as a measure of the shift in gain and is shown in Fig. S5. The shift in this peak position relative to the data taken immediately before the intrinsic calibration run was used to correct the gain drift for each spectrum to calibrate the individual spectra. Additionally, pulse shape discrimination was utilized to exclude pile-up events (in which two photons contributed to a single count in the spectrum). Since such events contribute relatively significantly to the high-energy end of the spectrum, rejecting them is necessary to sharply reconstruct features such as the spectral endpoint.
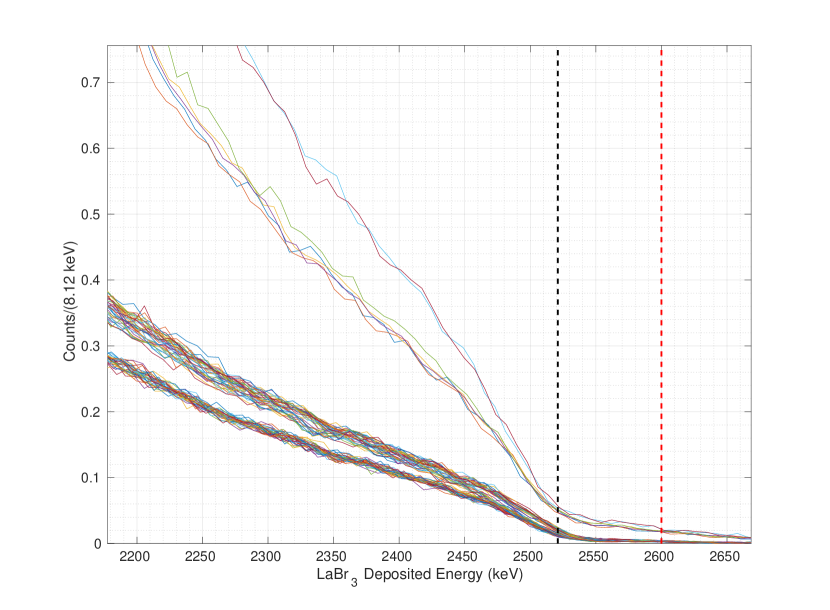
For each calibrated spectrum, the point at which the second derivative of the spectrum was maximal (determined numerically) was found, indicating the position at which the rapidly decreasing bremsstrahlung spectrum met the relatively flatter background above the endpoint, thus indicating the energy of the incident electron beam. Fig. S7 shows the shape of the spectrum endpoint for each data run, illustrating the fact that the rapid drop-off in the bremsstrahlung spectrum occurred at a lower energy than the nominal 2.6 MeV endpoint. Fig. S6 shows the results of the fit determination for each of the data runs. This procedure contributes 4 keV systematic uncertainty to the overall determination of the endpoint, while the gain drift conservatively contributes another 0.5% uncertainty (reduced from the total drift by the correction described). Averaging the results of the individual electron beam energy extractions results in a beam energy determination of MeV, lower than the nominally determined beam energy. As shown in Fig. S6, however, the endpoint energy was very stable to within the quoted uncertainty over the entire experimental run, demonstrating that variations in the beam energy did not systematically affect any comparisons between template and candidate proxy warheads. Understanding this systemic offset, however, is critical for any future analyses that require knowledge of the absolute photon flux.

S2.2.2 Electron beam position
The spectrum of bremsstrahlung photons emitted from a radiator depends significantly on the geometry and materials of the radiator, and thus may also depend on the position at which the electrons are incident on the radiator. In particular, the number of photons generated near the endpoint energy is maximized by ensuring that the photons first strike the highest atomic number material (in this case the gold of the 126 µm foil) prior to losing energy through interactions with other materials. If the position of the electron beam deviates from the center of the foil or if the electron beam has a significant width beyond the 0.5 cm radius of the gold foil, the bremsstrahlung photon spectrum is altered and any inconsistencies in these parameters over the course of the experimental run could induce differences between the different proxy warhead tests.
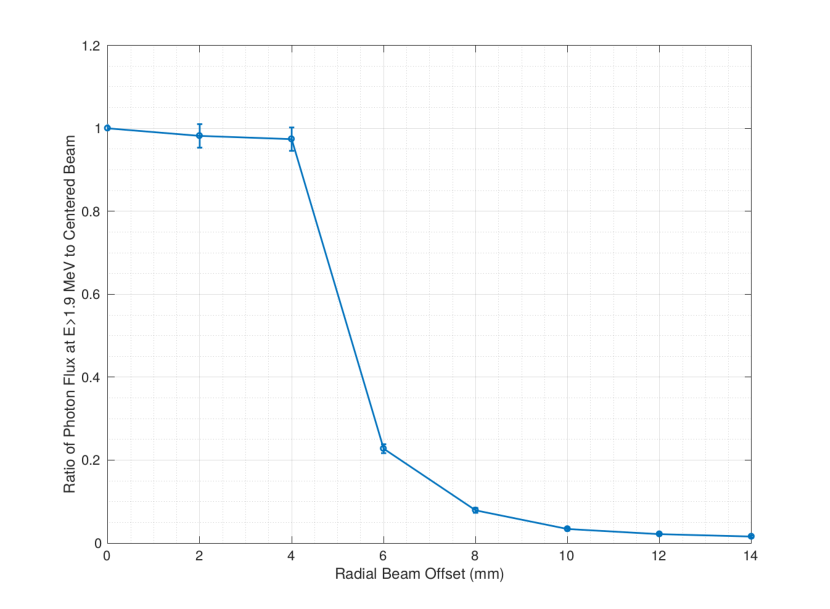
To study possible magnitude of this effect, the effect of beam wander on the bremsstrahlung spectrum was simulated using the Geant4 toolkit Agostinelli et al. (2003). In this simulation, the geometry of the bremsstrahlung radiator and collimator were modeled in detail based on experimental survey of the objects, shown in Fig. S8, and electron beams of energy 2.6 MeV were simulated incident upon the radiator at different positions. The simulated beams were infinitely narrow and incident normal to the face of the radiator. The incident position of the beam was varied radially from the center of the gold foil ( mm) to beyond the foil radius so that the electrons were directly incident on the copper frame ( mm). For each beam position, the number of bremsstrahlung photons incident on the mock warhead target (i.e., beyond the collimator) was counted and compared to the number generated when the beam was centered at the same electron current. The results of this study are shown in Fig. S9, plotted as the ratio of the number photons generated above 1.9 MeV (i.e., in the NRF region of interest) for a given beam position to the number generated with the beam on center. The simulation shows that while the beam remains on the gold foil ( mm) the number of high energy photons remains within a few percent of the ideal value. For mm, the high energy photon count drops precipitously. Thus, as long as the beam remains on the foil throughout the experiments, the beam position uncertainty contributes a systematic uncertainty of at most 1% to the comparisons of different mock warheads. Large deviations in beam position, however, would have a significant effect on the data by greatly reducing the number of photons available for the NRF interactions.
During the experiments described in this work, there existed no means of concurrently monitoring the beam position and width. Prior to these experiments however, the HVRL electron beam was imaged using a beryllium oxide screen as part of the experiments conducted by another user of the facility. Using this imaging system, the electron beam focusing elements were tuned to minimize the beam diameter and maximize its positional stability for the 2.6 MeV beam energy setting required for the experiments used in this paper. The BeO screen was placed 200 cm from the dipole magnet (located at the “bend” of the beam shown Fig. S1). At this distance, the electron beam diameter could be held to smaller than the 5 cm5 cm screen and stable in position to within a few millimeters (see the video included in the supplemental materials, courtesy of C.S. Epstein). Given that the radiator foil was located approximately 20 cm from the dipole bend, and that the beam is maximally focused when exiting the dipole, it is likely that the beam was well confined to the gold foil throughout the experimental run and thus the contribution to the uncertainty on the NRF lines measurements from beam wander is limited to 1%. Since this uncertainty is negligible compared to the statistical uncertainty of the data, it is neglected in the analysis.

S2.2.3 Beam conditioning
Due to the age and the electrostatic mechanism of the HVRL electron accelerator, the accelerator had to be regularly ‘conditioned’ by running an incoherent electron plasma (as opposed to a coherent beam) through the beamline to burn off contaminants. Failure to regularly condition the beam would lead to deviations in the beam current and energy, invalidating any data collected until the beam was reconditioned. Care was taken to regularly condition the beam and monitor its stability, and any data taken during periods in which a significant beam parameter deviated from the nominal value was excluded from the main analyses. Deviations were observed as uncontrolled shifts in the measured electron beam current, shifts in the measured terminal voltage, or unexplained changes or time-variance in the spectra from the HPGe and LaBr3 detectors (which were monitored online). During the experimental run in which the data presented here was collected, typically minutes of conditioning were required for every four hours of run time. This frequency would have been higher were it not for the beam effectively being conditioned by another group’s experiment during the previous week (during which the beam imaging and tuning described in the previous section was conducted). It should be noted that a modern, dedicated accelerator facility for the purpose of an implemented weapons verification program would not face such limitations.
S2.2.4 Summary of beam effects
The combination of this flux reduction due to the beam energy, past lack of constraint on wandering of the beam condition, and less stable beam conditions in prior experiments is hypothesized to account for the factor of – ratio of predicted over observed absolute NRF rates in preliminary experiments Vavrek et al. (2017). The beam diagnostics used for the experimental campaign presented here indicate that these issues were, in general, rectified for the data presented. In particular, these analyses indicate that the beam conditions were very stable. Thus, while there may be remaining uncertainties on the absolute bremsstrahlung flux, this flux was consistent and thus relative comparisons between different mock warheads are not subject to significant uncertainties from the beam conditions. Such cancellation of consistent, systematic uncertainties is an inherent advantage of any template verification system.
Appendix S3 Analysis of data from multiple detectors
S3.1 Data unification
For each measured object, data from multiple acquisition periods and three separate detectors is combined into a single spectrum in order to improve the signal-to-noise ratio. First, the count rate (counts per live second per µA) in the bin of detector ’s spectrum is the live-charge-normalized sum of bin contents (i.e. raw counts) in each of the runs:
| (S13) |
where is the average beam current recorded in run , and the live time is computed from the real time s and the detector dead time fraction (as reported by each detector’s Lynx DSA) as
| (S14) |
To build a meaningful sum across the three detectors , each histogram of rates must have an equal number of bins and locations of bin centers. This is difficult to achieve in practice, however, since each detector has a different calibration (depending on its gain and unique response function) for converting from a bin number in the range - to energy deposition in MeV. As a result, the calibrated bin widths and bin centers, in general, differ among the detectors. This is solved in post-processing by a combination of recalibration and histogram interpolation. As a common starting point, each histogram is linearly recalibrated using its peaks at MeV (pair production), MeV (U-238 passive signature), and MeV (Al-27 NRF emission), all of which are prominent in the beam-on spectrum. A new histogram with keV-wide bins between and MeV is then generated by interpolation of , and scaled by the ratio of new to old bin widths in order to keep constant the differential counts per unit energy. The bin errors are finally recomputed under Poisson statistics as
| (S15) |
which just amounts to reverting the live-charge-scaled spectra to count spectra, computing the bin error as the square root of the (interpolated) counts, and then re-dividing by the live charge. The detector-summed spectrum is then just the bin-by-bin sum . Note: the peak resolutions of 0.05% () at 2.2 MeV in the spectrum (after processing) were verified to be consistent with those in the individual spectra (before processing).
S3.2 Fitting procedure
The interpolated histograms (see Figs. S10–S14) are fit with an exponential background plus a series of Gaussian peaks as given in Eq. 2 of the main article. Such high-dimensional fits are achieved reliably by an iterative process: each peak is first fit individually with a five-parameter Gaussian plus linear background curve, where the initial parameter estimates and bounds for ROOT’s minimization are computed using rough linear approximations. In the case of the closely-spaced MeV and MeV lines from U-238 and Al-27, respectively, an eight-parameter doublet fit is used instead. A first-order estimate of the continuum is then made by fitting the entire spectrum (including the peaks) with a single exponential curve. The two parameters of this exponential, along with the area, mean, and standard deviation estimates of each of the six peaks, are then input directly as starting estimates for the full 26-parameter fit. Parameter bounds are established in a similar fashion by allowing some tolerance around the starting estimates.

meas.
warhead
summed live charge
Al-27 fit peak rate
U-238 fit peak
sum
Al-27 discrepancy
U-238 discrepancy
figure
[µA]
[(µAh)-1]
[(µAh)-1]
(vs
template)
(vs template)
0
template I
50.0
99.1 4.5
87.9 4.6
-
-
-
1
hoax Ia (100% Pb)
67.5
98.7 6.5
140.8 4.8
0.051
7.9
S10
2
genuine candidate Ig
61.0
105.3 6.8
99.4 4.8
0.76
1.7
S11
3
hoax Ib (100% Pb)
54.8
112.0 6.0
153.4 4.8
1.7
9.8
S12
4
template II
53.7
69.9 7.5
59.0 3.4
-
-
-
5
hoax IIc (100% Pb)
42.9
72.7 8.4
109.9 3.4
0.25
10.7
S13
6
hoax IId (50% Pb)
73.7
85.8 3.6
84.6 4.5
1.9
4.6
S14
Live charge, Al-27 fit rate, and U-238 fit rate are summed
over three detectors. U-238 fit rate is additionally summed over six peaks. Uncertainties are 1 SD.
Appendix S4 Extrapolation calculations for realistic warhead measurements
The extrapolations to more realistic warhead models and future dedicated verification systems are computed using Eq. S11, which predicts the detected count rate of a single NRF line for a given encryption foil and warhead geometry. All calculations assume isotropic NRF emission for simplicity (especially when spin states are unknown in e.g. U-235), and use the same Pb filter transmission probability function , intrinsic peak detector efficiency , and single-detector geometric efficiency used in this work’s experiments. The incident bremsstrahlung spectrum is computed in a Geant4 simulation of the 126 µm Au radiator with an electron beam energy of 2.521 MeV as determined in Fig. S6, and it is assumed that the simulated flux accurately predicts the flux that would be observed in the laboratory. For use in Eq. S11, is approximated as a pencil beam impinging on the axis of a concentric-shell warhead. Calculations for different warhead models assume different foil compositions (though maintain the mm thickness) and therefore consider different NRF lines depending on whether a uranium or plutonium component would need to be verified. In both cases, the NRF line used in Eq. S11 is chosen as the ground-state transition with the highest integrated cross section based on the values in Table I of Bertozzi et al. (2008), excluding those (in particular, the Pu-239 2143.56 keV transition) with poorly-understood nuclear level schemes. In all scenarios, a Pb hoax is constructed by replacing a weapon-isotope component with the same areal density of Pb. The runtime (quantified in ‘detector live microamp hours’, i.e. the triple product of the number of detectors, the beam current, and the live time) required to distinguish the NRF count rates and of the genuine and hoax warheads at a confidence of is computed as
| (S16) |
where the triple product is assumed to be equal in the two measurements. Table 2 in the article lists the results of these calculations for six different warhead geometries. The extrapolation calculations given in the article, for instance, use 30 detectors and a 5 mA current to arrive at a measurement time of roughly 20 minutes (per object) for the second entry of Table 2. These calculations use only the counts in a single NRF line, but summing the lines from a single isotope will increase the statistics and reduce the quoted required measurement times.
We note that for more realistic (i.e. non-slab) geometries, the precise alignment of the beam, warhead, foil, and detectors may become important for the prediction of absolute NRF count rates in a verification measurement. These systematic factors will cancel in the verification measurement, however, if they are kept constant between template and candidate measurements. For completeness, we estimate here the effect of a misalignment of the warhead transverse to the beam, which effectively changes the warhead thickness . If we take for simplicity a nominal spherical shell of DU with inner and outer radii of 6.3 and 6.5 cm, respectively, and measure until 2000 counts are obtained in the 2.176 MeV line of U-238, we find (using Eq. S11) that a discrepancy in the observed 2.176 MeV rate requires a misalignment of approximately cm. Such displacements may also affect the solid angle integration of Eq. S11, changing the geometric efficiency by factors on the order of , depending on the foil-to-detector distance. However, geometric control on scales cm is feasible with appropriate survey equipment. This effect is further mitigated by the fact that the bremsstrahlung beam has a spatial width and thus samples an extended area of warhead at a given time. For these experiments, the opening half-angle of the cone of beam was approximately and the photon illumination in this cone was relatively uniform (to better than 10%). The collimation of the beam could be adjusted to further cancel misalignment effects by adjusting the size and uniformity of the beam spot on the inspected object. Finally, manufacturing tolerances in the warheads or true warhead-to-warhead variation in component sizes may also affect the results of the template measurement, but estimates of such variations are not available in the open literature.
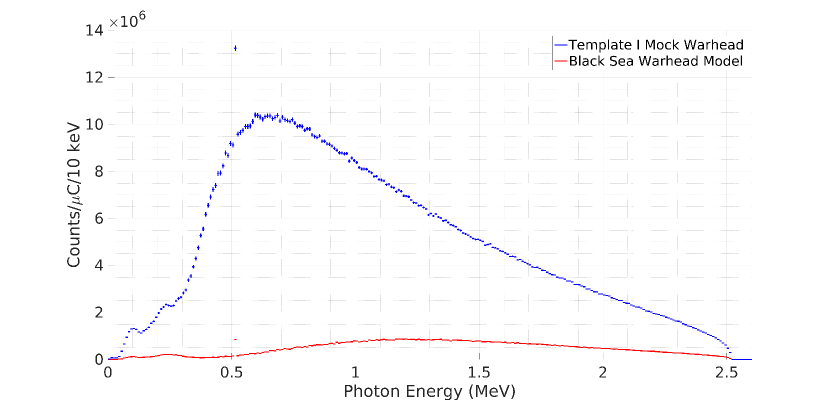
An additional concern regarding extrapolation to measurements at mA-scale beam currents is the capability of the HPGe detectors to handle the event rate increase and the additional loss of live time to pile-up events. While a 5 mA current will produce 200 as many bremsstrahlung photons relative to the 25 µA currents of the experiments described in this article, the rates in the HPGe detectors will increase by a lesser factor. Realistic inspection objects will be larger than the mock warheads used for this work and thus will prevent a greater fraction of the beam from reaching the encryption foil. Since the event rate in the HPGe detectors is dominated by photons scattered from the foil, this attenuation reduces the event rate in the detectors. To estimate the size of this effect the transmission of the bremsstrahlung beam through the warhead test object to the encryption foil was simulated for two scenarios — the “template I” mock warhead and the WGPu+DU “Black Sea” warhead model consisting of spherical shells of WGPu, high explosives, and a uranium tamper Fetter et al. (1990b). Fig. S15 shows the transmitted spectrum through each of these objects per 1 µC of electron beam on target. The total transmitted photon rate through the mock warhead is approximately 11 times higher than that of the more realistic Black Sea model, and the rate at the high end of the spectrum (2 MeV) is approximately 6 times higher for the mock warhead. Since photons are more likely to eventually cause events in the detectors if they strike the foil at high energies, the latter factor of 6 is taken as a conservative estimate of the rate reduction due to the thicker warhead. Thus, the increase in the event rate in the detectors between the experiments described in this work and a realistic warhead under inspection with a 5 mA electron beam current will be approximately 30. At this rate, the dead time fraction due to pile-up events would be 60% while the increase in the fixed event rate processing would result in a total dead time fraction of 90%. This corresponds to a live time reduction of approximately an order of magnitude relative to the mock warhead experiments. This may be mitigated in a future realistic verification scenario by increasing the number of detectors to directly increase the live time, and in the future it is likely that HPGe detectors capable of operating at MHz-scale rates will be available that would be more than sufficient for this application Fast et al. (2013). Additionally, the 5 mA beam current assumption here is merely a starting point to provide a reference for estimated measurement times and may be optimized to achieve a balance between detector rates and measurement times. As also noted in the text, minimal effort was made to optimze the low-energy photon filters in front of the HPGe detectors for this experiment and it is likely that further rate reductions could be achieved by optimized shielding.
Appendix S5 Multi-line inference
The equation for the predicted NRF rates (Eq. S11 or its integrated form), contains multiple quantities that are kept secret from the inspector, and thus cannot be used alone to infer the warhead thickness from a physically-encrypted spectrum. However, it is possible to develop a system of equations from Eq. S11—one equation per NRF peak—in which case there may be at least as many equations as unknowns and inference may be possible. This technique may be especially straightforward to realize by using two NRF lines of the same isotope with similar resonance energies , such as the 2.176 MeV and 2.209 MeV U-238 lines (if the latter were not obscured by the the 2.212 MeV Al-27 line) in any of the above NRF spectra. Taking a ratio of Eq. S11 for the two lines allows one to cancel systematic factors such as the , , and number densities , and to approximately cancel slowly varying functions of energy such as or perhaps even . If the are canceled, the ratio of observed counts may then be used to estimate the foil thickness , which could in turn be used to estimate ; more complicated procedures are required if only the are canceled. This information security question may be solved by use of the encryption plates, which obscure the true value of and permit inference only on some upper bound .