ALMA observations of molecular absorption in four directions toward the Galactic bulge
Abstract
Context. Alma Cycle 3 observations serendipitously showed strong absorption from diffuse molecular gas in the Galactic bulge at -200 km s km s toward the compact extragalactic continuum source J1744-3116 at (l,b)= -2.13,-1.00.
Aims. We aimed to test whether molecular gas in the bulge could also be detected toward the three other, sufficiently strong mm-wave continuum sources seen toward the bulge at .
Methods. We took absorption profiles of (1-0), HCN(1-0), CH(1-0), CS(2-1) and HCO(1-0) in ALMA Cycle 4 toward J1713-3418, J1717-3341, J1733-3722 and J1744-3116.
Results. Strong molecular absorption from disk gas at km s was detected in all directions, and absorption from the 3 kpc arm was newly detected toward J1717 and J1744. However, only the sightline toward J1744 is dominated by molecular gas overall and no other sightlines showed molecular absorption from gas deep inside the bulge. No molecular absorption was detected toward J1717 where H I emission from the bulge was previously known. As observed in , HCN, CH and CS, the bulge gas toward J1744 at km s has chemistry and kinematics like that seen near the Sun and in the Milky Way disk generally. We measured isotopologic ratios N()/N(HCO) for the bulge gas toward J1744 and and for the disk gas toward J1717 and J1744, respectively, all well above the value of 20-25 typical of the central molecular zone.
Conclusions. The kinematics and chemistry of the bulge gas observed toward J1744 more nearly resemble that of gas in the Milky Way disk than in the central molecular zone.
Key Words.:
interstellar medium – abundances; B1741-3121 Introduction
In a recent paper (GerLis17) we discussed the serendipitous discovery of strong molecular absorption at -210 km s v -135 km s toward the compact extragalactic continuum source J1744-3116 (aka B1741-312) at = -2.13,-1.00, along a line of sight passing through the inner portions of the Galactic bulge outside the central molecular zone (CMZ; MorSer96). We extracted the run of IR K-band extinction with distance modulus from the 3-D extinction maps of SchChe+14 and showed that the K-band extinction in the bulge implied the existence of unseen gas, given the weakness of H I emission at high negative velocities characteristic of the bulge. The column density inferred from absorption matched the amount of gas lacking in H I.
As we discussed, the quantity of molecular gas in the bulge outside the CMZ, at 1.2 or galactocentric radius 180 pc R 1500 kpc at the IAU standard distance R = 8.5 kpc, is rather uncertain. The total mass of H I in the bulge is comparable to the mass of in the CMZ, M(H I) (BurLis78), raising the possibility that the mass of molecular gas in the bulge is yet larger.
Mm-wave absorption toward J1744 from a wider range of species was subsequently discussed by RiqBro+17 who pointed out some of the same similarities between the chemical composition of the bulge and disk gases that are noted here. In the present work we re-observed molecular absorption toward J1744 with more complete spectral coverage than in our earlier discussion, at much higher spectral resolution than in our earlier work or in RiqBro+17. We also searched for similar absorption toward the few (three) known, strong mm-wave continuum sources lying toward the bulge within 3 of the Galactic plane. All of the newly-observed sightlines lie much further from the Galactic center than J1744, and none of them show molecular absorption at velocities characteristic of gas deep inside the bulge: we did find two weak features arising in the 3 kpc arm (Ban77; Ban80; DamTha08).
The plan of this work is as follows: in Sect. 2 we describe the new and existing observational material that is discussed. In Sect. 3 we briefly summarize some properties of the observed sightlines and the disk gas that is present along them. In Sect. 4 we present new observational results leading to a better characterization of the bulge gas toward J1744: it has a chemistry and cloud structure comparable to that seen in , CH, HCN and CS in diffuse molecular gas near the Sun and, unlike material in the CMZ, is not enhanced in C. Section 5 is a summary and discussion.
2 Observations and data reduction

2.1 New ALMA absorption measurements
We observed the J=1-0 lines of , HCO, HCN and CH, and the J=2-1 line of CS J=2-1 in absorption toward the four continuum sources listed in Table 1. The work was conducted under ALMA Cycle 4 project 2016.1.00132.S whose pipeline data products were delivered in 2017 February. The spectra discussed here were extracted from the continuum-subtracted pipeline-processed data cubes at the pixel of peak continuum flux in the continuum map made from each spectral window, and divided by the continuum flux in the continuum map at that pixel. Fluxes at 89.2 GHz ranged from 0.33 Jy for J1713 to 0.93 Jy for J1733. Each spectrum consisted of 1919 semi-independent channels spaced 61.13 kHz corresponding to 0.205 km s at the 89.189 GHz rest frequency of or 0.187 km s for CS(2-1) at 97.981 GHz: the channel spacing is half the spectral resolution. Velocities presented with the spectra are taken with respect to the kinematic definition of the Local Standard of Rest.
2.2 Other data
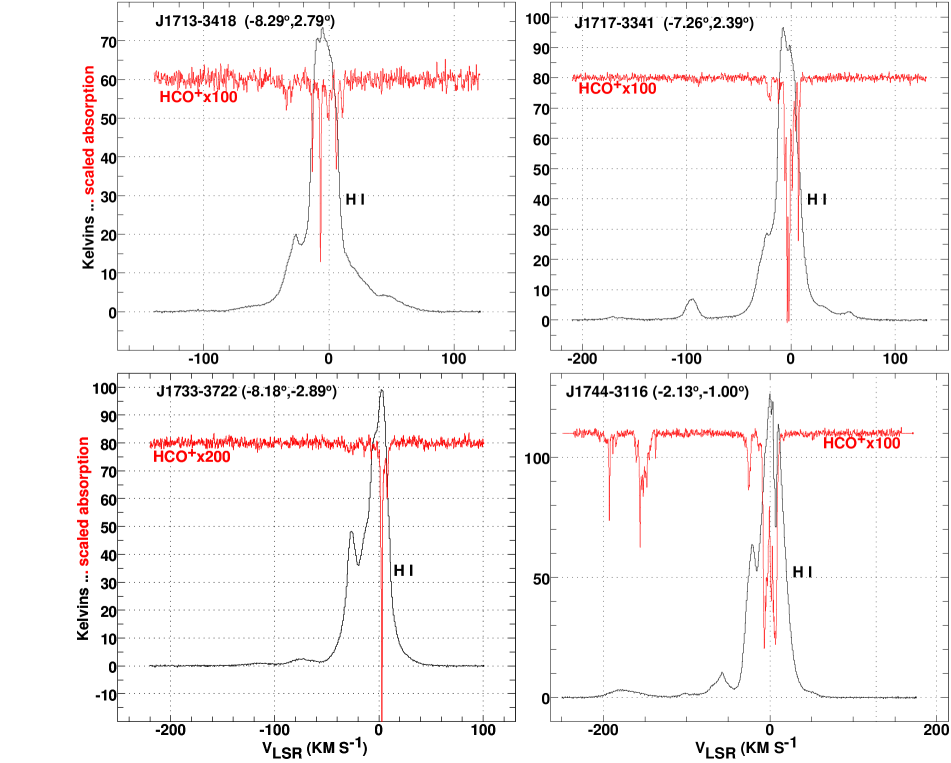
In Figure 1 we compare our spectra with Galactic All-Sky Survey (GASS) III 21 cm H I emission spectra (KalHau15). For the sources J1717 and J1744 we use the H I absorption profiles of DicKul+83 to derive an optical depth-corrected column density of atomic hydrogen as
where and T are the optical depth and brightness temperature and the units of velocity are km s. In this work, N(H) is the column density of H-nuclei in neutral atomic and molecular form,N(H) = N(H I)+2N().
We also use the CS and HCN absorption profiles for local clouds from LucLis02 and LisLuc01, respectively, and the and CH measurements of LucLis00C2H.
2.3 Extinction
We cite the 6 resolution dust-emission maps scaled to optical reddening E by SchFin11 and the 3-D IR extinction map of the Galactic bulge of SchChe+14 at the same resolution, from which we cite values of the K-band extinction A.
3 Disk gas toward the 4 targets
Profiles toward all sources are shown in Figs. 1-3 and some general properties of the sightlines are given in Table 1. All directions show strong molecular absorption from gas in the Galactic disk around zero velocity but only the sightline to J1744 passes inside galactocentric radius R = 1 kpc and only that sightline shows strong molecular absorption from gas deep inside the Galactic bulge.
The sightline to J1744 is also the only one for which the gas column density is dominated by molecular gas, mostly from the disk contribution around 0-velocity. The species-by-species chemistry of this gas is not a major focus of this work, but is shown in Sect. 4 along with a variety of other data that are used as a basis of comparison with the bulge gas. Chemistry of the disk gas toward J1744 was discussed for a broader range of species observed in a low spectral resolution spectral scan by RiqBro+17, whose conclusions agree with ours regarding the similarity of the disk and bulge diffuse molecular gas components.
Although some of the molecular gas must be quite close to the Sun, for instance material in the Heeschen Cloud (Hee55) that is responsible for the H I self-absorption toward J1744, it is hard to place the disk gas in Galactic perspective . The line of sight velocity gradients due to Galactic rotation are quite shallow at the small longitudes of our sources: for a flat rotation curve with km s, a location 5 kpc from the Sun has v km s toward J1744 or v km s toward the other sources. Moreover, much of the low-velocity absorption occurs at positive velocities that are inconsistent with rotation. Positive velocities could arise from a combination of random motions and streaming associated with spiral arms, although gas at v 30 km s most likely arises inside the Galactic disk.
The fraction falls monotonically with separation from the Galactic equator: only the line of sight toward J1744 at b=-1 has a molecular fraction exceeding 50%. The optical depth corrections to N(H I) in the two directions with measured H I absorption profiles are 35%-45% of the optically thin value, but these sightlines have relatively high fractions and the correction to N(H I) is smaller than 2N().
3.1 C/C in the disk gas
Profiles of the carbon isotopologues of are shown in Fig. 3 and results for their profile integrals and ratios of column densities are given in Table 2. Column densities are derived from integrated optical depths in the limit of no rotational excitation above the cosmic microwave background, for a molecular dipole moment of 3.92 Debye (eg AndKoh+16). From this it follows that N() = and N(HCO) in units of km s, accounting for the lower line frequency of the heavier isotopologue. Error estimates for the integrated optical depths in Table 2 include effects associated with the appreciable optical depths in , which were estimated using the measured rms line/continuum ratios in absorption-free regions in channel-by-channel Monte Carlo simulations of the observed profile taken as the expectation value.
We have precise measurements of the carbon isotopologues toward two sources: N()/N(HCO) toward J1717 and N()/N(HCO) toward J1744. This is well below the Solar isotopic abundance ratio 89, but typical for gas near the Sun observed in mm-wave absorption by LucLis98. However, some of the disk gas observed here could be situated well inside the Solar Circle where the C/C ratio is known to be smaller (MilSav+05), although still well above the very small values 20 - 25 characteristic of the CMZ (Wil99; RiqAmo+10).
3.2 H I spin temperature in the self-absorbed gas toward J1744
The line of sight to J1744 is the exceedingly rare case where H I absorption (DicKul+83) has been measured in a direction where the H I emission is self-absorbed. Earlier (GerLis17) we showed that the H I self-absorption is coincident with CO J=1-0 emission. Here we show how the combination of H I absorption and self-absorption can be used to derive an upper limit on the spin temperature of the H I self-absorbing but largely molecular gas.
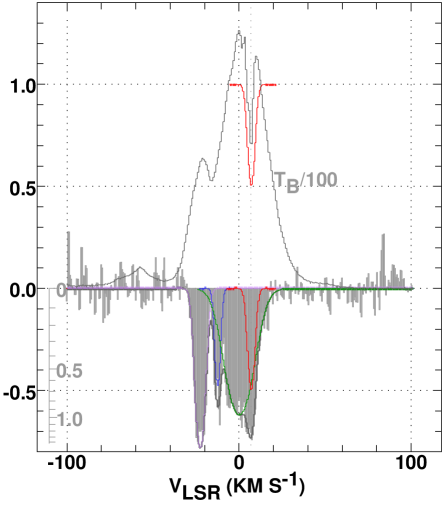
We define T as the observed brightness temperature of the H I emission and T as the hypothetical brightness temperature in the absence of self-absorption: extrapolating across the self-absorption feature by Gaussian fitting of the H I emission gives T = 125.2 K in the center of the H I self-absorption trough where T = 71.1 K. We also define the optical depth derived from the absorption profile of DicKul+83 as the sum of foreground and background contributions and define T and T as the spin temperatures of the foreground and background emitting gases, respectively. Then the two equations
and
can be solved for the spin temperatures of the foreground and background gases as functions of the value of . The minimum optical depth of the foreground gas is when T K. This can be compared with the total optical depth in the middle of the H I self-absorption trough, , and it implies a fairly high minimum spin temperature for the background gas seen in emission: and T K.
The implied spin temperature of the foreground self-absorbing gas increases as increases above 0.58 and the maximum optical depth, , corresponds to = 48K that is typical of gas observed in H I absorption generally (HeiTro03). Of course it is not realistic to assign all of the optical depth to any one component of the H I and an improved upper bound on the spin temperature of the self-absorbing gas follows from showing that the optical depth of the self-absorbing gas is below 1.22. To this end we decomposed the H I absorption profile of DicKul+83 as summarized in Table 3 and illustrated in Fig. 4. A kinematic component is found coincident with the self-absorption, having a center optical depth corresponding to K. This result unfortunately spans the range of kinetic temperatures from dark (10 K) to diffuse (25 K) molecular gas and does not allow us to decide in which regime the foreground gas exists.
The precision of the present result is limited by the noise level in the rather old absorption profile of DicKul+83. This could be improved by taking a more sensitive and contemporary H I absorption profile toward J1744, and extended by taking H I absorption profiles toward other positions with apparent H I self-absorption, which is relatively common in sightlines through the Great Rift in the inner Galaxy. Further insight into the foreground gas toward J1744 could also be obtained by observing in emission, and by observing CO or in absorption.
4 Gas inside the Galactic disk
This work shows more clearly the nuclear bulge gas at v km s toward J1744 that was discovered in our earlier work (GerLis17) (see also RiqBro+17) but otherwise we did not detect gas inside the Galactic disk except for weak features arising in the 3 kpc arm at -90 km s toward J1717 (Fig. 1) and at v = km s toward J1744.
4.1 Cloud structure and chemistry in the bulge gas toward J1744
4.1.1 Strucure and kinematics
As discussed in GerLis17, especially their Table 1 and Fig. 4, gas at v toward J1744 arises in the Galactic bulge at galactocentric radii 320 pc R pc where 320 pc is the distance of closest approach to the center and the outer radius depends on the contribution of non-circular motion to the observed velocity. A purely circular description of the motion would place all the gas at R pc.
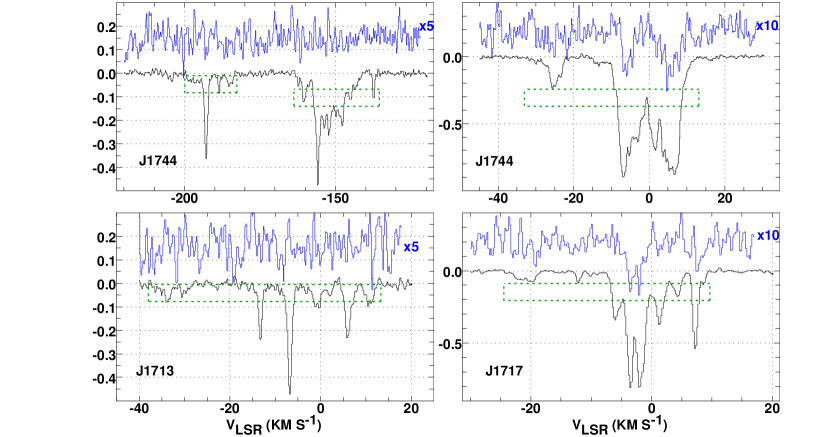
No matter what velocity field is adopted, the line of sight velocity gradient is very steep and the 20-25 km s velocity intervals over which the molecular gas is seen, -205 v -185 km s and -160 v -135 km s, correspond to only 100-150 pc along the line of sight. In each of these intervals, absorption more nearly fills the velocity range (Fig. 5), analogous to what is seen in gas near the Sun: local absorption is more ubiquitous than absorption in HCN or CS and the column densities of HCN and CS increase substantially for individual features having N() or W km s (LisLuc01; LucLis02).
A closer view of the absorption in the bulge gas is presented in Fig. 5. This figure shows that absorption from CS and HCN is almost entirely concentrated in narrow-lined features having profile FWHM km s. also shows these (and other) narrow features, although in they are superposed over a broad and presumably more nearly volume-filling component that also appears weakly in HCN at v -160 km s.
The appearance of so many narrow features, and so much kinematic substructure in the broader absorption is uncharacteristic of gas observed at small galactocentric radii. It likely arises because of the u nusual circumstances under which the gas is being observed. The extremely large line of sight velocity gradient can kinematically separate gas parcels that are near each other in space and have little relative motion with respect to each other. In this way, spatial substructure is revealed that would otherwise remain hidden. If seen locally the same gas distribution would be narrower in velocity and the substructure seen toward J1744 would be blended together.
4.1.2 Chemical comparisons in the bulge gas
To illustrate the chemistry of the bulge gas, comparing HCN and CS column densities, we decomposed the line profiles of HCN and CS into gaussian components as shown in Tables 4-5. To account for the HCN components that are not apparent in CS (the feature at -151.8 km s and the broad line at -155.5 km s) we subtracted the gaussian fits in the CS profile and integrated the remainder CS profile over the ranges of the HCN components.
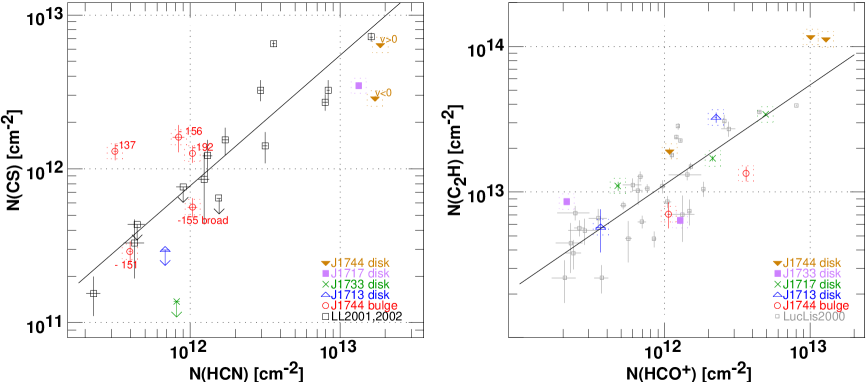
The results are presented in terms of HCN and CS column densities in Fig. 6 at left where we also include results for the local gas seen earlier at high Galactic latitude (LisLuc01; LucLis02) and for the disk gas toward the four sightlines studied in this work. In fact, the HCN and CS column densities and their ratios in the bulge gas are very similar to those seen in local gas, with the exception of a high CS/HCN ratio in the feature at -137 km s. Comparably high CS/HCN and CS/ ratios are occasionally inferred from unpublished emission measurements we have made in the vicinity of the continuum background targets used by LisLuc01 and LucLis02 to study local gas in absorption. CS absorption is comparatively weak in the Galactic disk gas toward J1733, and at v 0 km s toward J1744. Similar conclusions regarding the similarity of disk and bulge gas are evident in the figures of RiqBro+17
The hydrocarbon chemistry is illustrated at right in Fig. 6 where we compare CH and in the new data with that shown earlier by LucLis00C2H. The bulge gas toward J1744 is at the lower edge of the range of CH/ abundance ratios but still within a factor two of the regression line through the older data.
4.2 C/C in the bulge gas seen toward J1744
and HCO profiles are shown in more detail for three sources in Fig. 3. The profiles toward J1744 are shown in two parts corresponding to gas in the nuclear bulge at v km s and Galactic disk material at v -40 km s, separately scaled. Fig. 3 shows various velocity intervals over which the profiles were integrated to determine column densities, as given in Table 2 .
For the gas in the nuclear bulge observed at v km s toward J1744 (Table 2) we have only a weak limit C/C 17 for the sub-interval v -190 km s, but C/C 51 overall and separately over the sub-interval km s. Apparently, this gas is not enhanced in C, which is very different from the values C/C 20-25 seen in the CMZ (Wil99; RiqAmo+10). This could be disk gas that entered the bulge recently, or gas resident in the bulge that has never been astrated beyond the values characteristic of the disk in the inner Galaxy.
4.3 Inner-Galaxy gas along the line of sight to J1717
As shown in Fig. 1, H I emission from the bulge is present toward J1717 at -200 km s v -140 km s: this was modelled as part of the tilted H I inner-galaxy gas distribution by BurLis78. The H I column density N(H I) is comparable to that seen toward J1744 at -165 km s v -135 km s, N(H I) (GerLis17), but the bulge gas toward J1717 is not dominated by : the limit on 2N() found by integrating the profile is 2N() .
As also shown in Fig. 1, a strong H I feature corresponding to the 3 kpc arm (Ban77; Ban80; DamTha08) is present toward J1717 at v km s. absorption is also present toward J1717 over the range -125 km s v -75 km s but the gas is only weakly molecular: we find N(H I) and 2N() , or f .
4.4 The far-side 3 kpc arm toward J1744
As seen in Fig. 1 there is a weak wing of H I emission at v km s toward J1744, and weak absorption as well. Integrating over the velocity range 40-60 km s we find N(H I) , 2N() , ie, the gas is 48% molecular.

| Source | l,b | S | A | N(H I) | N(H I) | 2N() | N(H) | f | N(H)/A | |
|---|---|---|---|---|---|---|---|---|---|---|
| , | Jy | kpc | mag | mag | ||||||
| J1713-3418 | 0.93 | 1.23 | 0.40 | 0.43 | (0.64) | 0.18 | (0.82) | (0.22) | 1.53 | |
| J1717-3341 | 0.49 | 1.08 | 0.66 | 0.54 | 0.78 | 0.53 | 1.31 | 0.40 | 1.98 | |
| J1733-3722 | 0.60 | 1.21 | 0.60 | 0.56 | (1.13) | 0.11 | (1.24) | (0.09) | 1.12 | |
| J1744-3116 | 0.33 | 0.32 | 1.46 | 0.90 | 1.20 | 1.93 | 3.13 | 0.62 | 2.14 |
R, R pc
values from SchChe+14; E(B-V)/A (SchFin11)
N(H I)
N(H I) from Eq. 1
N() = N()/, N()
f = 2N()/(N(H I) + 2N())
Parenthesized quantities assume N(H)/A = mag, the average for J1717 and J1744