Attack Vulnerability of Complex Networks in Center-Based Strategies
Abstract.
Central nodes are critical in establishing structural connectivity in a complex network. Attacking such nodes can create real havoc in a complex system. We propose attack strategies based on four types of centers, namely betweenness center, degree center, median, and center. We study the vulnerability of synthetic as well as real-world networks in these center-based attacks. These attacks are node-removal attacks which involve identifying the central node set and removing them from the network. We observed that the attacks based on recalculated network information are more efficient than ones based on initial network information. This work shows that the median-based attack, which is a novel strategy proposed in this work, is highly destructive in real as well as synthetic networks.
Complex networks, Vulnerability, Graph theory, Center-based attacks, Recalculated attacks.
2000 Math Subject Classification: 34K30, 35K57, 35Q80, 92D25
1. Introduction
Analysis and prediction of behavioural dynamics of complex systems require a thorough study of their underlying network structures. Real-life networks like biological networks handle a massive amount of data. Such big-data networks are becoming larger and complex over time. And so are the tools for modelling and analyzing them. Network science is one of those scientific disciplines which has been emerged by converging the commonalities in many multi-disciplinary research fields. It is a highly specialized as well as an inter-disciplinary subject. One way for studying real networks is by modelling approximate structures. Graph theory enables such a modelling. The well-studied theories and methods in graph theory can aid in the mathematical description of large and complex networks. Network analysis has found new directions with the incorporation of graph-theoretic concepts in such studies and the advent of complex network theory.
Network security is an all-time relevant research topic. Security threats on complex networks can be either random or targeted. An attacker can either remove or default a functioning node or edge in the network. In targeted attacks, the attacker needs to identify the potential nodes/edges in the network and destroy them. Based on the type of entity being attacked we can term the attacks as node-targeted or edge-targeted attacks. Analyzing attack vulnerability in synthetic networks (network models) can give insights into how real-world networks behave in such attacks. Such studies are highly recommendable while designing robust and error-tolerant networks. While studying vulnerability, it is always desirable to compare the behaviour of synthetic and real-world networks. Here arise the need for a uniform metric for network vulnerability. Size of the largest connected component () in the network can be considered as one such metric. In this paper, we focus on the vulnerability of synthetic as well as real-world networks in center-based attacks. Center-based attacks are node-removal attacks which involve identifying the central node set in the initial network and removing them from the network. Four types of centers are considered here. They are
-
(1)
Betweenness center
-
(2)
Center
-
(3)
Degree center and
-
(4)
Median
First, we present a roadmap of the related works in vulnerability analysis of complex networks (Section 2). Familiarisation of the terminologies associated with this study (Section 3) follows. The attack strategy is defined in Section 4. In the following section (Section 5) we analyse the robustness of synthetic networks. The network models considered here are:
-
(1)
Random Network - Erdős-Rényi (ER) model
-
(2)
Small-world Network - Watts-Strogatz model
-
(3)
Scale-free Network - Barabási-Albert model
In the next section (Section 6) we analyse the vulnerability of real-world networks. The networks are chosen from different domains areas. They are
2. Related Works
Research in vulnerability analysis of complex networks has been particularly active during the last decade. Albert et al. in 2000 [1] studied the error and attack tolerance of complex networks. In this work, they observe that scale-free networks show an unexceptionally high level of robustness. At almost the same time, Holme et al. (2002) [23] observed that the behaviour of real-world networks towards node-attacks was very much different from that of network models. Therefore they suggest that there might be other structural phenomena which contribute to the behaviour of real networks in attacks. Motter and Lai (2002) [30] studied the security threat to complex networks by the cascade of failures due to intentional attacks. Their findings underline that many real-world networks which are naturally heterogeneous (and survive random attacks) are in fact highly prone to such cascading failures. Later Motter himself proposed a strategy for defending such attacks in heterogeneous networks [31] in 2004. Following these findings, Crucitti et al. in their work [12] introduced a model which depicts that attack on a single node is sufficient to destroy the efficiency of the entire network.
Attack vulnerability is also an indication of many structural and dynamic features of networks. Goldshtein et al. [19], in 2004, studied the hierarchy of complex networks based on its vulnerability measures. Thus the quantification of vulnerability measures turns out to be of relevance in network analysis. Boccaletti et al., in 2007, proposed measures to quantify the multiscale evaluation of vulnerability [6]. Mishkovski et. al. [29], in 2011, proposed a metric for vulnerability measurement. This metric was based on average edge betweenness.
Investigations on the behaviour of complex networks towards different types of attacks flourished recently. One notable contribution among them is the node-removal strategy proposed by Bellingeri et al. (2014) [7]. They observed that the efficiency of strategies depends very much on the network topology. Another closely related contribution is by Nie et al. (2015) [35] in which they proposed two new attack strategies based on both degree and betweenness. They found that these strategies were highly efficient than traditional ones based on degree alone. Attack strategies based on paths were introduced recently. Pu and Cui (2015) [36] proposed attack strategies based on longest paths and observed that homogenous networks are fragile in this category of attacks. Another most recent work in this regard is the shortest path-attacks proposed by Hao et al. (2016) [21]. They found that small world models are highly robust towards such attacks.
During each iteration of an attack, the network attributes undergo tremendous changes. The initial network attributes may no more remain invalid. Therefore after each iteration of attack, it is desirable to recalculate the network measures based on which the attack is proposed. In 2002, Holme et al. (2002) [23] observed that the attack strategies based on recalculated information are more harmful than the strategies based on initial information. While investigating the identification of vital nodes in complex networks, Lu et. al. [27] also noticed that the strategies based on adaptive recalculation are more efficient than the straightforward methods.
Real-world networks are mostly weighted networks. Vulnerability analysis of weighted networks is a new area of research. Bellingeri and Cassi, in their new paper [8] (2017), focus on the change in efficiency of attacks due to weights in the networks. Their work suggests that the vulnerability analysis without considering the weighted structure of networks could be at times misleading.
3. Terminology
3.1. Graph distances and centers
Two vertices and in a graph are said to be adjacent if there is an edge joining and . The order of is defined as and size of as . Distance between two vertices and in a graph, denoted by is the length of a geodesic (shortest path between and ).
- Eccentricity and center:
-
Eccentricity of a vertex on is defined as
where is the length of a shortest path in G. A center vertex is a vertex with minimum . The set of all center vertices is the center set of and is denoted by [9].
- Betweenness and betweenness center:
-
Betweenness of vertes in denoted by or simply may be defined as
where denotes the number of shortest - paths passing through and , the number of shortest - paths. The betweenness center of a graph is a vertex with minimum . The set of all betweenness center vertices is the betweenness center set of and is denoted by [17].
- Remoteness and median:
-
Remoteness of vertex on is defined as where is the length of a shortest path in G. A median vertex is a vertex with minimum . The set of all median vertices is the median set of and is denoted by [9].
- Degree and degree center:
-
Degree of vertex on , , is the number of edges incident to the vertex . Degree center of a graph is a vertex with maximum . The set of all degree center vertices is the degree center set of and is denoted by .
Graph center and median represent global centers of the graph; whereas a degree center can be considered as a local center. Another center considered in this study is the betweenness center, which is related to the geodesics in the graph. To get an insight into the relevance of graph distances in complex networks see [18] and refer [40] for more details on center notions in complex networks.
3.2. Network models
Theoretic network models studied by mathematicians are mostly random models. But in reality, networks behave in a crucially different manner than random networks. Small-world and scale-free networks are two fundamental models capturing specific architectural features of real networks.
3.2.1. Random networks
The classical model is the Erdős-Rényi model (E-R model) proposed in [16]. Degree distribution in E-R graphs is binomial which becomes Poisson when is very large (). The probability of occurance of a vertex with degree in E-R network is given by
3.2.2. Small world networks
Small world problem was first investigated by Milgram in his pioneer work [28]. He observed that an acquaintance chain between any two people is always embedded in a small-world structure (maximum six people). Most complex networks exhibit smaller diameter. The diameter increases logarithmically with the size of the network. i.e. as [15]. The most acclaimed model in this regard is the W-S model proposed by Watts and Strogatz in [39].
3.2.3. Scale free networks
This model characterizes the dynamicity of an evolving network. Barabási and Albert [2] proposed B-A model with scale-free property. This property states that degree distribution is characterized by power-law: . Evolution of such a model is governed by the law of preferential attachment. By this law, the newly added nodes prefer to connect with nodes of higher degree (hubs). Thus the degree of hub nodes continuously increases with the addition of new nodes.
4. Center-based attack: Strategy
We propose center-based attacks on complex networks in which targeted entities are the different centers as defined in Section 3. Given a network , first step of the strategy is to identify the node sets in the descending level of their centrality (/ / / ) in . An attack is performed by removing all nodes in each identified set and the edges incident on them from . The damage caused to in each attempt of node removal is calculated in terms of the size of the largest connected component in the updated . In the next iteration, the node set with next higher centrality is attacked. In order to enable the comparison of different networks, we use a normalized value [21] defined as where is the size of the initial network. The attack iterations terminate when the network is completely destructed (when ). The proposed attack strategies are:
-
(1)
Initial betweenness center attack
-
(2)
Initial center attack
-
(3)
Initial degree center attack and
-
(4)
Initial median attack
These strategies are purely based on the information of the initial network. To achieve more efficient results, it is desirable to follow an approach based on the recalculated information. In such an approach, the central node set is re-identified in the after each attack iteration and removed in the next iteration. The attacks based on recalculated centrality measures are named as follows:
-
(1)
Recalculated betweenness center attack
-
(2)
Recalculated center attack
-
(3)
Recalculated degree center attack and
-
(4)
Recalculated median attack
The strategy is depicted in Algorithm 1 and the following flowchart (figure 1).
5. Vulnerability analysis of synthetic networks
Now we analyse the vulnerability of different network models towards center-based attacks. Many algorithms exist for generating network models (Refer [3, 5, 14, 32, 38] for details). We used Pajek software [10, 11] (Batagelj, V., Mrvar, A.: Pajek - Program for Large Network Analysis.) for generating different network models. Random networks were generated using E-R model with Poisson distribution, small world networks using W-S model and scale-free networks using B-A model. The size of networks considered were with average vertex degree of . When the networks generated were disconnected; we extracted the giant component alone from the network for our experiments. Therefore the ultimate aim of the attacks was the complete destruction of the initial giant component of the network.
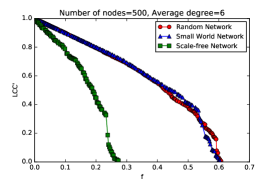
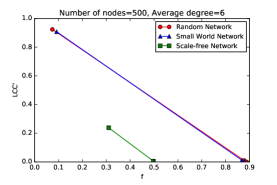
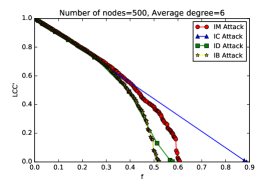
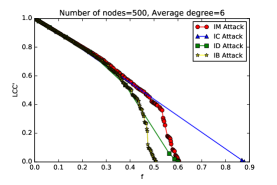
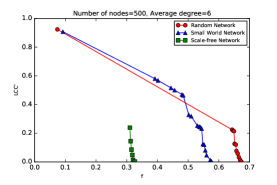
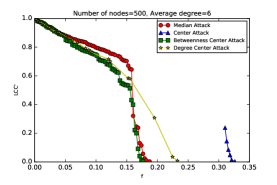
After constructing the networks using generative models, trials of attacks based on the initial network information () were carried out. The change in was analysed against the fraction of nodes removed in the attacks and compared for all the network models described above. See figure 2 for a comparison of the strategies and in the synthetic networks.
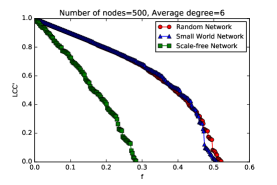
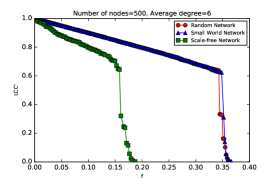
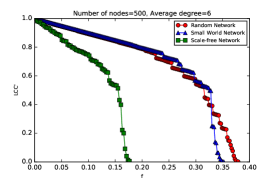
The vulnerability of the three network models to different attacks are compared and depicted in figure 3.
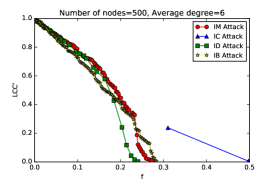
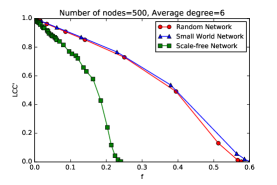
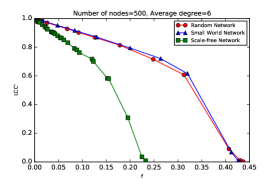
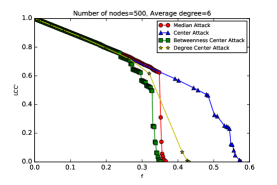
Experiments of attacks based on recalculated information were also carried out as per the strategy described in Algorithm 1. See figure 4.
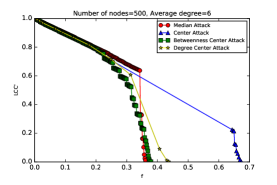
The comparison of vulnerability of each network model to different attacks is shown in figure 5.
- Damage measurement:
-
Damage caused by attacks based on both initial and recalculated betweenness center, degree center and median attacks are all the most comparable. Small world and random models were found to be equally robust in these attacks while scale-free networks were easily destructed. Also, in these attacks, networks were completely destructed at very smaller values of ( in initial attacks and in recalculated attacks) (See figures 2 and 4). But the response of networks towards attack was very much different. The networks could withstand the attacks up to and attacks up to . In this case, also scale-free networks were more vulnerable. Small world networks were completely destructed at comparatively larger ( for initial attacks and for recalculated attacks). See figures 2b and 4b. However, the tolerance of random models was found to be much better in the case of recalculated attacks (). (See figure 4b)
- Efficiency of attacks:
-
Among the initial center attacks, attacks are more efficient in small world and random networks. See figures 3a and 3c. In the case of recalculated attacks, all three models are more vulnerable to and attacks in an almost equal fashion. See figures 5a, 5c, 5b. Among them scale-free networks are the weakest ( in initial attacks and in recalculated attacks). Comparatively, the attack is less efficient. All recalculated attacks are obviously more efficient than initial attacks.
- Change in LCC’:
- Network destruction:
Summary: The general observation was that attacks based on median and betweenness are highly hazardous. The efficiency of attacks based on recalculated centers is more than the efficiency of those based on initial network centers. In synthetic networks, the efficiency of attacks was found to be ordered as in the case of initial attacks and in the case of recalculated attacks. The most efficient attack among them is . Among the three network models considered here, the scale-free networks were found to be highly vulnerable towards center-based attacks. This is because there exist a larger number of important vertices in scale-free networks as observed by Albert et.al. in [1]. They observed that scale-free networks are more sensitive towards node-removal attacks than random or small-world models. Our finding also conforms to this statement.
6. Vulnerability analysis of real-world networks
6.1. Network Science Collaboration Network
NetScience network is a coauthorship network; an undirected network with nodes and edges. The dataset was downloaded from Newman’s page [34]. Nodes in the network represent scientists working on network science. Two nodes are connected if the corresponding scientists have co-authored a publication.
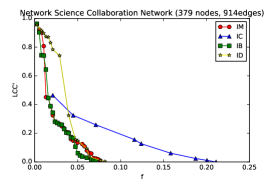
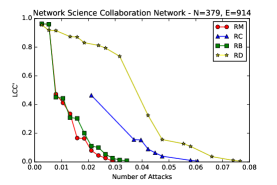
Cytoscape 3.5.0 [37] was used for visualization of the network. Network statistics were obtained using the Network Analyzer [4] of Cytoscape. After generating the network we extracted the giant component from it as we focus on the connected network only. Usually, the second largest component in a real complex network is very smaller than the largest (giant) component. This is a characteristic feature of a collaboration network as research will work only if the research community is highly connected [33]. In our experiment we consider the giant component of NetScience network which consisted of nodes and edges. A summary of statistics of the giant component of NetScience network is shown in Appendix: Table 1. We analysed the change in against in center-based attacks on the giant component of NetScience network. See figure 6.
The findings are summarised below:
-
•
Initial center attacks like , and destructs NetScience network in almost same fashion. attacks are least efficient among initial value attacks.
-
•
The network is highly sensitive to and attacks () and highly robust towards attack.
-
•
Also, the network is completely destroyed at very lower values of . Even the least efficient attack () destroys the network by removing a mere percent of nodes.
6.2. Les Miserables Coappearance Network
This co-appearance network dataset was compiled by Knuth [26] to represent the co-occurrences of characters in Victor Hugo’s famous novel Les Misérables. In this undirected network, each node represents a character of the novel and each edge represents the co-occurrence of two characters in the same chapter. For a summary of statistics of LesMisérables network see Appendix: Table 2. The vulnerability of LesMisérables network was analysed by running Algorithm 1 and calculating in each iteration. The plot vs. is shown in figure 7.
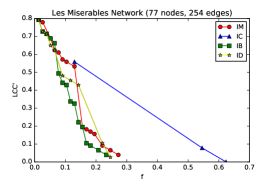
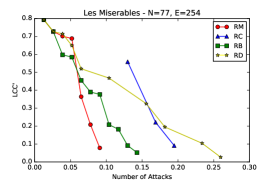
The findings are summarized below:
-
•
LesMisérables network is most sensitive to attack. Complete network is destroyed by removing only fraction of nodes.
-
•
Least efficient attack on the network is by ( slighlty greater than )
-
•
Among recalculated attacks, the network shows more robustness towards attack.
6.3. US Popular Airport Network
This is an undirected network of 500 most popular US airports. The dataset was compiled and used by Colizza et. al. in 2007 [13]. The nodes represent airports and edges represent the air traffic between them. Hereafter the network is called as US Airport network. See Appendix: Table 3 for a summary of statistics of US Airport network. After running Algorithm 1 on US Airport network we analysed the change in against . See figure 8.
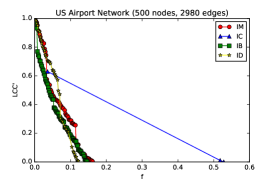
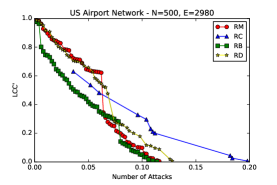
The observations from the experiment are as follows:
-
•
US Airport network is more sensitive to and attacks.
-
•
The network shows more robustness to attack.
6.4. Yeast Protein Interaction Network
The biological network considered in this study is the protein interaction network for the yeast Saccharomyces cerevisiae. This data set was used by Jeong et. al. in their paper [25]. The nodes represent proteins and edges represent protein-protein interaction. The actual network consists of 2114 nodes and 2277 edges. But here we extracted and used only the giant component (of 1458 nodes) for our study. See Appendix: Table 4 for a summary of statistics of the giant component of Yeast Protein Interaction network. See figure 9 for the plot vs. during center-based attacks on Yeast Protein Interaction network.
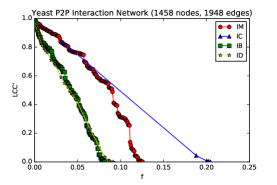
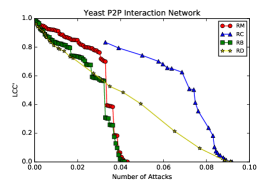
The findings are as follows:
-
•
Attacks on Yeast Protein Interaction network are comparable to those on NetScience network. Like the latter network, it is more sensitive to and attacks with network destroyed at very small values of ().
-
•
This network also shows more robustness to attack like all other networks.
Summary: The efficiency of attacks in real-world networks was found to be as in the case of initial center attacks and in the case of recalculated center attacks. Among the recalculated attacks, the collaboration network and literature network shows more robustness towards attack while air-transport network and biological network are highly tolerant towards attack. Among the different real-world networks considered here the robustness of collaboration network was found to be highly weak.
7. Conclusion
We proposed center-based attack strategies and analysed the tolerance of different synthetic and real-world networks towards these attacks. Network attacks based on betweenness center and degree center were studied in detail in papers like [12, 20, 22, 23, 24, 29]. However, comparison of network attacks based on different centers is a naive approach. The attacks based on center and median are seldom found in the literature. An important milestone of this study is the introduction of median-based attack. Attacks based on median are found to be highly efficient among other center-based attacks. Nodes with higher median value are those with minimum total distance in the network. Therefore identifying and removing such nodes increase the value of geodesics in the network and in turn induce heavy damages to the network structure.
Future Scope An interesting follow-up to this work is to study network survivability in center-based attacks. Robustness of a network can be analysed more accurately by accounting for weights in the network. This also opens up a new direction for further follow-up investigation.
Funding
This work was supported by the National Post Doctoral Fellowship (N-PDF) No. PDF/2016/002872 from Science and Engineering Research Board (SERB), Department of Science and Technology (DST), Government of India.
Acknowledgements
The authors would like to thank Prof. M. Bellingeri for providing review comments on a previous draft of the paper.
Appendix
| Network Parameter | Value |
|---|---|
| Number of authors with collaborations (Node Count) | |
| Number of connected components (ncc) | |
| Shortest distance between farthest authors (Diameter) | |
| Shortest distance between closest authors (Radius) | |
| Number of connected author-pairs (Shortest paths) | |
| Expected distance between two connected authors (Characteristic path length) | |
| Average Number of co-authors (Average degree) | |
| Average chance of collaboration between co-authors (Clustering coefficient) |
| Network Parameter | Value |
|---|---|
| Number of characters in the novel (Node count) | |
| Number of connected components (ncc) | |
| Shortest distance between farthest characters (Diameter) | |
| Shortest distance between closest characters (Radius) | |
| Number of connected character-pairs (Shortest paths) | |
| Expected distance between two connected characters (Characteristic path length) | |
| Average number of co-appearing characters (Average degree) | |
| Average chance of co-appearance between co-appearing characters (Clustering coefficient) |
| Network Parameter | Value |
|---|---|
| Number of airports (Node count) | |
| Number of connected components (ncc) | |
| Shortest distance between farthest airports (Diameter) | |
| Shortest distance between closest airports (Radius) | |
| Number of connected airport-pairs (Shortest paths) | |
| Expected distance between two connected airports (Characteristic path length) | |
| Average number of directly connected airports(Average degree) | |
| Average chance of direct connection between airports connected to one airport (Clustering coefficient) |
| Network Parameter | Value |
|---|---|
| Number of proteins (Node count) | |
| Number of connected components (ncc) | |
| Shortest distance between farthest proteins (Diameter) | |
| Shortest distance between closest proteins (Radius) | |
| Number of connected protein-pairs (Shortest paths) | |
| Expected distance between two interacting proteins (Characteristic path length) | |
| Average number of directly interacting proteins (Average degree) | |
| Average chance of interaction between proteins interacting with same protein (Clustering coefficient) |
References
- [1] Albert, R., Jeong, H., Barabási, A. (2000), Error and attack tolerance of complex networks, Nature, 406, 378 – 482.
- [2] Albert, R., Barabási, A. (1999), Emergence of Scaling in Random Networks, Science, 286, 509–512.
- [3] Albert, R., Barabási, A. (2002), Statistical mechanics of complex networks, Rev. Mod. Phy., 74, 47–97.
- [4] Assenov Y., Ramírez F., Schelhorn S. E., Lengauer T., Albrecht M. (2008), Computing topological parameters of biological networks, Bioinformatics, 24:2, 282 – 284.
- [5] Batagelj, V., Brandes, U. (2005), Efficient generation of large random networks, Phy. Rev. E 71, 036113.
- [6] Boccaletti, S., Buldú, J., Criado, R., Flores, J., Latora, V., Pello, J., Romance, M. (2007), Multiscale vulnerability of complex networks, Chaos 17, 043110.
- [7] Bellingeri, M., Cassi, D., Vincenzi, S. (2014), Efficiency of attack strategies on complex model and real-world networks, Physica A, 414, 174 – 180.
- [8] Bellingeri, M., Cassi, D. (2018), Robustness of weighted networks, Physica A, 489, 47 – 55.
- [9] Buckley, F., Harary, F. (1990), Distances in Graphs, CA: Addison-Wesley, Redwood City.
- [10] Batagelj, V., Mrvar, A. (2003), Pajek - Analysis and Visualization of Large Networks. In Juenger, M., Mutzel, P. (Eds.): Graph Drawing Software. Springer (series Mathematics and Visualization), Berlin, 77 – 103.
- [11] Batagelj, V., Mrvar, A. (1998), Pajek - Program for Large Network Analysis. Connections 21, 2, 47 – 57.
- [12] Crucitti, P., Latora, V., Marchiori, M.(2004), Model for cascading failures in complex networks, Phy. Rev. E 69, 045104.
- [13] Colizza, V., Pastor-Satorras, R., Vespignani, A. (2007), Reaction-diffusion processes and metapopulation models in heterogeneous networks. Nature Physics 3, 276 – 282.
- [14] Dorogovtsev, S. N., Mendes, J. F. F. (2002), Evolution of networks, Advances in Physics, 51, Issue 4, 1079 – 1187.
- [15] Erciyes, K. (2015), COMPLEX NETWORKS An Algorithmic Perspective, CRC Press.
- [16] Erdős, P., Rényi, A. (1959), On random graphs, Publicationes Mathematicae, 6, 290 – 297.
- [17] Freeman, L. (1978), Centrality in Social Networks, Social Networks, 1, 215 – 239.
- [18] Goddard, W., Oellermann, O. R. (2010),Distance in Graphs, Chapter in book: Structural Analysis of Complex Networks, 49 – 72.
- [19] Goldshtein, V., Koganov, G. A., Surdutovich, G. I. (2004), Vulnerability and Hierarchy of Complex Networks, cond-mat/0409298.
- [20] Ghedini, C. G.,Ribeiro, C. H. C. (2011), Rethinking failure and attack tolerance assessment in complex networks, Physica A 390, 4684 -– 4691.
- [21] Hao, Y., Han, J., Cheng, Q., Hu, Y. (2016), Vulnerability Analysis for Complex Networks under the Shortest Path-Attack Strategies, CIMNS 2016, Atlantis Press, 138 – 141.
- [22] Hao, Y., Han, J., Lin, Y., Liu, L. (2016), Vulnerability of complex networks under three-level-tree attacks, Physica A: Statistical Mechanics and its Applications, Volume 462, 674 – 683.
- [23] Holme, P., Kim, B. J., Yoon, C. N., Han, S. K. (2002), Attack-vulnerability of complex networks,Phy. Rev. E., 65, 056109.
- [24] Iyer, S., Killingback, T., Sundaram, B., Wang, Z. (2013), Attack Robustness and Centrality of Complex Networks, PLoS ONE 8(4): e59613.
- [25] Jeong, H., Mason, S., Barabási, A., Oltvai, Z. N. (2001), Centrality and lethality of protein networks, Nature 411, 41.
- [26] Knuth, D. E. (1993), The Stanford GraphBase: A Platform for Combinatorial Computing, Addison-Wesley, Reading, MA.
- [27] Lu, L., Chen, D., Ren, X., Zhang, Q., Zhang, Y., Zhou, T. (2016), Vital nodes identification in complex networks, Physics Reports, Volume 650, 1 – 63.
- [28] Milgram, S. (1967), The small world problem, Psychology Today, 1, 61 – 67.
- [29] Mishkovski, I., Biey, M., Kocarev, L. (2011), Vulnerability of complex networks, Elsevier Commun. Nonlinear Sci. Numer. Simulat., 16, 341 – 349 .
- [30] Motter, A. E., Lai, Y. (2002), Cascade-based attacks on complex networks, Phy. Rev. E 66, 065102.
- [31] Motter, A. E. (2004), Cascade control and defense in complex networks, Phy. Rev. Lett. 93(9), 098701.
- [32] Newman, M.E.J. (2000), Models of the small world, J. Stat. Phy. 101, 819 -– 841.
- [33] Newman, M.E.J. (2001), The structure of science collaboration networks, PNAS, 98,2, 404 – 409.
- [34] Newman, M.E.J. (2006), Finding community structure in networks using the eigenvectors of matrices, Preprint physics/0605087.
- [35] Nie, T., Guo, Z., Zhao, K., Lu, Z. (2015), New attack strategies for complex networks, Physica A, 424, 248 – 253.
- [36] Pu, C., Cui, W.(2015), Vulnerability of complex networks under path-based attacks, Physica A, 419, 622 – 629.
- [37] Shannon, P., Markiel, A., Ozier, O., Baliga, N. S., Wang, J. T., Ramage, D., Amin, N., Schwikowski, B., Ideker, T. (2003), Cytoscape: a software environment for integrated models of biomolecular interaction networks, Genome Res, 13:11, 2498 – 2504.
- [38] Strogatz, S. H. (2001), Exploring complex networks, Nature 410, 268 – 276.
- [39] Watts, D. J., Strogatz, S. H. (1998), Collective dynamics of ‘small-world’ networks, Nature, 393, 6684, 440 – 442.
- [40] Wuchty, S., Stadler, P.F. (2003), Centers of complex networks, J. of Theor. Bio., 223, 45 – 53.