Reproduction of the charge density wave phase diagram in 1T-TiSe2 exposes its excitonic character
Abstract
Recent experiments suggest that excitonic degrees of freedom play an important role in precipitating the charge density wave (CDW) transition in 1T-TiSe2. Through systematic calculations of the electronic and phonon spectrum based on density functional perturbation theory, we show that the predicted critical doping of the CDW phase overshoots the experimental value by one order of magnitude. In contrast, an independent self-consistent many-body calculation of the excitonic order parameter and renormalized band structure is able to capture the experimental phase diagram in extremely good qualitative and quantitative agreement. This demonstrates that electron-electron interactions and the excitonic instability arising from direct electron-hole coupling are pivotal to accurately describe the nature of the CDW in this system. This has important implications to understand the emergence of superconductivity within the CDW phase of this and related systems.
The layered structure of metallic transition metal dichalcogenides (TMDs) has long made them archetypes to study the interplay between charge order, lattice instabilities and superconductivity (SC) in both quasi Wilson (1978); Clerc et al. (2007); Rossnagel (2011); Kusmartseva et al. (2009); Morosan et al. (2006); Joe et al. (2014) and strictly 2D settings Chen et al. (2015); Tsen et al. (2015); Li et al. (2015); Xi et al. (2015, 2016). One of their common characteristics is that the SC order is stabilized within (sometimes deeply) a charge density wave (CDW) phase and the phase boundary is rather sensitive to the electronic density. 1T-TiSe2 (TiSe2, in short) is a particularly noteworthy case and will be our focus. It is a low-density semi-metal that undergoes a transition to a commensurate triple- CDW at a relatively high temperature that increases from K in bulk Di Salvo et al. (1976), to about K in monolayers Goli et al. (2012); Chen et al. (2015). The ordering vectors double the unit cell: in the bulk Di Salvo et al. (1976), and in the monolayer Chen et al. (2015); Fang et al. (2017); the other two wave vectors are symmetric counterparts of under rotations.
With no Fermi surface nesting Pillo et al. (2000) and a robust periodic lattice distortion (PLD) in tandem with the CDW Di Salvo et al. (1976), it is natural to consider the role played by soft phonons arising from a strong and -textured electron-phonon coupling, similarly to the cases of 2H-NbSe2 or 2H-TaSe2 Moncton et al. (1975); Weber et al. (2011a); Leroux et al. (2015). This would find support in density functional theory (DFT) calculations that reveal softening of an acoustic mode at Motizuki et al. (1981); Calandra and Mauri (2011); Singh et al. (2017) in agreement with inelastic scattering experiments Holt et al. (2001); Weber et al. (2011b). However, despite structural similarities, TiSe2 is a fundamentally different electronic system where one expects enhanced electronic interactions: The band structure of the normal state has small overlapping electron and hole pockets offset in momentum by precisely Bachrach et al. (1976); Zunger and Freeman (1978), which strongly hints at a possible electronic instability of the excitonic type Di Salvo et al. (1976); Traum et al. (1978). Despite the long-standing theoretical prediction for the conditions under which an excitonic insulator ground state should emerge Keldysh and Kopaev (1965); Jérome et al. (1967); Kohn (1967), no representative system has yet been decisively found.
Recently, inelastic X-ray measurements identified a dispersive electronic mode compatible with the development of an excitonic condensation at Kogar et al. (2017a). That excitons and interactions can be important has been increasingly better documented by a number of modeling refinements: Cercellier, Monney, et al. showed such mechanism alone could account for a number of features observed in the evolution of the ARPES spectrum of undoped TiSe2 Cercellier et al. (2007); Monney et al. (2009, 2011, 2015) through the CDW transition; based on an approximate quasi-1D model, van Wezel et al. discovered that exciton condensation can enhance the lattice distortion van Wezel et al. (2010a, b). Hence, the outstanding question is not whether excitonic physics is at play, but how much so.
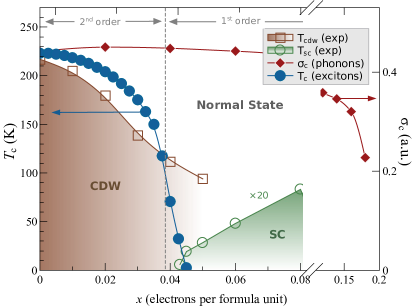
Since the dependence of on electronic density is well known experimentally, we submit that the predicted density dependence of in a description with and without account of the excitonic mechanism should be different. As a result, it provides a direct, well defined means to quantify the importance of excitonic condensation in the transition to the CDW phase in TiSe2. Indeed, here we demonstrate that the experimental density dependence of in CuxTiSe2 cannot be captured without explicitly accounting for electron-electron interactions and the excitonic instability, as summarized in the calculated phase diagram of Fig. 1.
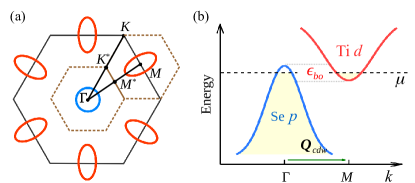
Excitonic instability — CDW order is stabilized by intra-layer physics (even in bulk TiSe2, § S-IV) which explains the strong similarity of electronic and phononic bandstructure changes in monolayer and bulk, as well as their doping phase diagram Morosan et al. (2006); Li et al. (2015); Chen et al. (2016a); Goli et al. (2012). Therefore, to interrogate whether the excitonic mechanism is able to drive the system through a CDW transition in agreement with experiments, we study the TiSe2 monolayer. Although there are two hole pockets [Fig. 3(a)], we consider only the highest one (§ S-I.D), similarly to previous studies Monney et al. (2009, 2011, 2010). It is modeled as isotropic with , centered at the point, while the three electron pockets at each point have anisotropic effective masses, , as per Fig. 2. When undoped, the chemical potential () of TiSe2 is placed near the intersection of the conduction and valence pockets, in agreement with the folded DFT band structure calculated in an unrelaxed superlattice [cf. Fig. 3(a) later], and also tallying with transport experiments that reveal both electron and hole carriers in the normal state Di Salvo et al. (1976); Morosan et al. (2006). The band parameters have been extracted by fits to ARPES data in reference Chen et al., 2015 in the normal state Par . Since the bands strongly renormalize near and CDW fluctuations are likely present at Monney et al. (2009), the fitting privileged large energy ranges above and below, rather than the close vicinity of . With these, our normal state electron density is , consistent with the experimental Hall data Di Salvo et al. (1976) (see also Fig. S4).
The Hamiltonian comprises these 4 “bare” bands and a direct Coulomb interaction between electrons at the valence and conduction pockets Keldysh and Kopaev (1965); Jérome et al. (1967); Kohn (1967); Monney et al. (2009):
| (1) |
Here, () are annihilation operators for electrons at the valence (-th conduction) pocket with momentum () and spin , and is the number of unit cells of the crystal (for electron pockets at , represents the momentum measured from ). The chemical potential is implicit in which are measured with respect to it. A mean-field decoupling generates the order parameter
| (2) |
that is directly related to the amplitude of the CDW at SI . In view of the symmetry among the three pockets and the small pocket size, we approximate and to - and -independent constants. In particular, is the central quantity for our mapping of the temperature-doping phase diagram associated with the excitonic instability. It obeys a self-consistent equation SI , cf. Eq. (S8), whose solution for different yields the transition temperature to the CDW phase () as a function of doping.
Self-consistent phase diagram — Fig. 1 shows the resulting , calculated entirely self-consistently at different doping for the first time, and how it compares with the experimental transition temperatures [see also Fig. S2(a)]. It can be clearly seen that: (i) the decreasing trend from follows very well the experimental behavior until ; (ii) the calculation predicts at precisely the doping where the CDW changes from commensurate to incommensurate Kogar et al. (2017b) and SC phase emerges (); (iii) the transition is of 2 order until , becoming 1 order afterwards, which correlates with the doping for the onset of discommensurations or ICDW observed in recent experiments Kogar et al. (2017b); SI . Having set all the bare band parameters from ARPES data as described earlier, our theory of the charge instability depends only on one parameter: the coupling . We set it at 450 meV to match the calculated to the experimental one at . With thus fixed, the results for at different shown in Fig. 1 follow without further parameters adjustment. At we have meV [Fig. S2(b)], in reasonable agreement (given the approximations) with meV measured in bulk and monolayer Monney et al. (2010); Chen et al. (2015) after subtracting background fluctuations from the latter, as pointed out by Monney et al. Monney et al. (2010); Cercellier et al. (2007).
Experimental confirmation of whether this mechanism is critical or not in driving the CDW instability in TiSe2 and related TMDs can be obtained by probing as a function of both electron and hole doping to establish: (i) whether an optimal exists and (ii) whether it correlates with having at the pocket intersection.
Note that the absence of nesting implies that the “renormalized” electronic bands in the CDW phase are only partially gapped Monney et al. (2009) (Fig. S3). This translates into a predicted increase in the resistivity, , as soon as CDW fluctuations set in at , but persistence of the metallic nature at low temperatures; notably, holes are suppressed below . All these features tally with measurements of thermal and electronic transport across the transition Di Salvo et al. (1976); Morosan et al. (2006); SI . In addition, the preservation of partial electron pockets in the excitonic phase provides a Fermi sea for the development of SC beyond a threshold doping, and the co-existence of SC and CDW order, as seen experimentally Spera et al. (2017).
These results reveal that the excitonic mechanism is able to capture correctly all the key qualitative aspects of the CDW transition and, in addition, account quantitatively very well for the experimental doping dependence of . The agreement extends to the position of the CDW critical point that is predicted here to lie rather close to the experimental onset of the SC dome.
Band restructuring ab initio — To obtain an unbiased perspective over the doping dependence of both the reconstructed energy bands and phonon spectrum with doping, we carried out extensive DFT calculations Hohenberg and Kohn (1964) with the projector augmented wave method implemented in the Vienna Ab-initio Simulation Package (VASP) Kresse and Joubert (1999); Kresse and Furthmüller (1996). Electronic calculations used the generalized gradient approximation (GGA) Perdew et al. (1996) for the exchange-correlation functional and include spin-orbit coupling. The force constants were obtained within density functional perturbation theory (DFPT) and the phonon dispersions computed with the PHONOPY code Baroni et al. (1987); Togo et al. (2008). Details of these calculations and methodology are given in the supplementary information SI . Effect of additional carriers in TiSe2 were investigated with two complementary strategies: directly simulating supercells with adsorbed Cu and by adding/removing electrons to the unit cell with a neutralizing uniform background charge.
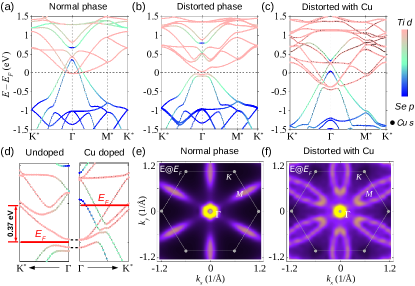
In the high-temperature undistorted phase, TiSe2 contains two Se -derived hole pockets at the point slightly overlapping with three Ti -derived electron pockets at the point (§ S-I.D.). As these are related by , in a superlattice representation they fold to the -point of the reduced Brillouin zone, as explicitly shown in Fig. 3(a). The Fermi energy () is slightly below the intersection of electron and hole pockets, as required by charge neutrality given the higher number of electron pockets. If one freezes the ions, these bands do not hybridize and revert to their respective primitive BZ positions in the unfolded band structure [cf. Fig. S7(b)].
Relaxing the ions yields a distorted ground-state (the PLD), the overlapping pockets hybridize at , and a gap appears ( meV) resulting in an overall lowering of energy. In addition, there is an important restructuring of the bands’ shape near as shown in Fig. 3(b) and Fig. S5; this causes loss of the parabolic dispersion towards an inverted Mexican hat profile. In DFT, this feature was first observed in calculations only after adding GW quasiparticle corrections to the LDA band structure of bulk TiSe2 Cazzaniga et al. (2012). Its observation here at the GGA level indicates it captures the important qualitative details to accurately describe the low density pockets in TiSe2 (we discuss the electronic structure predicted with an alternative HSE hybrid functional in the supplementary information and Fig. S6). The commensurate PLD ground state, the magnitude of the atomic displacements, and nontrivial restructuring of energy bands are in substantial agreement with experiments. The unfolded band structure shown in Fig. S7(d) exhibits distinct back-folded bands at the point that retain the nontrivial Mexican hat shape, as has been recorded in ARPES Cercellier et al. (2007); Chen et al. (2015).
Doping by Cu intercalation — We now add Cu atoms to the monolayer and report in Fig. 3(c) the band structure in the reduced Brillouin zone of a fully optimized supercell with two Cu atoms (one above and one below the TiSe2 slab, to preserve the symmetry). This visibly increases and restores the partial overlap between the electron and hole bands: at this doping, the system is a semimetal with a rigid upward shift of . This is further evidenced by the Fermi contours shown in Figs. 3(e,f) that shrink at and expand at to cover a large area of the BZ. Despite having been computed without and with the Cu atoms, these Fermi contours are adiabatically connected, similarly to the evolution of Fermi surfaces in the experiments Zhao et al. (2007).
There are two crucial effects of doping with Cu. First, inspection of the bands in Figs. 3(b–d) shows that it does not remove the nontrivial restructuring of the dispersion near the electron-hole intersection of the pristine monolayer; Fig. 3(d) emphasizes this observation by placing the undoped and doped band structures near side by side. This agrees with STM measurements showing that the gap in the CDW phase of CuxTiSe2 appears below and moves to higher binding energies proportionally to the Cu content Spera et al. (2017). Second, an analysis of atomic relaxations further reveals that doping nullifies the large atomic displacements observed in the distorted state of the undoped system and entirely suppresses the PLD (Fig. S8).
Note that the concentration of Cu in these supercell calculations is extremely high (Cu:Ti) for direct experimental comparison (the Cu solubility limit is 11% Morosan et al. (2006); Wu et al. (2007)). The crucial factor here is that, despite such high doping, our results provide clear evidence that the leading effect of Cu adsorption is to donate carriers to the conduction bands (one electron per Cu). This rigidly shifts without marked modification of the dispersion and one naturally expects a more dilute scenario to introduce even less perturbation beyond shifting . Therefore, in order to scrutinize in detail the phonon instability at experimentally compatible doping (below 10 %), we resort to the second doping strategy mentioned above, which would otherwise require prohibitively large supercells in the DFT and phonon calculations.
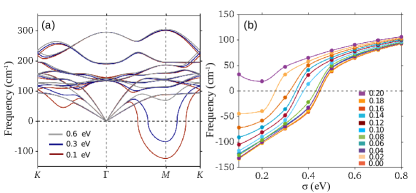
Phonon softening ab initio — Fig. 4(a) displays the phonon spectrum of TiSe2 in the normal () phase. The qualitative influence of temperature is probed by varying the electronic smearing parameter , which is normally used as a technical tool in the ab-initio calculations to accelerate the convergence and, in certain circumstances, acquires the role of electronic temperature SI . A marked dependence of soft modes on is conventionally used to trace qualitative changes expected to occur in the real phonon spectrum with temperature. At the smallest smearing ( eV), a soft mode with imaginary frequencies (represented as negative values) around the point signals the dynamical instability towards the PLD observed experimentally below , which is complementary to that based on total energy minimization in the superlattice discussed above. The fraction of the BZ associated with imaginary frequencies decreases at higher and disappears beyond a critical value eV (note that only one acoustic mode is sensitive to , as in experiments Holt et al. (2001)). This hardening behavior implies that undoped TiSe2 should be stable only above a threshold temperature because, while cannot be directly related to , existence of a finite can be safely used to predict a finite SI ; this agrees with the experimental situation.
To probe systematically the effect of small uniform doping, we studied the phonon spectrum with different concentrations of electrons in the unit cell (, measured in electrons per formula unit, FU) as outlined above. The range of imaginary frequencies gradually decreases as grows, and the soft mode becomes stable above [cf. Fig. S9(b)]. A summary of the dependence of on both and is shown in Fig. 4(b) for electron doping. A similar progression (not shown) is found with hole doping, albeit with a smaller critical density ( holes/FU). Hence, both electron and hole doping suppress the PLD in a TiSe2 monolayer.
The variation of with doping is included in the phase diagram of Fig. 1 for comparison. While our DFPT results correctly predict the suppression of the CDW/PLD in doped TiSe2, the rate of suppression with doping is much smaller than in experiments, resulting in an order of magnitude discrepancy between the predicted and experimental . This conclusion is robust with regards to the smearing method used SI .
Discussion — We provided the first complete, self-contained theoretical description of the influence of both temperature and doping in the CDW phase diagram of TiSe2 in a fully self-consistent way. The solution of the excitonic instability with doping predicts a phase diagram in very good agreement with the experimental . This is significant because: our bare band structure is fixed from ARPES data; the single interaction parameter is fixed once in the undoped case; the good agreement seen for follows without any subsequent parameter fitting. In addition, the electron-phonon coupling can be incorporated straightforwardly in this scheme, possibly enhancing the CDW instability Zenker et al. (2013); SI .
The commensurate nature of the CDW, where both amplitude and phase fluctuating modes are gapped Grüner (1994); Lee et al. (1993); McMillan (1977); Su et al. (2017), and the high , generically support relying on a mean-field calculation to describe the condensed phase of this problem. However, fluctuations are likely the reason for the persistence of the spectral gap in ARPES even above Cercellier et al. (2007); Chen et al. (2015), and for our to be [Fig. S2(b)] of that same difference in experiments for undoped TiSe2 Cercellier et al. (2007); Monney et al. (2009, 2011, 2010). The experimental restructuring towards Mexican-hat-shaped bands, with spectral transfer affecting only low energies, indicates that the physics is well described by our mean-field decoupling scheme.
Although DFT+DFPT implementations capture the electron-phonon coupling and some level of electronic correlation, they do not account for the excitonic condensation. By not explicitly capturing this physics, the calculation is unable to describe the correct degree of phonon softening, especially because the very low density places in the region where the spectrum is non-trivially restructured. This sensitivity to electronic interactions tallies with previous evidence that DFT-based results for the stability of the PLD and renormalized band-structure depend strongly on the exchange and correlation functional, the usage of a local or non-local density approximation, and quasiparticle corrections Cazzaniga et al. (2012); Olevano et al. (2014); Calandra and Mauri (2014); Singh et al. (2017); Hellgren et al. (2017).
Our results place the excitonic instability as a decisive element in the microscopic description of the CDW/PLD transition, as hinted by recent experiments that unveiled hybridized excitonic and phonon modes Kogar et al. (2017a). The current ability to map the phase diagram in strictly 2D TiSe2 by gate doping Li et al. (2015) should allow forthcoming studies of the yet unexplored hole-doped regime, e.g., whether an optimal correlates with at the intersection of the electron and hole pockets, as predicted here.
Acknowledgements.
We thank Lei Su and A. H. Castro Neto for fruitful discussions. VMP was supported by the Singapore Ministry of Education through grant MOE2015-T2-2-059. Numerical computations were carried out at the HPC facilities of the NUS Centre for Advanced 2D Materials, supported by the National Research Foundation of Singapore under its Medium-Sized Centre Programme.References
- Wilson (1978) J. A. Wilson, Phys. Status Solidi 86, 11 (1978).
- Clerc et al. (2007) F. Clerc, C. Battaglia, H. Cercellier, C. Monney, H. Berger, L. Despont, M. G. Garnier, and P. Aebi, J. Phys. Condens. Matter 19, 355002 (2007).
- Rossnagel (2011) K. Rossnagel, J. Phys. Condens. Matter 23, 213001 (2011).
- Kusmartseva et al. (2009) A. F. Kusmartseva, B. Sipos, H. Berger, L. Forró, and E. Tutiš, Phys. Rev. Lett. 103, 236401 (2009).
- Morosan et al. (2006) E. Morosan, H. Zandbergen, B. Dennis, J. Bos, Y. Onose, T. Klimczuk, A. Ramirez, N. Ong, and R. Cava, Nat. Phys. 2, 544 (2006).
- Joe et al. (2014) Y. I. Joe, X. M. Chen, P. Ghaemi, K. D. Finkelstein, G. a. de la Peña, Y. Gan, J. C. T. Lee, S. Yuan, J. Geck, G. J. MacDougall, T. C. Chiang, S. L. Cooper, E. Fradkin, and P. Abbamonte, Nat. Phys. 10, 421 (2014).
- Chen et al. (2015) P. Chen, Y. H. Chan, X. Y. Fang, Y. Zhang, M. Y. Chou, S. K. Mo, Z. Hussain, a. V. Fedorov, and T. C. Chiang, Nat. Commun. 6, 8943 (2015).
- Tsen et al. (2015) A. W. Tsen, B. Hunt, Y. D. Kim, Z. J. Yuan, S. Jia, R. J. Cava, J. Hone, P. Kim, C. R. Dean, and A. N. Pasupathy, Nat. Phys. 12, 208 (2015).
- Li et al. (2015) L. J. Li, E. C. T. O’Farrell, K. P. Loh, G. Eda, B. Özyilmaz, and A. H. Castro Neto, Nature 529, 185 (2015).
- Xi et al. (2015) X. Xi, Z. Wang, W. Zhao, J.-H. Park, K. T. Law, H. Berger, L. Forró, J. Shan, and K. F. Mak, Nat. Phys. 12, 139 (2015).
- Xi et al. (2016) X. Xi, H. Berger, L. Forró, J. Shan, and K. F. Mak, Phys. Rev. Lett. 117, 106801 (2016).
- Di Salvo et al. (1976) F. J. Di Salvo, D. E. Moncton, and J. V. Waszczak, Phys. Rev. B 14, 4321 (1976).
- Goli et al. (2012) P. Goli, J. Khan, D. Wickramaratne, R. K. Lake, and A. A. Balandin, Nano Lett. 12, 5941 (2012).
- Fang et al. (2017) X.-Y. Fang, H. Hong, P. Chen, and T.-C. Chiang, Phys. Rev. B 95, 201409 (2017).
- Pillo et al. (2000) T. Pillo, J. Hayoz, H. Berger, F. Lévy, L. Schlapbach, and P. Aebi, Phys. Rev. B 61, 16213 (2000).
- Moncton et al. (1975) D. E. Moncton, J. D. Axe, F. J. Disalvo, E. Engineers, and E. Engineers, Phys. Rev. Lett. 34, 734 (1975).
- Weber et al. (2011a) F. Weber, S. Rosenkranz, J.-P. Castellan, R. Osborn, R. Hott, R. Heid, K.-P. Bohnen, T. Egami, A. H. Said, and D. Reznik, Phys. Rev. Lett. 107, 107403 (2011a).
- Leroux et al. (2015) M. Leroux, I. Errea, M. Le Tacon, S.-M. Souliou, G. Garbarino, L. Cario, A. Bosak, F. Mauri, M. Calandra, and P. Rodière, Phys. Rev. B 92, 140303 (2015).
- Motizuki et al. (1981) K. Motizuki, N. Suzuki, Y. Yoshida, and Y. Takaoka, Solid State Commun. 40, 995 (1981).
- Calandra and Mauri (2011) M. Calandra and F. Mauri, Phys. Rev. Lett. 106, 196406 (2011).
- Singh et al. (2017) B. Singh, C.-H. Hsu, W.-F. Tsai, V. M. Pereira, and H. Lin, Phys. Rev. B 95, 245136 (2017).
- Holt et al. (2001) M. Holt, P. Zschack, H. Hong, M. Y. Chou, and T. C. Chiang, Phys. Rev. Lett. 86, 3799 (2001).
- Weber et al. (2011b) F. Weber, S. Rosenkranz, J. P. Castellan, R. Osborn, G. Karapetrov, R. Hott, R. Heid, K. P. Bohnen, and A. Alatas, Phys. Rev. Lett. 107, 266401 (2011b).
- Bachrach et al. (1976) R. Bachrach, M. Skibowski, and F. Brown, Phys. Rev. Lett. 37, 40 (1976).
- Zunger and Freeman (1978) A. Zunger and A. J. Freeman, Phys. Rev. B 17, 1839 (1978).
- Traum et al. (1978) M. M. Traum, G. Margaritondo, N. V. Smith, J. E. Rowe, and F. J. Di Salvo, Phys. Rev. B 17, 1836 (1978).
- Keldysh and Kopaev (1965) L. V. Keldysh and Y. V. Kopaev, Sov. Phys.-Solid State, USSR 6, 2219 (1965).
- Jérome et al. (1967) D. Jérome, T. M. Rice, and W. Kohn, Phys. Rev. 158, 462 (1967).
- Kohn (1967) W. Kohn, Phys. Rev. Lett. 19, 439 (1967).
- Kogar et al. (2017a) A. Kogar, M. S. Rak, S. Vig, A. A. Husain, F. Flicker, Y. I. Joe, L. Venema, G. J. MacDougall, T. C. Chiang, E. Fradkin, J. van Wezel, and P. Abbamonte, Science 358, 1314 (2017a).
- Cercellier et al. (2007) H. Cercellier, C. Monney, F. Clerc, C. Battaglia, L. Despont, M. G. Garnier, H. Beck, P. Aebi, L. Patthey, H. Berger, and L. Forró, Phys. Rev. Lett. 99, 146403 (2007).
- Monney et al. (2009) C. Monney, H. Cercellier, F. Clerc, C. Battaglia, E. F. Schwier, C. Didiot, M. G. Garnier, H. Beck, P. Aebi, H. Berger, L. Forró, and L. Patthey, Phys. Rev. B 79, 045116 (2009).
- Monney et al. (2011) C. Monney, C. Battaglia, H. Cercellier, P. Aebi, and H. Beck, Phys. Rev. Lett. 106, 106404 (2011).
- Monney et al. (2015) G. Monney, C. Monney, B. Hildebrand, P. Aebi, and H. Beck, Phys. Rev. Lett. 114, 086402 (2015).
- van Wezel et al. (2010a) J. van Wezel, P. Nahai-Williamson, and S. S. Saxena, Phys. Rev. B 81, 165109 (2010a).
- van Wezel et al. (2010b) J. van Wezel, P. Nahai-Williamson, and S. S. Saxena, EPL (Europhysics Letters) 89, 47004 (2010b).
- Chen et al. (2016a) P. Chen, Y.-H. Chan, M.-H. Wong, X.-Y. Fang, M. Y. Chou, S.-K. Mo, Z. Hussain, A.-V. Fedorov, and T.-C. Chiang, Nano Lett. 16, 6331 (2016a).
- Monney et al. (2010) C. Monney, E. F. Schwier, M. G. Garnier, N. Mariotti, C. Didiot, H. Beck, P. Aebi, H. Cercellier, J. Marcus, C. Battaglia, H. Berger, and A. N. Titov, Phys. Rev. B 81, 155104 (2010).
- (39) The fit parameters are: , , , eV (band overlap). See also supplementary SIII.E.
- (40) Additional details are provided in the supplementary information file which includes references Bruus and Flensberg, 2004; Cazzaniga et al., 2012; Cercellier et al., 2007; Chen et al., 2015, 2016a, 2016b; Baroni et al., 1987; Di Salvo et al., 1976; Duong et al., 2015; Frohlich, 1952; Goli et al., 2012; Grüner, 1994; Kogar et al., 2017a; Hohenberg and Kohn, 1964; Kohn, 1967; Krukau et al., 2006; Li et al., 2015; Mermin, 1965; Monney et al., 2009, 2011, 2012; Morosan et al., 2006; Mou et al., 2016; Kresse and Joubert, 1999; Perdew et al., 1996; Togo et al., 2008; Popescu and Zunger, 2012; Singh et al., 2017; Su et al., 2017; van Wezel et al., 2010a, b; Kresse and Furthmüller, 1996; Weber et al., 2011b; Wise et al., 2008; Wu et al., 2007; Zenker et al., 2013.
- Kogar et al. (2017b) A. Kogar, G. A. de la Pena, S. Lee, Y. Fang, S. X.-L. Sun, D. B. Lioi, G. Karapetrov, K. D. Finkelstein, J. P. C. Ruff, P. Abbamonte, and S. Rosenkranz, Phys. Rev. Lett. 118, 027002 (2017b).
- Spera et al. (2017) M. Spera, A. Scarfato, E. Giannini, and C. Renner, arXiv (2017), 1710.04096 .
- Hohenberg and Kohn (1964) P. Hohenberg and W. Kohn, Phys. Rev. 136, B864 (1964).
- Kresse and Joubert (1999) G. Kresse and D. Joubert, Phys. Rev. B 59, 1758 (1999).
- Kresse and Furthmüller (1996) G. Kresse and J. Furthmüller, Phys. Rev. B 54, 11169 (1996).
- Perdew et al. (1996) J. P. Perdew, K. Burke, and M. Ernzerhof, Phys. Rev. Lett. 77, 3865 (1996).
- Baroni et al. (1987) S. Baroni, P. Giannozzi, and A. Testa, Phys. Rev. Lett. 58, 1861 (1987).
- Togo et al. (2008) A. Togo, F. Oba, and I. Tanaka, Phys. Rev. B 78, 134106 (2008).
- Cazzaniga et al. (2012) M. Cazzaniga, H. Cercellier, M. Holzmann, C. Monney, P. Aebi, G. Onida, and V. Olevano, Phys. Rev. B 85, 195111 (2012).
- Zhao et al. (2007) J. F. Zhao, H. W. Ou, G. Wu, B. P. Xie, Y. Zhang, D. W. Shen, J. Wei, L. X. Yang, J. K. Dong, M. Arita, H. Namatame, M. Taniguchi, X. H. Chen, and D. L. Feng, Phys. Rev. Lett. 99, 146401 (2007).
- Wu et al. (2007) G. Wu, H. X. Yang, L. Zhao, X. G. Luo, T. Wu, G. Y. Wang, and X. H. Chen, Phys. Rev. B 76, 024513 (2007).
- Zenker et al. (2013) B. Zenker, H. Fehske, H. Beck, C. Monney, and A. R. Bishop, Phys. Rev. B 88, 075138 (2013).
- Grüner (1994) G. Grüner, Density Waves in Solids (Addison-Wesley, 1994).
- Lee et al. (1993) P. Lee, T. Rice, and P. Anderson, Solid State Commun. 88, 1001 (1993).
- McMillan (1977) W. L. McMillan, Phys. Rev. B 16, 4655 (1977).
- Su et al. (2017) L. Su, C.-H. Hsu, H. Lin, and V. M. Pereira, Phys. Rev. Lett. 118, 257601 (2017).
- Olevano et al. (2014) V. Olevano, M. Cazzaniga, M. Ferri, L. Caramella, and G. Onida, Phys. Rev. Lett. 112, 049701 (2014).
- Calandra and Mauri (2014) M. Calandra and F. Mauri, Phys. Rev. Lett. 112, 049702 (2014).
- Hellgren et al. (2017) M. Hellgren, J. Baima, R. Bianco, M. Calandra, F. Mauri, and L. Wirtz, Phys. Rev. Lett. 119, 176401 (2017).
- Bruus and Flensberg (2004) H. Bruus and K. Flensberg, Many-body quantum theory in condensed matter physics: an introduction (Oxford University Press, 2004).
- Chen et al. (2016b) C.-W. Chen, J. Choe, and E. Morosan, Reports Prog. Phys. 79, 084505 (2016b).
- Duong et al. (2015) D. L. Duong, M. Burghard, and J. C. Schön, Phys. Rev. B 92, 245131 (2015).
- Frohlich (1952) H. Frohlich, Proc. R. Soc. A Math. Phys. Eng. Sci. 215, 291 (1952).
- Krukau et al. (2006) A. V. Krukau, O. A. Vydrov, A. F. Izmaylov, and G. E. Scuseria, J. Chem. Phys. 125, 224106 (2006).
- Mermin (1965) N. D. Mermin, Phys. Rev. 137, A1441 (1965).
- Monney et al. (2012) C. Monney, G. Monney, P. Aebi, and H. Beck, New Journal of Physics 14, 075026 (2012).
- Mou et al. (2016) D. Mou, A. Sapkota, H.-H. Kung, V. Krapivin, Y. Wu, A. Kreyssig, X. Zhou, A. I. Goldman, G. Blumberg, R. Flint, and A. Kaminski, Phys. Rev. Lett. 116, 196401 (2016).
- Popescu and Zunger (2012) V. Popescu and A. Zunger, Phys. Rev. B 85, 085201 (2012).
- Wise et al. (2008) W. D. Wise, M. C. Boyer, K. Chatterjee, T. Kondo, T. Takeuchi, H. Ikuta, Y. Wang, and E. W. Hudson, Nat. Phys. 4, 696 (2008).
See pages ,1,,2,,3,,4,,5,,6,,7,,8,,9,,10,,11,,12,,13,,14,,15,,16,,17,,18,,19,,20,,21,,22,,23,,24,,25,,26,,27 of TiSe2-excins-si.pdf