Large scale correlations in gas traced by MgII absorbers around low mass galaxies
Abstract
The physical origin of the large-scale conformity in the colours and specific star formation rates of isolated low mass central galaxies and their neighbours on scales in excess of 1 Mpc is still under debate. One possible scenario is that gas is heated over large scales by feedback from active galactic nuclei (AGN), leading to coherent modulation of cooling and star formation between well-separated galaxies. In this Letter, the metal line absorption catalogue of Zhu & Ménard (2013) is used to probe gas out to large projected radii around a sample of a million galaxies with stellar masses and photometric redshifts in the range selected from Sloan Digital Sky Survey imaging data. This galaxy sample covers an effective volume of 2.2 Gpc3. A statistically significant excess of MgII absorbers is present around the red low mass galaxies compared to their blue counterparts out to projected radii of 10 Mpc. In addition, the equivalent width distribution function of MgII absorbers around low mass galaxies is shown to be strongly affected by the presence of a nearby ( Mpc) radio-loud AGN out to projected radii of 5 Mpc.
keywords:
galaxies:formation; galaxies:ISM; galaxies:star formation; galaxies:active; galaxies:jets1 Introduction
The physical origin of the large-scale conformity in the colours and specific star formation rates of isolated central galaxies and their neighbours on scales in excess of 1 Mpc has been the subject of considerable recent controversy in the literature. In a series of papers, Kauffmann et al (2013) and Kauffmann (2015) argue in favour of a “pre-heating” scenario where gas is heated over large scales, leading to coherent modulation of cooling and star formation between well-separated galaxies.
The alternative explanation is that these large-scale correlations arise as a consequence of the gravitational physics of non-linear clustering, for example so-called “assembly bias” effects that cause the formation times of neighbouring dark matter halos to be correlated over large scales (Gao, Springel & White 2005). Hearin et al (2015) construct a simple scheme for populating dark matter halos with galaxies in which the age of the central galaxy is matched to the age of its surrounding dark matter halo, and show that strong conformity effects then arise naturally. Pahwa & Parajape (2017) present a model where conformity effects arise as a result of the correlation between galaxy colour and dark matter halo concentration index. Semi-analytic models of galaxy formation, which aim to reproduce a wider variety of observational data than simplistic models linking galaxy colour to halo properties, (Kauffmann et al 1999; Croton et al 2006; Guo et al 2011; Henriques et al 2015) do not, however, yield conformity effects as strong as those measured from Sloan Digital Sky Survey data (Kauffmann et al 2013; Lacerna et al 2017). Given the disagreement between different theoretical analyses, it is important to try and pin down the cause of the effect in a model-independent way.
To help distinguish between the pre-heating and assembly bias scenarios, Kauffmann (2015) searched for relics of energetic feedback events in the neighbourhood of central galaxies with different specific SFRs. A significant excess of very high mass () galaxies out to a distance of 2.5 Mpc around low SFR/ central galaxies was found when compared to control samples of higher SFR/ central galaxies with the same stellar mass and redshift. Very massive galaxies in the neighbourhood of low-SFR/ galaxies were also found to have much higher probability of hosting radio-loud active galactic nuclei (AGN). Kauffmann (2015) claimed that these results lend credence to the hypothesis that AGN might be responsible for heating gas over large spatial scales. This conclusion has recently been challenged by Tinker et al (2017) and Sin, Lilly & Henriques (2017), who carry out a re-analysis of the data set analyzed by Kauffmann (2015) and point out that a large part of the large-scale conformity signal originates from a small number of central galaxies in the vicinity of a small number of groups and massive clusters. In addition, Berti et al (2017) have studied conformity effects at redshifts using galaxies selected from the PRism MUlti-object Survey (PRIMUS). Although conformity effects are detected, they are weaker than those found in the SDSS analysis of Kauffmann et al (2013) and are argued to be the result of large-scale tidal fields and assembly bias.
In this Letter, I carry out a first set of direct tests of the gas pre-heating hypothesis. Sample statistics are improved by expanding the number of low mass central galaxies by a factor of more than a hundred over that used in Kauffmann et al (2013) using a sample of a million galaxies with photometric redshifts in the range and stellar masses selected from Sloan Digital Sky Survey imaging data. This sample covers an effective volume of 2.2 Gpc3. I use a sample of MgII quasar absorption line systems from the metal line absorption catalogue of Zhu & Ménard (2013) to probe the gas out to large projected radii around these galaxies as a function of their colour. I show that a statistically significant excess of MgII absorbers is present around the red low mass galaxy population out to projected radii of 10 Mpc. In addition, I show that the presence of a nearby massive galaxy with a radio loud AGN strongly affects the equivalent width distribution function of MgII absorbers around low mass galaxies out to projected radii of 5 Mpc.
2 The Samples
2.1 Low mass photometrically-selected galaxy sample
I make use of the photometric redshift probability distributions for SDSS galaxies using the methodology described in Sheldon et al (2012). These authors used a nearest-neighbor weighting algorithm developed by Lima et al (2008) to derive the ensemble redshift distribution N(z), and individual redshift probability distributions P(z) for galaxies with . As part of this technique, weights were calculated for a set of training galaxies with known redshifts such that their density distribution in five-dimensional colour/magnitude space was proportional to that of the photometry-only sample, producing a nearly fair sample in that space. P(z) for individual objects were derived by using training-set objects from the local colour/magnitude space around each photometric object. The largest spectroscopic training set galaxies at fainter magnitudes consists of 16,874 from four fields of the PRIMUS survey (PRIMUS; Coil et al. 2011). PRIMUS obtains redshifts to a precision of less than 0.4 % for galaxies with . The catalogue is publicly available at https://data.sdss.org/sas/dr13/eboss/photoObj/photoz-weight/.
I select all galaxies from this catalogue where the integrated probability for the redshift of the galaxy to lie in the range is greater than 0.85. This redshift range is chosen because it overlaps with the CMASS sample of massive galaxies with spectroscopic redshifts (see next subsection), as well as the MgII catalogue of Zhu & Ménard (2013). This results in a sample of 5,474,672 photometrically selected galaxies. I derive an estimate of the stellar mass of each galaxy by comparing their , and colours to a set of templates generated using the stellar population synthesis models of Bruzual & Charlot (2003) (I assume that the galaxy is located at redshift , where is the median of the redshift probability distribution ). 975,540 photometrically selected galaxies with derived stellar masses in the range are included in this low mass sub-sample of galaxies.
2.2 Sample of massive galaxies and radio-loud AGN
The sample of massive galaxies used in this work originates from the twelfth data release (DR12) of the SDSS. Spectra of about 1.5 million galaxies are available from the Baryonic Oscillation Spectroscopic Survey (BOSS; Dawson et al 2013). I select a sub-sample of 937,079 galaxies with redshifts that meet the CMASS target selection criterion, which was designed to select an approximately stellar mass limited sample at . To find radio-loud galaxies, I cross-match the CMASS sample with the source catalog from the Faint Images of the Radio Sky at Twenty-Centimeters (FIRST) survey carried out at the VLA (Condon et al. 1998). The SDSS and FIRST positions are required to be within 3 arc seconds of each other. There are 43,812 galaxies in the radio loud galaxy sample.
2.3 The MgII absorber sample
I utilize the catalogue of 52,243 MgII absorbers extracted from 142,012 quasar spectra from the DR12 (Zhu & Menard 2013). Of these, 11,035 MgII absorbers have redshifts that overlap the CMASS galaxy sample described above.
3 Results
The left and central panels of Figure 1 show plots of the cumulative number of MgII absorbers (top), number of MgII absorbers weighted by the equivalent width (EQW) of each absorber (middle), and the number of massive CMASS galaxies (bottom) around galaxies in the photometrically selected low mass sample. The analysis is restricted to photometrically selected galaxies with derived stellar masses in the range . The cumulative profiles are plotted from a radius of 100 kpc to a radius of 1.5 Mpc in the left panels, and from 1.5 Mpc to 10 Mpc in the central panels. Solid red curves show results for galaxies in the reddest colour bin, with colours (k-corrected to z=0.5) greater than 0.8. Solid blue curves show results for galaxies in the bluest colour bin with colours (k-corrected to z=0.5) less than 0.5. Dashed red and blue curves show counts of MgII absorbers and massive galaxies for random catalogues which contain the same numbers of objects as our red/blue galaxy sub-samples, but where the sky positions have been randomized. The difference between the blue and the red curves is plotted in the right panels: the solid lines show the difference between the counts around the blue and red low mass galaxies, while the dashed lines show the difference between the counts around the blue/red random catalogue objects.
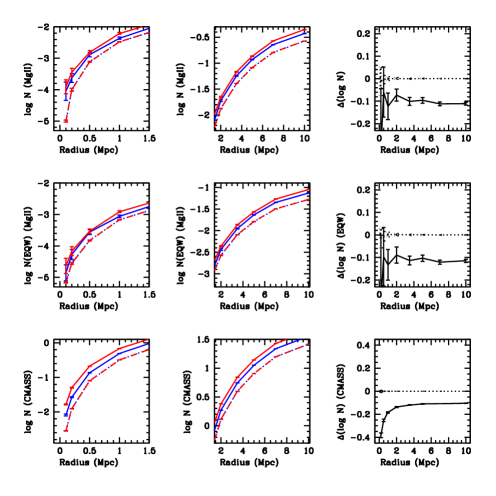
For both the red and the blue galaxy sub-samples, an excess in MgII absorbers and CMASS galaxies is detected over the random counts out to projected radii of 10 Mpc. The counts of CMASS galaxies are less noisy on small scales and they rise steeply as a function of radius out to projected radii of Mpc, reflecting the fact that at fixed stellar mass , red galaxies are likely to reside in more massive dark matter halos than blue galaxies. More interesting is the fact that the counts of both MgII absorbers and CMASS galaxies are different around red and blue low mass galaxies out to the very largest scales. The difference in the counts of CMASS galaxies remain roughly constant on scales from 2-10 Mpc The same is seen for the MgII absorbers. These results show that both the number of CMASS galaxies and the gas traced by MgII is correlated with the colour of low mass galaxies on scales much larger than the virial radii of their dark matter halos.
One might ask whether the excess clustering on such large scales is consistent with clustering statistics predicted in the standard LCDM cosmology. Higher mass halos are more biased with respect to the underlying dark matter density field than lower mass halos. In addition, there are other effects that might come into play. Gao, White & Jenkins (2005) studied the age dependence of halo clustering on large scales (so-called halo assembly bias) using the Millennium Simulation carried out by the Virgo Consortium (Springel et al. 2005). Halos that form at earlier epochs are more clustered than halos that form at later epochs, but the effect decreases at high halo masses and is no longer present at halo masses greater than Mpc. CMASS galaxies have been shown to reside in halos with a mean mass of (Parejko et al 2013). Croton, Gao & White (2007) examined halo assembly bias effects on galaxy clustering as a function of colour using a “shuffling” technique and found that the effects disappeared for the galaxies with luminosities comparable to those of the CMASS galaxies in our sample.
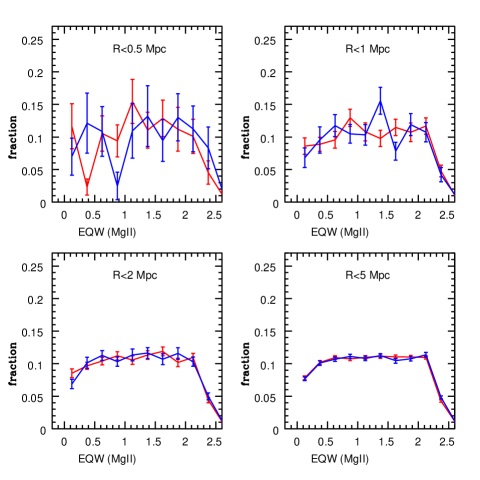
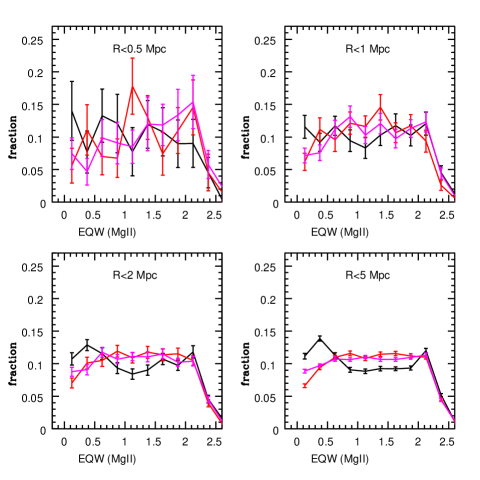
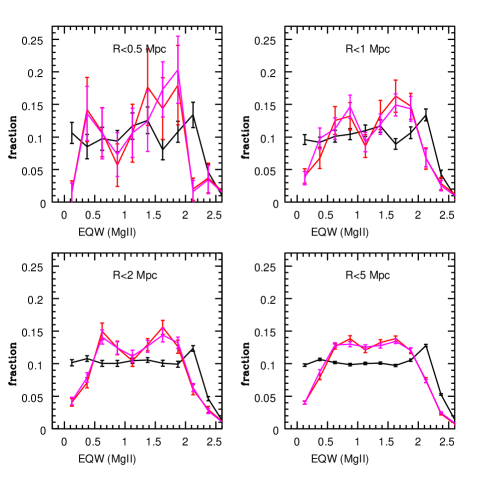
Further investigation of this issue is beyond the scope of this Letter. Because the low mass galaxy sample is photometrically selected, it is not possible to split galaxies according to halo mass reliably. We note, however, that the galaxy counts as a function of colour are only an indirect probe of the physical effects of interest. The next step is to look for evidence that the large-scale physical properties of the gas around red/blue low mass galaxies are influenced by the presence of a radio-loud AGN. Figure 2 shows the distribution of the equivalent widths of the MgII absorbers around the red and the blue galaxies. Results are plotted within apertures of projected radii 0.5,1, 2 and 5 Mpc. As can be seen, the EQW distributions are identical for the two sub-samples within all four apertures. Figure 3 shows the distribution of the equivalent widths of the MgII absorbers around low mass galaxies with 0 (black lines), 1 (red lines) and 2-4 (magenta lines) CMASS galaxies located within a projected radius of 2 Mpc. Results are shown for the same four apertures as in Figure 1. Here, small but statistically significant differences are apparent between the equivalent width distributions around low mass galaxies with no massive neighbours and and around galaxies with 1 or more massive neighbours. In particular, there are fewer very low EQW systems if a massive neighbour is present, but more systems of intermediate EQW. Finally, Figure 4 shows the distribution of the equivalent widths of the MgII absorbers around low mass galaxies with 0 (black lines), 1 (red lines) and 2-4 (magenta lines) radio-loud CMASS galaxies within a projected distance of 2 Mpc. In this plot, very striking differences are seen between the EQW distributions around galaxies with no radio-loud neighbour and those with 1 or more such AGN in their vicinity, which persists out to projected radii of 5 Mpc. Interestingly, the EQW distribution around galaxies with a radio-loud neighbour appears to be bimodal and more narrowly peaked, i.e. both low and high EQW absorbers appear to be missing from the distribution.
We note that Best et al (2005) showed that radio-loud AGN fraction is around 10% in galaxies with stellar masses comparable to those in the CMASS sample. All massive galaxies are believed to go through cycles of radio jet production. Inverse-compton “ghosts” of past radio jet interaction with the surrounding hot medium are frequently found in galaxy groups and clusters (e.g. Mocz, Fabian & Blundell 2010). If radio-loud AGN are responsible for the large-scale effects presented in this Letter, it is thus not unexpected that they be seen in slightly weaker form by simply requiring the presence of a massive companion galaxy.
4 Summary and discussion
In this Letter, I present evidence that some of the properties of the gas around low mass galaxies are coherent over large spatial scales by showing that differences in the abundance of MgII absorption lines systems around red and blue galaxies with stellar masses persist out to projected radii of 10 Mpc. I present evidence that radio-loud AGN may be responsible for this large-scale modulation by showing that the EQW distrbution of MgII systems changes significantly if radio galaxy is found within 2 Mpc. The change in EQW distribution persists out to projected radii of 5 Mpc.
In order to make a direct link between these results and the question of why the specific star formation rates of galaxies exhibit conformity over large spatial scales, it would be helpful to be able to measure actual physical properties of the gas, such as temperature and density. Gas in the halos around galaxies is believed have complex structure and to exist in a multi-phase configuration. This means that it is not simple or straightforward to predict MgII equivalent width statistics for comparison with observations. It is still not understood, for example, how numerical resolution influences predictions of the detailed structure of the intergalactic gas in cosmological hydrodynamical simulations. In future, deep X-ray observations of high temperature gas, combined with higher signal-to-noise quasar spectra that probe a variety of ionization states will yield more insight into the scale dependence of the heating and cooling processes occurring in the circumgalactic gas.
References
- Berti et al. (2017) Berti A. M., Coil A. L., Behroozi P. S., Eisenstein D. J., Bray A. D., Cool R. J., Moustakas J., 2017, ApJ, 834, 87
- Best et al. (2005) Best P. N., Kauffmann G., Heckman T. M., Brinchmann J., Charlot S., Ivezić Ž., White S. D. M., 2005, MNRAS, 362, 25
- Bruzual & Charlot (2003) Bruzual G., Charlot S., 2003, MNRAS, 344, 1000
- Coil et al. (2011) Coil A. L., et al., 2011, ApJ, 741, 8
- Condon et al. (1998) Condon J. J., Cotton W. D., Greisen E. W., Yin Q. F., Perley R. A., Taylor G. B., Broderick J. J., 1998, AJ, 115, 1693
- Croton et al. (2006) Croton D. J., et al., 2006, MNRAS, 365, 11
- Dawson et al. (2013) Dawson K. S., et al., 2013, AJ, 145, 10
- Gao, Springel, & White (2005) Gao L., Springel V., White S. D. M., 2005, MNRAS, 363, L66
- Guo et al. (2011) Guo Q., et al., 2011, MNRAS, 413, 101
- Hearin, Watson, & van den Bosch (2015) Hearin A. P., Watson D. F., van den Bosch F. C., 2015, MNRAS, 452, 1958
- Henriques et al. (2015) Henriques B. M. B., White S. D. M., Thomas P. A., Angulo R., Guo Q., Lemson G., Springel V., Overzier R., 2015, MNRAS, 451, 2663
- Kauffmann et al. (1999) Kauffmann G., Colberg J. M., Diaferio A., White S. D. M., 1999, MNRAS, 303, 188
- Kauffmann et al. (2013) Kauffmann G., Li C., Zhang W., Weinmann S., 2013, MNRAS, 430, 1447
- Kauffmann (2015) Kauffmann G., 2015, MNRAS, 454, 1840
- Lacerna et al. (2017) Lacerna I., Contreras S., González R. E., Padilla N., Gonzalez-Perez V., 2017, arXiv, arXiv:1703.10175
- Lima et al. (2008) Lima M., Cunha C. E., Oyaizu H., Frieman J., Lin H., Sheldon E. S., 2008, MNRAS, 390, 118
- Mocz, Fabian, & Blundell (2011) Mocz P., Fabian A. C., Blundell K. M., 2011, MNRAS, 413, 1107
- Sheldon et al. (2012) Sheldon E. S., Cunha C. E., Mandelbaum R., Brinkmann J., Weaver B. A., 2012, ApJS, 201, 32
- Sin, Lilly, & Henriques (2017) Sin L. P. T., Lilly S. J., Henriques B. M. B., 2017, MNRAS, 471, 1192
- Springel et al. (2005) Springel V., et al., 2005, Natur, 435, 629
- Tinker et al. (2017) Tinker J. L., Hahn C., Mao Y.-Y., Wetzel A. R., Conroy C., 2017, arXiv, arXiv:1702.01121
- Zhu & Ménard (2013) Zhu G., Ménard B., 2013, ApJ, 770, 130