Supplementary Material:
Dynamical Equilibration Across a Quenched Phase Transition
in a Trapped Quantum Gas

I.-K. Liu1,2, S. Donadello3, G. Lamporesi3, G. Ferrari3, S.-C. Gou2, F. Dalfovo3, N.P. Proukakis1{}^{1}*

In this Supplementary material we provide more detailed examples of the evolution presented in this manuscript.

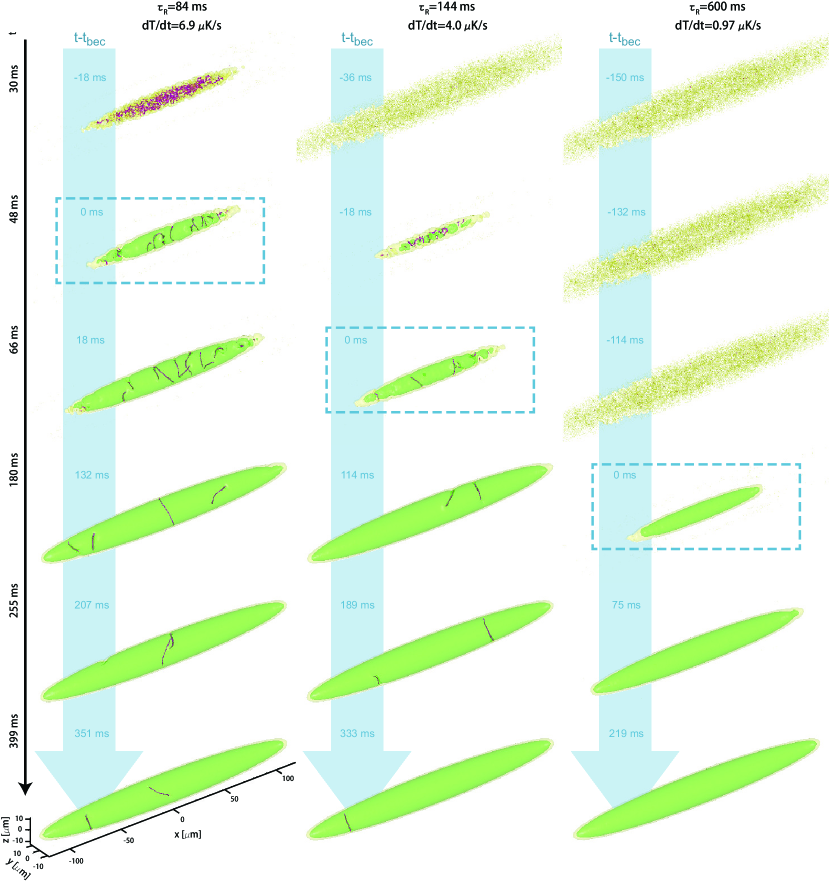
  • Supplementary Fig. 1 shows side-by-side the evolution of characteristic density isosurfaces of the highest-populated (Penrose-Onsager) mode for a single run based on the same dynamical noise sequence and 3 different quench rates, characterised by their duration τRsubscript𝜏𝑅\tau_{R}. The more tangled evolution at early times, and the longer survival of defects in the fastest quench is visible.

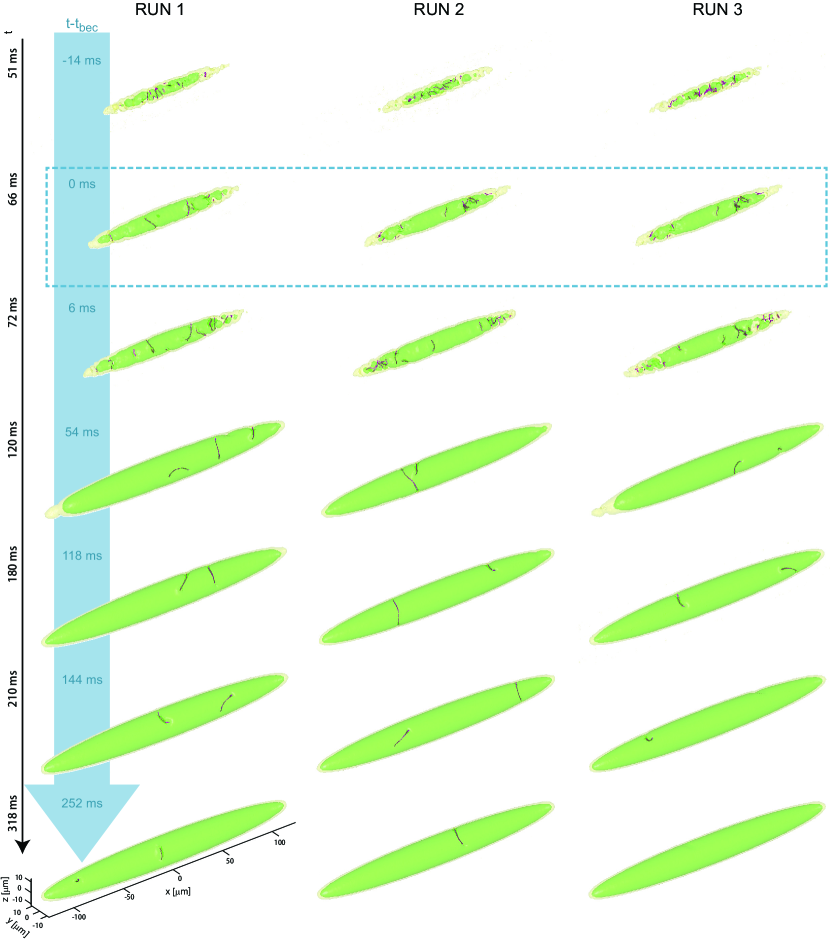
  • Supplementary Fig. 2 shows characteristic examples of evolution of the Penrose-Onsager mode for a given quench rate (τR=144subscript𝜏𝑅144\tau_{R}=144 ms), demonstrating clearly the stochastic nature of the defect generation, and the stark differences between different numerical runs – a detailed analysis of which sets the error bars in Fig. 4 of the main paper.

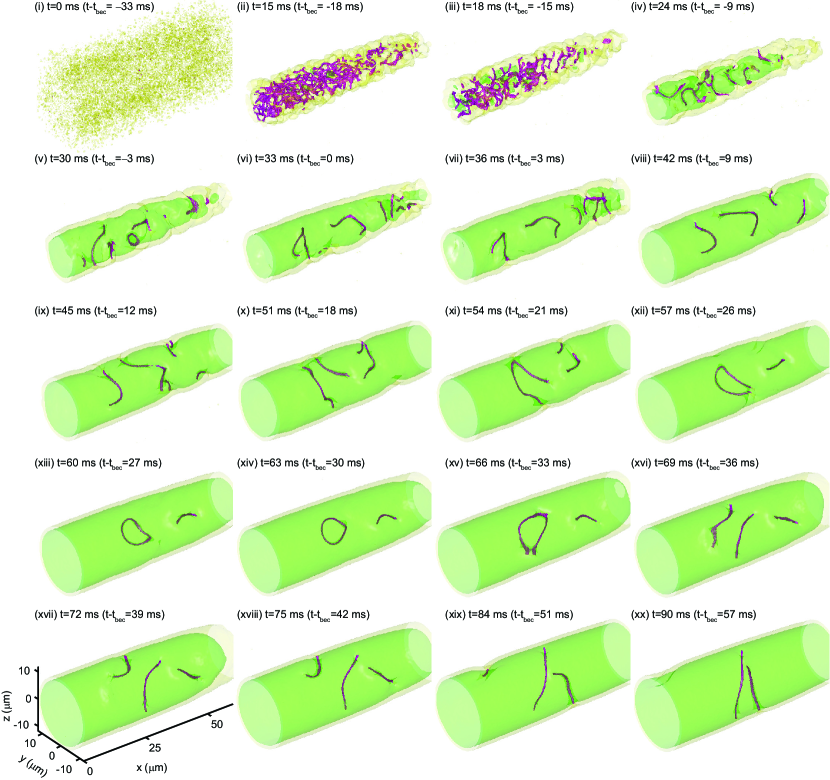
  • Supplementary Fig. 3 shows the evolution of the Penrose-Onsager mode in a focused spatial region and small time-intervals for a single-run corresponding to a fast quench (τR=18subscript𝜏𝑅18\tau_{R}=18ms), clearly demonstrating the various types of processes that dominate the early physics of the system as it crosses the phase transition after which the initially-tangled-up generated defects interact and relax.

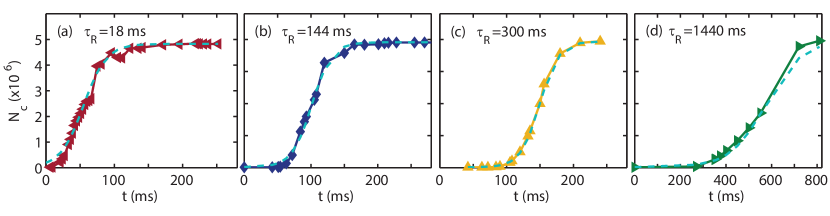
  • Supplementary Fig. 4 demonstrates our fitting procedure for extracting the condensate quenched growth timescale τGsubscript𝜏𝐺\tau_{G}.

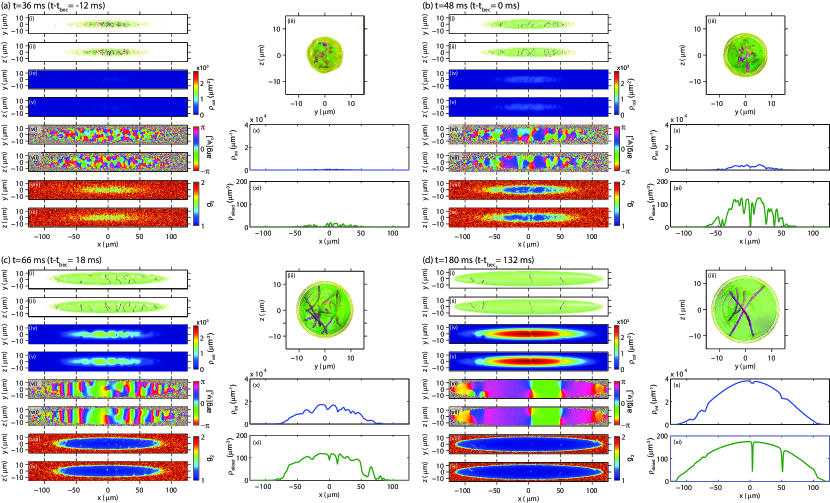
  • Supplementary Fig. 5 shows different projections of the condensate wavefunction, phase and local second-order correlation function, depicting clearly the defect relaxation to solitonic vortices at late evolution times.

We also provide here real-time evolution movies corresponding to the data shown in Supplementary Figures 1, 2, 3 and 5 (with more snapshots).

  • Caption to Movie Liu-et-al-SM-Movie-1:
    Dependence of Condensate Growth and Equilibration on Quench Rate: Evolution of typical density isosurfaces of the highest-occupied (Penrose-Onsager) modes for different ramp durations τR=84, 144subscript𝜏𝑅84144\tau_{R}=84,\,144 and 600 ms (from left to right). [See also Supplementary Material Fig. 1]

  • Caption to Movie Liu-et-al-SM-Movie-2:
    Shot-to-Shot Fluctuations During Condensate Growth: Shot-to-shot variations in the evolution of typical density isosurfaces of the highest-occupied (Penrose-Onsager) modes for a ramp duration τR=144subscript𝜏𝑅144\tau_{R}=144 ms, with depicted images starting just before the system reaches the condensation onset time tbecsubscript𝑡bect_{\rm bec}. [See also Supplementary Material Fig. 2]

  • Caption to Movie Liu-et-al-SM-Movie-3:
    Emergence, Interaction and Relaxation of Vortices in a Growing Condensate: Evolution of typical density isosurfaces of the highest-occupied (Penrose-Onsager) mode for a fast ramp (τR=18subscript𝜏𝑅18\tau_{R}=18 ms) clearly demonstrating the complexity of vortex tangle generation, unravelling and subsequent defect interaction and relaxation. [See also Supplementary Material Fig. 3.]

  • Caption to Movie Liu-et-al-SM-Movie-4:
    Dynamical Condensation Representation: Evolution of the highest-occupied (Penrose-Onsager) mode for τR=144subscript𝜏𝑅144\tau_{R}=144 ms, depicted from two different viewing angles for density profile of Penrose-Onsager mode, and corresponding sliced profiles showing the related information for the density, phase and local second-order correlation function on y=0𝑦0y=0 (top) and z=0𝑧0z=0 (bottom) planes. [See also Supplementary Material Fig. 5 which also gives corresponding definitions.]

Refer to caption
Figure 1: Dependence of Condensate Growth and Equilibration on Quench Rate: Shown are single-realisation density profile evolutions for 3 typical ramps (from left to right: τR=84, 144, 600subscript𝜏𝑅84144600\tau_{R}=84,\,144,\,600 ms), with all subplots depicting density isosurfaces of the highest-occupied (Penrose-Onsager) modes at values 3% (green regions) and 0.1% (yellow regions). Each row corresponds to a different absolute time t𝑡t from the moment the system is quenched, also depicting the corresponding shifted time (ttbec)𝑡subscript𝑡bec(t-t_{\rm bec}) which depends on τRsubscript𝜏𝑅\tau_{R} (and so varies from column to column). All cases demonstrate an initial narrowing of the spatial distribution as the system approaches the critical region. Faster quenches are shown to have a more violent random defect tangle generation at ttbecless-than-or-similar-to𝑡subscript𝑡bect\lesssim t_{\rm bec} thus exhibiting more defects at tbecsubscript𝑡bect_{\rm bec} [boxed plots] when the condensates have similar sizes. At late times, faster quenches exhibit more vortices, with the slowest quench considered here never acquiring a vortex within the high density region. Runs shown here are based on exactly the same dynamical noise sequence and are for illustrative purposes. Our estimated values for tbecsubscript𝑡bect_{\rm bec} for the three ramps are respectively (from left to right): tbec(τR=84ms)=483+4subscript𝑡becsubscript𝜏𝑅84mssuperscriptsubscript4834t_{\rm bec}(\tau_{R}=84\,{\rm ms})=48_{-3}^{+4} ms, tbec(τR=144ms)=663+6subscript𝑡becsubscript𝜏𝑅144mssuperscriptsubscript6636t_{\rm bec}(\tau_{R}=144\,{\rm ms})=66_{-3}^{+6} ms, and tbec(τR=600ms)=18012+6subscript𝑡becsubscript𝜏𝑅600mssuperscriptsubscript180126t_{\rm bec}(\tau_{R}=600\,{\rm ms})=180_{-12}^{+6} ms. (See also Suppementary Movie 1).
Refer to caption
Figure 2: Shot-to-Shot Fluctuations During Condensate Growth: Shown are 3D visualizations of the characteristic density profiles of the highest-occupied (Penrose-Onsager) mode for 3 different numerical realisations for the τR=144subscript𝜏𝑅144\tau_{R}=144 ms ramp, which remains in place until t=τR/2=72𝑡subscript𝜏𝑅272t=\tau_{R}/2=72ms (ttbec=6𝑡subscript𝑡bec6t-t_{\rm bec}=6ms). The difference in defect number between equal-parameter runs at late-time evolutions sets the error bars in our vortex counting shown in the main text. Our estimated value for the condensate onset time tbec(τR=144ms)=663+6subscript𝑡becsubscript𝜏𝑅144mssuperscriptsubscript6636t_{\rm bec}(\tau_{R}=144\,{\rm ms})=66_{-3}^{+6} ms. (See also Suppementary Movie 2).
Refer to caption
Figure 3: Emergence and Interaction of Vortices in a Growing (Quasi)condensate: Consecutive images depict gradual dynamical evolution of the density profiles of the highest-occupied (Penrose-Onsager) mode as the phase transition is crossed violently due to a rapid external quench (τR=18subscript𝜏𝑅18\tau_{R}=18 ms). Our focussed region, spanning only a subset of our numerical grid and of the final system size, depicts clearly both the initial defect tangle complexity (15 - 18 ms), tangle unravelling with associated subsequent increase in mean distances between defects (24 - 45 ms), occurring alongside defect interactions, including reconnections (with a clear isolated example show e.g. during 45 - 54 ms), vortex ejection (top right part of plot for 54 - 57 ms, and top left for 84 - 90 ms), dynamical vortex ring generation as intermediate defect collisional stage (63 ms), with clear evidence of transversal vortex stretching (e.g. 51 ms, 90 ms). Our estimated value for the condensate onset time tbec(τR=18ms)=333+3subscript𝑡becsubscript𝜏𝑅18mssuperscriptsubscript3333t_{\rm bec}(\tau_{R}=18\,{\rm ms})=33_{-3}^{+3} ms. (See also Suppementary Movie 3 demonstrating evolution over entire condensate length and up to later times).
Refer to caption
Figure 4: Condensate Growth and Emerging Timescales: Typical condensate growth curves as a function of (absolute) time t𝑡t, averaged over 333 realizations, shown from the moment that μ=0𝜇0\mu=0, alongside corresponding fits (dashed cyan lines) with Eq. (8) from Methods for ramps with (from left to right) τR=18, 144, 300,and 1440subscript𝜏𝑅18144300and1440\tau_{R}=18,\,144,\,300,\,{\rm and}\,1440 ms. The errors in the Penrose-Onsager number are smaller than the size of the depicted points, reconfirming the consistency of the Penrose-Onsager analysis despite the different density profiles between runs with same τRsubscript𝜏𝑅\tau_{R}. Corresponding extracted values of τGsubscript𝜏𝐺\tau_{G} are 16±2plus-or-minus16216\pm 2 , 14.9±1.7plus-or-minus14.91.714.9\pm 1.7,14.3±1.0plus-or-minus14.31.014.3\pm 1.0 and 78±13plus-or-minus781378\pm 13 ms, with errors representing the 95% confidence level of the fits. For reference, our estimated values for tbecsubscript𝑡bect_{\rm bec} for the ramps depicted here are respectively (from left to right): tbec(τR=18ms)=333+3subscript𝑡becsubscript𝜏𝑅18mssuperscriptsubscript3333t_{\rm bec}(\tau_{R}=18\,{\rm ms})=33_{-3}^{+3} ms, tbec(τR=144ms)=663+6subscript𝑡becsubscript𝜏𝑅144mssuperscriptsubscript6636t_{\rm bec}(\tau_{R}=144\,{\rm ms})=66_{-3}^{+6} ms, tbec(τR=300ms)=1083+7subscript𝑡becsubscript𝜏𝑅300mssuperscriptsubscript10837t_{\rm bec}(\tau_{R}=300\,{\rm ms})=108_{-3}^{+7} ms, and tbec(τR=1440ms)=35439+21subscript𝑡becsubscript𝜏𝑅1440mssuperscriptsubscript3543921t_{\rm bec}(\tau_{R}=1440\,{\rm ms})=354_{-39}^{+21} ms.
Refer to caption
Figure 5: Crossover from Random Defects to Solitonic Vortices: Shown are different visualizations of density and phase of the quenched (τR=84subscript𝜏𝑅84\tau_{R}=84 ms) mode corresponding to the largest eigenvalue at four characteristic evolution times 36, 48, 60, and 180 ms, corresponding to ttbec=12𝑡subscript𝑡bec12t-t_{\rm bec}=-12, 00, 181818 and 132132132 ms. In each panel, the top subpanels illustrate the highest-mode (Penrose-Onsager) density isosurfaces from different viewing angles set by (i) z=0𝑧0z=0 and (ii) y=0𝑦0y=0, with axial view images shown in the square panels in (iii). Subsequent panels (iv) and (v) depict the column-integrated densities, respectively integrated over the z𝑧z and y𝑦y axes, and the phase profiles in the (vi) z=0𝑧0z=0 and (vii) y=0𝑦0y=0 planes. The two bottom-left panels show the corresponding local second order correlation function, g2(𝐫,𝐫,𝐫,𝐫)subscript𝑔2𝐫𝐫𝐫𝐫g_{2}(\mathbf{r},\mathbf{r},\mathbf{r},\mathbf{r}), in the (viii) z=0𝑧0z=0 and (ix) y=0𝑦0y=0 planes. Transversally-integrated density of the Penrose-Onsager mode ρint(x)=𝑑y𝑑znPO(𝐫)subscript𝜌int𝑥double-integraldifferential-d𝑦differential-d𝑧subscript𝑛PO𝐫\rho_{\rm int}(x)=\iint dydzn_{\rm PO}(\mathbf{r}) is shown in (x), with the sliced density ρsliced(x)=nPO(x,y=0,z=0,t)\rho_{\rm sliced}(x)=n_{\rm PO}(x,y=0,z=0,t) shown in (xi), where nPOsubscript𝑛POn_{\rm PO} the Penrose-Onsager density. This figure demonstrates clearly the initial emergence of random-type defects (which are most clearly pronounced in the density cuts), the transition of the phase profile from random to solitonic-vortex-like, and the survival of only a handful of well-defined solitonic vortices at late evolution times, propagating on top of an otherwise largely relaxed Thomas-Fermi-like condensate profile. These images also highlight the difficulty in counting vortices at early times from any chosen integration angle. We note that tbec(τR=84ms)=483+3subscript𝑡becsubscript𝜏𝑅84mssuperscriptsubscript4833t_{\rm bec}(\tau_{R}=84\,{\rm ms})=48_{-3}^{+3} ms. (A more coarse-grained dynamical evolution of projected densities is shown in Supplementary Movie 4.)