Measuring the Internal Temperature of a Levitated Nanoparticle in High Vacuum
Abstract
The interaction of an object with its surrounding bath can lead to a coupling between the object’s internal degrees of freedom and its center-of-mass motion. This coupling is especially important for nanomechanical oscillators, which are amongst the most promising systems for preparing macroscopic objects in quantum mechanical states. Here we exploit this coupling to derive the internal temperature of a levitated nanoparticle from measurements of its center-of-mass dynamics. For a laser-trapped silica particle in high vacuum we find an internal temperature of . The measurement and control of the internal temperature of nanomechanical oscillators is of fundamental importance because blackbody emission sets limits to the coherence of macroscopic quantum states.
pacs:
I Introduction
Nanomechanical oscillators are used for inertial sensing and for the ultrasensitive measurement of forces and masses Degen et al. (2017); Mamin and Rugar (2001); Teufel et al. (2008); Jensen et al. (2008); Anetsberger et al. (2010); Moser et al. (2013). Especially impressive are the latest advances to use them for producing and sensing mechanical quantum states Chan et al. (2011). Amongst these oscillators, nanoparticles that are levitated in a strongly focused laser beam in vacuum stand out by lacking a mechanical clamping mechanism Li et al. (2011); Gieseler et al. (2012), which makes them promising candidates for quantum interference experiments with macroscopic objects Chang et al. (2010); Romero-Isart et al. (2011); Arndt and Hornberger (2014). Recently, the center-of-mass (COM) temperature of these levitated optomechanical systems has been reduced to only a few phonons using parametric Li et al. (2011); Gieseler et al. (2012); Jain et al. (2016), or cavity-based cooling schemes Kiesel et al. (2013); Asenbaum et al. (2013); Millen et al. (2015), and is therefore quickly approaching the quantum regime.
Quantum states of such mesoscopic mechanical objects are extremely sensitive to decoherence, arising from any interaction of the object with its environment. For example, at finite pressure, random collisions with residual gas molecules decohere the mechanical motion. In ultra-high vacuum, the radiation-pressure shot noise of the trapping laser is the dominant fluctuating force Jain et al. (2016). Importantly, even in the absence of a trapping laser, for example during a matter-wave-interference free-fall experiment Hackermüller et al. (2004); Romero-Isart et al. (2011); Bateman et al. (2014), there is a decoherence mechanism at work. This mechanism is the recoil force stemming from emitted blackbody photons due to the finite internal temperature of the trapped particle. In high-vacuum, where thermal emission is the only cooling channel for the internal particle temperature, even a minute absorption of the trapping laser by the particle can lead to an elevated internal temperature of a levitated object Chang et al. (2010); Romero-Isart et al. (2011); Bateman et al. (2014); Millen et al. (2014); Ranjit et al. (2015); Rahman et al. (2016); Juan et al. (2016); Rahman and Barker (2017). With the internal temperature limiting the lifetime of mesoscopic mechanical quantum states, the measurement and control of this internal temperature is a crucial prerequisite for future quantum interference experiments.
Moreover, even for levitated sensors in the classical regime, the internal temperature plays a central role. For instance, high internal temperatures are suspected to be the cause of particle loss at reduced gas pressures in numerous implementations Millen et al. (2014); Ranjit et al. (2015); Rahman et al. (2016). Furthermore, a coupling between the internal temperature and the COM motion has become apparent in earlier studies of levitated particles at pressures above Millen et al. (2014). This coupling leads to increased COM temperatures, which implies a reduced force sensitivity of levitated sensors Ranjit et al. (2015, 2016). Despite its evident importance in the field of levitated optomechanics, the internal temperature and its influence on the COM motion has not yet been studied in the high vacuum regime below , where the exceptional quality factors of levitated systems can be exploited for ultra-sensitive measurements, cooling of the COM temperature, and the future creation of mechanical quantum states.
In this work, we measure the internal particle temperature in high vacuum ( to ) by selectively heating the particle with an infrared laser that is much lower in power than the trapping laser. Accordingly, this separate heating laser allows us to vary the internal particle temperature without affecting the trapping potential. By measuring the thermal relaxation dynamics of the particle’s COM motion at varying internal temperatures, we quantify the influence of the particle’s internal temperature on its COM dynamics. We model the interactions of an internally hot particle with a dilute gas Millen et al. (2014) to determine the internal particle temperature and the energy accommodation coefficient, which characterizes the energy transfer between the particle’s internal degrees of freedom and the surrounding gas.
II Experimental System
Figure 1 shows our experimental setup. We use a Nd:YAG laser operating at a wavelength of with a power of that we focus with an objective (numerical aperture ) to optically trap a nanoparticle with a nominal radius of inside a vacuum chamber. All data shown in this work is recorded using the same nanoparticle. Besides small variations in mass from particle to particle, we find identical results when using different particles. In forward direction, the scattered light is collected with an aspheric lens to detect the particle position along three axes () with a balanced detection scheme Gieseler et al. (2012). For small oscillation amplitudes, the COM motion of the levitated nanoparticle along the coordinate (equivalently for and ) follows the equation of motion of a damped harmonic oscillator
| (1) |
Here, is the particle mass, the damping rate and the oscillation frequency. Typical mechanical oscillation frequencies are , , and for the oscillation in , , and direction, respectively. The random fluctuating force describes the particle’s interactions with the environment. Throughout this work, we operate in a pressure range of to , where these interactions are dominated by collisions with gas molecules. In thermal equilibrium, the particle’s COM motion is characterized by the temperature , which equals the bath temperature of the gas . The COM temperature is given by , where is the variance of the particle velocity and is the Boltzmann constant Hebestreit et al. (2017). Using this relation between bath temperature and oscillation amplitude, we calibrate our detector signal at a pressure of , where the gas temperature can be considered in equilibrium with room temperature. Subsequently, we transfer this calibration to low pressure by measuring the particle’s response to an electric field as detailed in Ref. Hebestreit et al. (2017). Using the position information obtained from the light scattered by the particle, we apply a parametric feedback in order to cool the particle’s COM temperature to Gieseler et al. (2012). Table 1 gives an overview of relevant parameters used in this work.
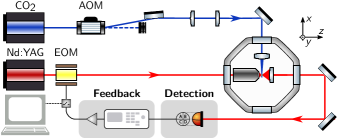
To control the internal temperature of the optically levitated nanoparticle without changing the optical trapping potential, we use a laser with a wavelength of (blue beam in Fig. 1) that illuminates the particle perpendicular to the propagation direction of the trapping beam. We adjust the laser intensity using an acousto-optic modulator (AOM). At a wavelength of the optical absorption of silica is more than 7 orders of magnitude larger than at Kitamura et al. (2007). Therefore, a weakly focused laser beam (numerical aperture ) with a peak intensity is sufficient to tune the particle’s internal temperature for our experiments. Importantly, the optical forces generated by the laser on the particle are negligible. We estimate that the stiffening of the trapping potential due to the laser causes a shift of the oscillation frequency of less than and the radiation pressure of the laser results in a displacement of the equilibrium position of .
| Symbol | Unit | Description |
|---|---|---|
| Temperature of the COM motion | ||
| Effective bath temperature of gas in vacuum chamber | ||
| Internal temperature of the particle (in absence of laser illumination) | ||
| Natural oscillation frequency | ||
| COM gas damping rate (inverse of relaxation time) | ||
| COM single-phonon heating rate due to interactions with the gas | ||
| Gas energy heating rate (at which the COM temperature increases) | ||
| Peak intensity of the laser in the focus (at the particle position) | ||
| Shift of natural oscillation frequency due to increasing with the laser | ||
| Change of internal particle temperature due to laser irradiation | ||
| Energy accommodation coefficient (energy transfer between gas and particle) | ||
| () | Temperature of the gas molecules impinging on (emerging from) the particle | |
| () | COM damping rate caused by impinging (emerging) gas molecules | |
| () | COM energy heating rate caused by impinging (emerging) gas molecules |
III Measurement of particle dynamics
Using the optical levitation setup described above, we investigate the coupling between the particle’s internal temperature and its COM motion. To measure the COM dynamics of the particle, we perform relaxation experiments that are described in Sec. III.1. In Sec. III.2, we determine the change of the particle’s internal temperature when activating the laser from the change of the particle’s oscillation frequency . Both measurements, performed at varying gas pressures and at different laser intensities, allow us to deduce the absolute internal particle temperature (see Sec. V).
III.1 Measurement of center-of-mass temperature
We investigate the coupling between the internal temperature and the COM motion of the particle by performing relaxation experiments. Each relaxation cycle starts with the particle under parametric feedback cooling along all three oscillation axes. We switch off the feedback and let the particle’s COM motion relax from a feedback-cooled state with to the bath temperature of the surrounding gas. From the evolution of the COM temperature, we extract the damping rate and , which describe the particle’s dynamics according to Eq. (1). These two quantities determine the single-phonon heating rate , which is the rate at which phonons enter the COM oscillation mode. is a measure for the interaction strength of the particle’s COM motion with its environment Gieseler et al. (2014).
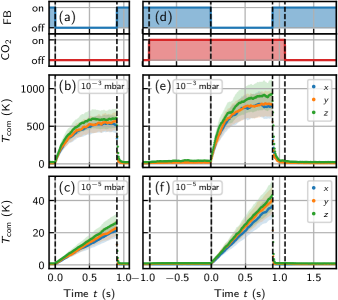
In Fig. 2(a), we show our experimental protocol for a single relaxation cycle in absence of laser heating, consisting of three steps: (1) initializing the particle’s COM temperature well below the bath temperature with the parametric feedback (FB), (2) switching off the feedback at time to allow for a relaxation of the particle’s COM temperature to the bath temperature, (3) reactivating the feedback after . During each relaxation cycle we record a time trace of the particle’s position, from which we calculate its kinetic energy in sections of Hebestreit et al. (2017). In Fig. 2(b) we plot, for a pressure of , the COM temperature that we obtain as an average over the kinetic energy of 1000 realizations of the relaxation cycle. We observe that after turning the parametric feedback off at , the COM temperature in all three axes rises at the same rate and asymptotically approaches a steady-state temperature of . Importantly, this bath temperature is significantly higher than the surrounding temperature of . Thus, the bath temperature felt by the particle is not the surrounding temperature, but an effective bath temperature. We reason in Sec. IV that the increased bath temperature is caused by an elevated internal temperature of the particle. When switching the feedback on again, the COM temperature is cooled to , such that the system is initialized for the next experimental cycle.
The temporal evolution of the COM temperature is described by the rate equation Gieseler et al. (2014); Jain et al. (2016)
| (2) |
Here, for convenience, instead of using the single-phonon heating rate in units of , we define an energy heating rate in units of . The first term on the right-hand side of Eq. (2) describes the dissipation of energy from the COM oscillation, while the second term characterizes the rate at which energy enters the oscillation mode from the environment. For , we find that the COM temperature equals the bath temperature . Solving Eq. (2) yields the evolution from the initial COM temperature as
| (3) |
We fit Eq. (3) to the measured relaxation curves shown in Fig. 2(b) to extract the damping rate , and derive a heating rate of . We summarize all the measurement results from Fig. 2 in Tab. 2.
| Fig. | ||||||
|---|---|---|---|---|---|---|
| 2(b) | – | |||||
| 2(e) | ||||||
| 2(c) | – | – | – | |||
| 2(f) | – | – |
When lowering the gas pressure to , as shown in Fig. 2(c), we observe relaxation dynamics that are 100 times slower than those at such that letting the particle reheat close to its steady-state COM temperature would require for a single relaxation cycle and sufficiently many experimental cycles to average out the thermal fluctuations would take prohibitively long. Therefore, at low pressures, where , we only capture the linear beginning of the relaxation curve, where the COM temperature evolves as . We find that the slope of the COM temperature in Fig. 2(c) corresponds to a heating rate of . Comparing the heating rates obtained from the experiments shown in Figs. 2(b) and (c) shows that scales linearly with pressure. Given the linear pressure dependence of the damping rate , this suggests a pressure-independent bath temperature , which can be attributed to the absence of convective cooling at pressures below (see Sec. VI) Gieseler et al. (2012); Jain et al. (2016).
Up to this point, we considered the particle in the absence of additional heating by laser irradiation. In order to study the influence of the internal particle temperature on the dynamics, we repeat the relaxation experiments with an elevated internal particle temperature. Each relaxation cycle follows the sequence shown in Fig. 2(d): We start with the particle in a feedback-cooled state and activate the laser at . Experimentally, we find that the particle’s internal temperature equilibrates within a few (cf. Sec. III.2) Bateman et al. (2014). We therefore wait for , before switching off the feedback at time for . After the relaxation cycle, we switch off the laser at time to let the particle’s internal temperature cool down to its initial value. In Fig. 2(e), we show the temperature relaxation along the three axes of the COM motion at a pressure of for a particle heated with the laser. We observe a relaxation to a COM temperature of , which is higher than that observed in the absence of additional heating [cf. Fig. 2(b)]. This shows that increasing the internal particle temperature effectively causes a rise in the extracted bath temperature . Furthermore, we measure a higher damping rate in the case with additional heating, which results in an increase of the heating rate by compared to Fig. 2(b) in the absence of laser heating (see Tab. 2). Accordingly, an increased internal temperature of the trapped particle gives rise to an increased (effective) bath temperature , entailing an increased heating rate .
In Fig. 2(f), we plot the measured relaxation curves for the internally heated particle at . We observe, in agreement with the results at , that the heating rate increases by in comparison with the results in Fig. 2(c) for the non-heated particle (see Tab. 2).
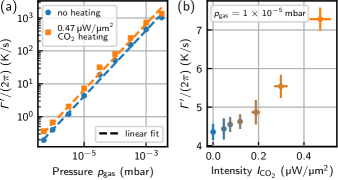
To determine the particle’s COM dynamics at different pressures and internal temperatures, we perform relaxation measurements in a pressure range between and . Furthermore, we vary the intensity in the focus of the laser from to . To account for possible drifts of the experimental setup, we re-calibrated our detectors at and . In Fig. 3(a), we summarize the measured heating rates for different pressures. Below , the heating rate depends linearly on the gas pressure. Furthermore, the heating rates under illumination with the laser (orange) are consistently higher than for the case without increasing the internal temperature (blue). The dependence of the heating rate on the peak intensity of the laser is shown in Fig. 3(b). Our measurements show a clear dependence of the COM dynamics on laser irradiation, which suggests a coupling between the COM motion and the particle’s internal temperature.
III.2 Measurement of internal temperature change
Increasing the internal particle temperature in a controlled way with the laser enables us to study the dependence of the particle dynamics on the internal particle temperature . For a quantitative analysis, we additionally require an independent measurement of the increase of the internal particle temperature due to the laser irradiation. We deduce the change in the internal temperature using the temperature dependence of the particle’s material properties. In particular, we exploit the temperature dependence of the mass density Brückner (1970) and the refractive index Waxler and Cleek (1973) of silica. These material properties lead to a temperature dependent oscillation frequency of the particle, which scales as Gieseler et al. (2012). In Fig. 4(a), we plot as a blue line the calculated relative shift of the particle’s oscillation frequency as a function of the internal particle temperature according to the material data listed in Refs. Waxler and Cleek (1973); Brückner (1970), where denotes the oscillation frequency at an internal temperature of . The relative oscillation-frequency shift depends almost linearly on the internal particle temperature and we find a proportionality factor . Accordingly, we can determine the relative increase in internal temperature of the particle caused by the irradiation by the laser from the relative shift of the particle oscillation frequency. This assumes that the internal temperature is homogeneous across the particle Millen et al. (2014). Furthermore, since there is no data available for the refractive index of glass above , we extend the linear trend of the relative frequency change found in Fig. 4(a) to a temperature of , the highest internal particle temperature occurring in this work.
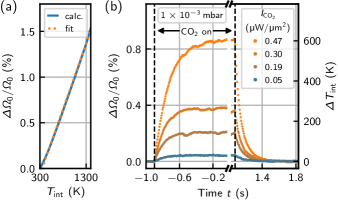
In Fig. 4(b), we show the measured relative change in oscillation frequency as a function of time when heating the particle with different laser intensities at a pressure of . We perform repeated heating cycles, where we start with the particle’s COM motion being feedback cooled and the heating laser being switched off. We activate the laser from to [cf. Fig. 2(d,e)], in order to illuminate the particle with a laser intensity of up to . During the entire heating cycle, we record the COM position of the particle along the three axes, extract the oscillation frequency from segments of length, and average each segment over 1000 realizations. We calculate the relative change of the oscillation frequency and average over the three oscillation axes. After activating the laser, we find an up-shift of the oscillation frequency of up to for the maximum laser intensity. We interpret this frequency shift as an increase of the internal particle temperature due to absorption heating. Applying the linear conversion factor of found in Fig. 4(a), we obtain a change in the particle’s internal temperature of . Using higher laser intensities causes particle loss during the heating cycle. We attribute these losses to strong changes in material properties when reaching the working point of glass, or to the high COM oscillation amplitudes due to the elevated internal temperature of the particle.
IV Two-bath model of gas interactions
Having established experimental methods to measure the particle’s COM dynamics and the change of its internal temperature due to laser irradiation, in the following, we develop a theoretical model to extract the internal particle temperature at any gas pressure. We describe the interaction of an internally hot particle with the surrounding gas following the model developed in Ref. Millen et al. (2014). It assumes an inelastic scattering process, that is, an impinging gas molecule with temperature heats up to a temperature upon interacting with the hot particle. As a consequence, the particle interacts with two different baths, the bath of impinging molecules with parameters , , , and the bath of emerging gas molecules with parameters , , Epstein (1924). Therefore, the total gas damping rate is and the total gas heating rate equals Millen et al. (2014). The damping rate associated with the emerging gas molecules is and the damping rate due to the impinging gas molecules is . Here, is the mean velocity of gas molecules, where is the molar mass of the gas and is Avogadro’s constant Millen et al. (2014). Introducing the energy accommodation coefficient , which describes the energy transfer from the particle to the gas, we find that the total heating rate follows
| (4) |
It depends on the particle’s properties (radius, mass, and internal temperature), the gas properties (pressure, temperature, and composition), and the energy transfer between particle and gas. This two-bath model predicts that increasing the particle’s internal temperature causes a rise of the gas heating rate , which is what we observe experimentally in Fig. 2. In particular, as described in the following section, we are able to derive the internal temperature of the particle using the measured heating rates (c.f. Fig. 3a).
V Internal particle temperature
According to Eq. (4), the heating rate depends on the internal temperature of the particle , the energy accommodation coefficient , the molar mass of the gas and the temperature of the impinging gas molecules , which equals the temperature of the vacuum chamber walls and is measured throughout the experiment. To determine the molar mass of the gas, we measure the gas composition at pressures below with a residual gas analyzer. We find that the gas consists to of water vapor, and contains in addition nitrogen, hydrogen, oxygen and carbon dioxide. We deduce an average molar mass of . The energy accommodation coefficient also depends on the gas composition in the vacuum chamber. However, as the energy accommodation coefficient of water vapor on silica is not known, for now, we assume a value of . At the end of this section, we justify this choice by determining the accommodation coefficient from the experimental data.
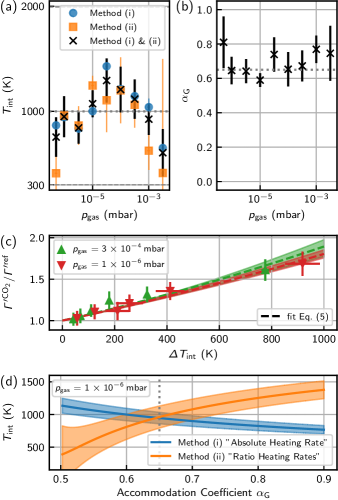
We deduce the internal particle temperature from the measured heating rates in two ways: (i) from the absolute measured heating rates in the absence of laser heating, and (ii) using the heating rate measured at varying internal temperatures , where the change in the internal temperature is known from the oscillation frequency shift (see Sec. III.2). For method (i), we solve Eq. (4) for and use the heating rates measured in Fig. 3(a) (blue data points). In Fig. 5(a), we plot in blue the internal temperature that we extract with this method for different gas pressures. We obtain temperature values that are distributed between and .
For method (ii), we compute the ratio of the measured heating rate in the presence of the heating laser and the heating rate in absence of the heating laser. From Eq. (4), we find the theoretical expression
| (5) |
The temperature of the emerging gas molecules in the case with the activated laser is , and without additional heating . We measure the change of internal temperature using the shift in oscillation frequency as described in Sec. III.2. Accordingly, we can deduce the absolute internal particle temperature as the only free parameter in Eq. (5). We plot the ratio of the heating rates with and without the laser in Fig. 5(c) at (green) and at (red) for 6 different laser intensities. To these data points we fit Eq. (5) (dashed lines). The shaded areas indicate the confidence interval of the fit. The only free parameter for the fits is the absolute internal temperature of the particle in the absence of laser irradiation. We plot these internal particle temperatures that were extracted with method (ii) in Fig. 5(a) in orange and find values in a similar range like for method (i).
So far, we have discussed two independent methods to determine the internal temperature of the particle using the absolute value of the heating rate, or the ratio of the heating rates at different internal temperatures. However, in both cases we had to assume a value for the a priori unknown energy accommodation factor . We now combine both methods to deduce both the internal particle temperature and the energy accommodation coefficient from the experimental data. In Fig. 5(d), we show for a pressure of the calculated internal particle temperature determined using the two methods for varying accommodation coefficients between and . While methods (i) and (ii) are independent, they should both yield the same result for the internal particle temperature. Accordingly, the intersection of both graphs in Fig. 5(d) provides the accommodation coefficient, where the results of both methods coincide. In this example at , we find without the laser activated, and . In Fig. 5(a), we plot in black the internal particle temperature that we determine using the combined method at the different gas pressures. We compare these measurements with the corresponding model in Sec. VI. In addition, in Fig. 5(b), we show the corresponding energy accommodation coefficient for the different gas pressures. For the energy accommodation coefficient, we do not find a significant trend when lowering the gas pressure, suggesting that in our setup below the relative gas composition does not depend on pressure. This conclusion is supported by our measurement of the gas composition using a residual gas analyzer. Accordingly, we deduce a mean energy accommodation factor of by averaging over all the measurements in Fig. 5(b).
VI Thermodynamic Estimations
Now that we are able to measure the internal particle temperature we compare our results with theoretical thermodynamic estimations. We consider the following thermal absorption and emission processes that the particle experiences: The particle’s internal energy increases due the to absorption of laser light and incident blackbody radiation from the environment. On the other hand, the particle dissipates internal energy through blackbody radiation and gas convection Chang et al. (2010). In thermodynamic equilibrium, we derive a steady-state internal temperature of the particle .
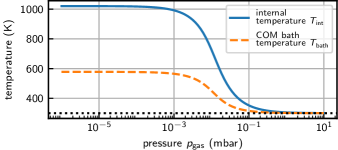
In Fig. 6, we plot the internal temperature for varying gas pressure that we calculate following Ref. Chang et al. (2010) (blue solid line). Here, we assume an accommodation coefficient of as we measured before in Sec. V, and the refractive index of silica listed in Ref. Kitamura et al. (2007). This calculation shows that there is a transition from low internal temperatures at pressures above , where the dissipation of internal energy is dominated by gas convection, to high internal temperatures below , where the only efficient dissipation mechanism is blackbody emission Ranjit et al. (2015). For our parameters, the equilibrium temperature at pressures below stabilizes at . Therefore, we also expect a constant internal particle temperature for gas pressures below in our experiment. Computing the weighted average of the measured internal particle temperature below from Fig. 5(a) (black crosses), we find , which is in agreement with the thermodynamic estimate. We attribute the deviations of the data in Fig. 5(a) from this model to measurement uncertainty and drift of the calibration.
Additionally, we plot in Fig. 6 the expected effective COM bath temperature (orange dashed line) for our experimental parameters and the energy accommodation factor of that we previously deduced from our measurements. The bath temperature approaches a value of at high vacuum, where convective cooling through the residual gas becomes negligible. This theoretical result is in agreement with our measurement in Fig. 2(b).
VII Conclusion
We have shown that the coupling between the internal degrees of freedom of a levitated nanoparticle and its COM motion persists in a gas pressure range from to . This coupling causes an elevated effective bath temperature above room temperature at high vacuum, which is of importance for levitated particle sensors as it decreases the sensitivity compared to an equivalent sensor at room temperature Ranjit et al. (2015, 2016). We expect this coupling to be present also for lower pressures, up to a point where interactions with the photon bath start to dominate the COM dynamics of the levitated particle Jain et al. (2016). In this lower pressure regime, other coupling mechanisms between the internal and COM temperature will become important, e.g., mediated through the recoil of blackbody photons that depend on the internal particle temperature.
Furthermore, using the gas-mediated coupling and applying a model of the interaction of the particle with the surrounding dilute gas, we estimate the internal particle temperature. For our system, we deduce a mean internal particle temperature of at gas pressures below and an energy accommodation coefficient of . This high internal particle temperature is mainly caused by absorptive heating of the trapping laser and weak emission of blackbody radiation. We point out that our method is not limited to determining the internal temperature of optically levitated silica nanoparticles, but is universally applicable to any other material system that can be levitated and COM cooled.
In view of future quantum interference experiments, which require internal particle temperatures well below room temperature to achieve superpositions larger than the particle diameter, our measurements underline the importance of developing methods to control the internal particle temperature, as decoherence due to blackbody radiation prevents the appearance of interference patterns for high internal particle temperatures Romero-Isart et al. (2011); Kaltenbaek et al. (2012); Arndt and Hornberger (2014). Cooling of the internal particle temperature, as demonstrated at high gas pressure for levitated systems with an internal level structure, could serve as a key technology to reduce those decoherence effects for optically levitated particles Rahman and Barker (2017). As the internal particle temperature is determined by the absorption of the trapping laser, one may consider combining different particle materials with suitable trapping wavelengths, such as silicon and telecom wavelength Bateman et al. (2014). Further possibilities to reduce the internal particle temperature include alternative levitation strategies, such as Paul traps Millen et al. (2015) and magnetic levitation Romero-Isart et al. (2012).
Acknowledgements.
The authors acknowledge valuable discussions with C. Dellago, O. Romero-Isart, and J. Gieseler. We thank P. Kurpiers and A. Wallraff for lending us their residual gas analyzer. This work has been supported by ERC-QMES (No. 338763) and the Swiss National Centre of Competence in Research (NCCR) - Quantum Science and Technology (QSIT) program (No. 51NF40-160591).References
- Degen et al. (2017) C. L. Degen, F. Reinhard, and P. Cappellaro, Rev. Mod. Phys. 89, 035002 (2017).
- Mamin and Rugar (2001) H. J. Mamin and D. Rugar, Appl. Phys. Lett. 79, 3358 (2001).
- Teufel et al. (2008) J. D. Teufel, J. W. Harlow, C. A. Regal, and K. W. Lehnert, Phys. Rev. Lett. 101, 197203 (2008).
- Jensen et al. (2008) K. Jensen, K. Kim, and A. Zettl, Nat. Nanotechnol. 3, 533 (2008).
- Anetsberger et al. (2010) G. Anetsberger, E. Gavartin, O. Arcizet, Q. P. Unterreithmeier, E. M. Weig, M. L. Gorodetsky, J. P. Kotthaus, and T. J. Kippenberg, Phys. Rev. A 82, 061804 (2010).
- Moser et al. (2013) J. Moser, J. Güttinger, A. Eichler, M. J. Esplandiu, D. E. Liu, M. I. Dykman, and A. Bachtold, Nat. Nanotechnol. 8, 493 (2013).
- Chan et al. (2011) J. Chan, T. P. M. Alegre, A. H. Safavi-Naeini, J. T. Hill, A. Krause, S. Gröblacher, M. Aspelmeyer, and O. Painter, Nature 478, 89 (2011).
- Li et al. (2011) T. Li, S. Kheifets, and M. G. Raizen, Nat. Phys. 7, 527 (2011).
- Gieseler et al. (2012) J. Gieseler, B. Deutsch, R. Quidant, and L. Novotny, Phys. Rev. Lett. 109, 103603 (2012).
- Chang et al. (2010) D. E. Chang, C. A. Regal, S. B. Papp, D. J. Wilson, J. Ye, O. Painter, H. J. Kimble, and P. Zoller, Proc. Natl. Acad. Sci. U.S.A. 107, 1005 (2010).
- Romero-Isart et al. (2011) O. Romero-Isart, A. C. Pflanzer, F. Blaser, R. Kaltenbaek, N. Kiesel, M. Aspelmeyer, and J. I. Cirac, Phys. Rev. Lett. 107, 020405 (2011).
- Arndt and Hornberger (2014) M. Arndt and K. Hornberger, Nat. Phys. 10, 271 (2014).
- Jain et al. (2016) V. Jain, J. Gieseler, C. Moritz, C. Dellago, R. Quidant, and L. Novotny, Phys. Rev. Lett. 116, 243601 (2016).
- Kiesel et al. (2013) N. Kiesel, F. Blaser, U. Delic, D. Grass, R. Kaltenbaek, and M. Aspelmeyer, Proc. Natl. Acad. Sci. U.S.A. 110, 14180 (2013).
- Asenbaum et al. (2013) P. Asenbaum, S. Kuhn, S. Nimmrichter, U. Sezer, and M. Arndt, Nat. Commun. 4, 2743 (2013).
- Millen et al. (2015) J. Millen, P. Z. G. Fonseca, T. Mavrogordatos, T. S. Monteiro, and P. F. Barker, Phys. Rev. Lett. 114, 123602 (2015).
- Hackermüller et al. (2004) L. Hackermüller, K. Hornberger, B. Brezger, A. Zeilinger, and M. Arndt, Nature 427, 711 (2004).
- Bateman et al. (2014) J. Bateman, S. Nimmrichter, K. Hornberger, and H. Ulbricht, Nat. Commun. 5, 4788 (2014).
- Millen et al. (2014) J. Millen, T. Deesuwan, P. Barker, and J. Anders, Nat. Nanotechnol. 9, 425 (2014).
- Ranjit et al. (2015) G. Ranjit, D. P. Atherton, J. H. Stutz, M. Cunningham, and A. A. Geraci, Phys. Rev. A 91, 051805 (2015).
- Rahman et al. (2016) A. T. M. A. Rahman, A. C. Frangeskou, M. S. Kim, S. Bose, G. W. Morley, and P. F. Barker, Sci. Rep. 6, 21633 (2016).
- Juan et al. (2016) M. L. Juan, G. Molina-Terriza, T. Volz, and O. Romero-Isart, Phys. Rev. A 94, 023841 (2016).
- Rahman and Barker (2017) A. T. M. A. Rahman and P. F. Barker, Nat. Photonics 11, 634 (2017).
- Ranjit et al. (2016) G. Ranjit, M. Cunningham, K. Casey, and A. A. Geraci, Phys. Rev. A 93, 053801 (2016).
- Hebestreit et al. (2017) E. Hebestreit, M. Frimmer, R. Reimann, C. Dellago, F. Ricci, and L. Novotny, (2017), arXiv:1711.09049 .
- Kitamura et al. (2007) R. Kitamura, L. Pilon, and M. Jonasz, Appl. Opt. 46, 8118 (2007).
- Gieseler et al. (2014) J. Gieseler, R. Quidant, C. Dellago, and L. Novotny, Nat. Nanotechnol. 9, 358 (2014).
- Brückner (1970) R. Brückner, J. Non-Cryst. Solids 5, 123 (1970).
- Waxler and Cleek (1973) R. M. Waxler and G. Cleek, J. Res. Natl. Stand. Sec. A 77A, 755 (1973).
- Epstein (1924) P. Epstein, Phys. Rev. 23, 710 (1924).
- Kaltenbaek et al. (2012) R. Kaltenbaek, G. Hechenblaikner, N. Kiesel, O. Romero-Isart, K. C. Schwab, U. Johann, and M. Aspelmeyer, Exp. Astron. 34, 123 (2012).
- Romero-Isart et al. (2012) O. Romero-Isart, L. Clemente, C. Navau, A. Sanchez, and J. I. Cirac, Phys. Rev. Lett. 109, 147205 (2012).