This manuscript version is distributed under the CC-BY-NC-ND (Creative Commons) license.
It has appeared in final form as:
Van Albada SJ, Gray RT, Drysdale PM, Robinson PA. Mean-field modeling of the basal
ganglia-thalamocortical system. II. Dynamics of parkinsonian oscillations (2009) J
Theor Biol 257:664–688, DOI: 10.1016/j.jtbi.2008.12.013
Mean-field modeling of the basal ganglia-thalamocortical system. II. Dynamics of parkinsonian oscillations
Abstract
Neuronal correlates of Parkinson’s disease (PD) include a shift to lower frequencies in the electroencephalogram (EEG) and enhanced synchronized oscillations at 3–7 and 7–30 Hz in the basal ganglia, thalamus, and cortex. This study describes the dynamics of a recent physiologically-based mean-field model of the basal ganglia-thalamocortical system, and shows how it accounts for many key electrophysiological correlates of PD. Its detailed functional connectivity comprises partially segregated direct and indirect pathways through two populations of striatal neurons, a hyperdirect pathway involving a corticosubthalamic projection, thalamostriatal feedback, and local inhibition in striatum and external pallidum (GPe). In a companion paper, realistic steady-state firing rates were obtained for the healthy state, and after dopamine loss modeled by weaker direct and stronger indirect pathways, reduced intrapallidal inhibition, lower firing thresholds of the GPe and subthalamic nucleus (STN), a stronger projection from striatum to GPe, and weaker cortical interactions. Here it is shown that oscillations around 5 and 20 Hz can arise with a strong indirect pathway, which also causes increased synchronization throughout the basal ganglia. Furthermore, increased theta power with progressive nigrostriatal degeneration is correlated with reduced alpha power and peak frequency, in agreement with empirical results. Unlike the hyperdirect pathway, the indirect pathway sustains oscillations with phase relationships that coincide with those found experimentally. Alterations in the responses of basal ganglia to transient stimuli accord with experimental observations. Reduced cortical gains due to both nigrostriatal and mesocortical dopamine loss lead to slower changes in cortical activity and may be related to bradykinesia. Finally, increased EEG power found in some studies may be partly explained by a lower effective GPe firing threshold, reduced GPe-GPe inhibition, and/or weaker intracortical connections in parkinsonian patients. Strict separation of the direct and indirect pathways is not necessary to obtain these results.
1School of Physics, The University of Sydney
New South Wales 2006, Australia
2The Brain Dynamics Centre, Westmead Millennium Institute
Westmead Hospital and Western Clinical School of the University of Sydney
Westmead, New South Wales 2145, Australia
3National Centre in HIV Epidemiology and Clinical Research
Faculty of Medicine, The University of New South Wales
Sydney, New South Wales 2010, Australia
4 Faculty of Medicine, The University of Sydney
New South Wales 2006, Australia
1 Introduction
Parkinson, (1817) described a syndrome with symptoms including a stooped posture, shuffling gait (festination), sleep disturbances, and rest tremor. This disorder, which also leads to slowness of movement (bradykinesia), difficulty initiating movements (akinesia), and rigidity, was subsequently called Parkinson’s disease (PD). It is one of the most common movement disorders, affecting 0.5–3% of those over 65 (Tanner and Goldman,, 1996). The pathological hallmark of PD is the progressive degeneration of dopaminergic neurons in the substantia nigra pars compacta (SNc) and to a lesser extent the ventral tegmental area (VTA) (Bernheimer et al.,, 1973; Ehringer and Hornykiewicz,, 1960; Hirsch et al.,, 1988; Uhl et al.,, 1985). These nuclei provide dopaminergic input to the basal ganglia, a group of gray matter structures close to the thalamus concerned with reinforcement learning and the facilitation and modulation of movement (Graybiel,, 1990; Mink,, 1996). The main structures comprising the basal ganglia are the striatum, the substantia nigra, the globus pallidus internal (GPi) and external (GPe) segments, and the subthalamic nucleus (STN). Alterations in the associative and limbic functions of the basal ganglia are responsible for some of the cognitive symptoms and mood disturbances seen in PD.
In a companion paper [Van Albada and Robinson, (2009); henceforth referred to as Paper I] we introduced a physiologically realistic mean-field model of the basal ganglia-thalamocortical system (BGTCS), and assessed changes in average firing rates caused by loss of nigrostriatal dopamine. We found that an increase in the strength of cortical transmission to striatal cells expressing the D2 class of dopamine receptor, with or without a concurrent decrease in the connection strength to D1-expressing cells, could account for the majority of changes in firing rates observed in parkinsonism. Reduced lateral inhibition in the GPe, a lower GPe firing threshold, and reduced intracortical inhibition helped account for the reported lack of change in cortical rate (Goldberg et al.,, 2002). Lower STN and GPe thresholds combined with decreased intrapallidal inhibition explained the relatively large increase in STN rate and relatively small decrease in GPe rate observed experimentally (Bergman et al.,, 1994; Boraud et al.,, 1998; Filion and Tremblay,, 1991; Goldberg et al.,, 2002; Heimer et al.,, 2002; Hutchison et al.,, 1994; Kreiss et al.,, 1997; Pan and Walters,, 1988; Walters et al.,, 2007). Increases in GPe rate due to changes in GPe and STN firing thresholds and intrapallidal inhibition were limited by stronger striatal inhibition of the GPe, which is expected with dopamine loss (Floran et al.,, 1997; Querejeta et al.,, 2001).
The purpose of this paper is to analyze the dynamics of the model presented in Paper I in the healthy and parkinsonian states, and to compare modeling results with experimental findings on electrophysiological changes caused by dopaminergic denervation. Dynamical changes with dopamine loss include altered responses to transient stimuli, a lower frequency of the alpha peak and increased relative low-frequency power in the electroencephalogram (EEG), and synchronized oscillations around 5 and 20 Hz throughout the BGTCS. The present work is devoted to modeling these electrophysiological changes, which are described in detail in Sec. 2.2. Using parameters that accord well with known physiology, we obtain not only realistic firing rates (see Paper I), but also realistic EEG spectra and responses to transient stimuli, oscillations in the theta and beta ranges, and enhanced synchronization in the basal ganglia. In Sec. 2 we review the relevant functional anatomy and electrophysiological changes found experimentally, and place our model in context by describing possible origins of parkinsonian oscillations. Section 3 details the model equations and parameter changes in PD, followed by an analysis of changes in neuronal responsiveness in Sec. 4. Oscillations and frequency spectra predicted by the model are discussed in Sec. 5.
2 Physiological background
In Sec. 2.1 we summarize the functional connections of the BGTCS included in the model, which were described more fully in Paper I. Section 2.2 provides an overview of the electrophysiological changes caused by nigrostriatal degeneration. Possible neuronal substrates of parkinsonian oscillations are discussed in Sec. 2.3.
2.1 Functional connectivity
The main functional connections of the BGTCS are depicted in Fig. 1. Excitatory input from the cortex reaches the basal ganglia mainly at the striatum, of which 90–95% of cells are medium spiny projection neurons (Kemp and Powell,, 1971). Medium spiny neurons are classified according to their predominant type of dopamine receptor (D1 or D2). Although a proportion of striatal neurons has both D1 and D2 receptors, a partial segregation appears to exist between these populations (Hersch et al.,, 1995; Inase et al.,, 1997; Le Moine and Bloch,, 1995; Lester et al.,, 1993; Meador-Woodruff et al.,, 1991). A number of studies have suggested that dopaminergic input from the SNc affects D1 and D2-expressing cells differently, primarily increasing the effect of cortical input on D1 cells, and primarily decreasing the sensitivity of D2 cells to cortical input (Gerfen et al.,, 1990; Mallet et al.,, 2006). Projections from the SNc thus effectively modulate the synaptic strengths of corticothalamic inputs, but are not considered as a dynamic part of the model.
Both D1 and D2 striatal neurons exert an inhibitory influence on their projection sites: D1 neurons on the GPi and the substantia nigra pars reticulata (SNr), and D2 neurons on the GPe. SNr and GPi are the main output nuclei of the basal ganglia, sending inhibitory projections primarily to the ventral anterior (VA) and ventrolateral (VL) thalamic nuclei (Parent,, 1990; Parent and Hazrati, 1995a, ), but also to the centromedian-parafascicular complex (CM-Pf) (Kim et al.,, 1976; Parent et al.,, 2001). The pathway cortex-D1-GPi/SNr-thalamus, where the loop is completed via excitatory (glutamatergic) projections to the cortex, is termed the direct pathway (Albin et al.,, 1989; Alexander and Crutcher,, 1990). Since D1 inhibits the output nuclei, which in turn inhibit the thalamus, the direct pathway as a whole is excitatory.
The GPe sends an important inhibitory projection to the STN, which in turn excites the output nuclei. Therefore, the pathway cortex-D2-GPe-STN-GPi/SNr-thalamus as a whole is inhibitory, so that cortical activation results in inactivation of the thalamus. This pathway is referred to as the indirect pathway (Albin et al.,, 1989; Alexander and Crutcher,, 1990). Projections from GPe to STN are reciprocated by excitatory STN-GPe projections. There also exists an important hyperdirect pathway from the cerebral cortex to the STN, particularly from the frontal lobe (Afsharpour,, 1985; Hartmann-von Monakow et al.,, 1978; Nambu et al.,, 2000; Parent and Hazrati, 1995b, ). The direct, indirect, and hyperdirect pathways are illustrated in Fig. 1(a).
Significant thalamostriatal projections arise from the relay nuclei CM-Pf, VA, and VL (Carpenter,, 1981; Gonzalo et al.,, 2002; Parent,, 1990; Sadikot et al.,, 1990, 1992). Empirical results indicate that the associated neurotransmitter is glutamate (Haber and Gdowski,, 2004; Sadikot et al.,, 1992). The GPe contains a dense network of local axon collaterals (Kita,, 1994; Nambu and Llinás,, 1997; Ogura and Kita,, 2000), and sends a projection to the GPi (Hazrati et al.,, 1990; Sato et al.,, 2000; Shink and Smith,, 1995; Smith et al.,, 1994). GABAergic striatal interneurons receiving input from the cortex powerfully inhibit medium spiny neurons, which also provide local axon collaterals (Bolam et al.,, 2000; Koós and Tepper,, 1999; Somogyi et al.,, 1981; Wilson,, 2007). Although striatal axon collaterals appear to exert excitatory effects at hyperpolarized membrane potentials, their influence becomes inhibitory near spike threshold (Plenz,, 2003; Taverna et al.,, 2004). Since the strength of local interactions increases with the firing rate, and in view of the strong inhibitory action of striatal interneurons, we model intrastriatal connections as inhibitory.
Reciprocal connections exist between the relay nuclei and the thalamic reticular nucleus (TRN), both of which receive excitatory (glutamatergic) input from the cerebral cortex. The relay nuclei project back to the cortex, and the cortex contains populations of short-range inhibitory interneurons and long-range excitatory (pyramidal) cells. Sensory input reaches the thalamic relay nuclei from the brainstem via glutamatergic and cholinergic afferents. In contrast, the basal ganglia do not receive significant projections from ascending sensory pathways (Elble,, 2002).
Anatomical and physiological studies have shown that connections in the BGTCS form three mostly separate circuits (sensorimotor, association, and limbic), which are further organized into somatotopic regions (Alexander et al.,, 1986; Alexander and Crutcher,, 1990). Since the sensorimotor circuit is most relevant to parkinsonian motor symptoms, in the present work we ignore projections to and from the amygdala, dorsal raphe nucleus, hippocampus, and pedunculopontine nucleus (PPN) of the brainstem, which mostly affect limbic territories. We do not treat the remaining territories separately for two reasons. First, since many empirical studies do not distinguish between sensorimotor, association, and limbic pathways, or between pathways corresponding to different somatotopic regions, sufficient physiological data are not available for each circuit separately. Second, the similarity of the connectivity patterns of all circuits suggests that oscillations may be generated by a common mechanism.
2.2 Overview of experimental findings
The wide-ranging effects of nigrostriatal dopamine depletion on the dynamics of the BGTCS include alterations of responses to transient stimuli or during volitional tasks. Regional cerebral bloodflow appears to be diminished in the supplementary motor area (SMA) and the dorsolateral prefronal cortex, whereas other cortical areas display increased activation during motor tasks (Jenkins et al.,, 1992; Playford et al.,, 1992; Sabatini et al.,, 2000). On the other hand, cortical activation has been shown to be suppressed specifically during tasks with significant involvement of the caudate nucleus, but increased otherwise (Monchi et al.,, 2007). The increased activation of cortical regions in the absence of striatal involvement may reflect compensation for deficits caused by nigrostriatal dopamine loss (Samuel et al.,, 1997), or degeneration of direct mesocortical dopaminergic afferents (Mattay et al.,, 2002). The responsiveness of striatal neurons is expected to change depending on the type of dopamine receptor they primarily express (D1 or D2). Dopamine potentiates the activation of D1-expressing neurons by glutamate unless they are in a hyperpolarized state (Cepeda et al.,, 1998; Hernández-López et al.,, 1997; Kiyatkin and Rebec,, 1996; Nicola et al.,, 2000). In contrast, the responsiveness to glutamate is suppressed via D2 receptor activation (Hsu et al.,, 1995; Levine et al.,, 1996; Toan and Schultz,, 1985; Umemiya and Raymond,, 1997). GPi neurons display more widespread and vigorous responses to passive limb movements in parkinsonian monkeys (Bergman et al.,, 1994; Filion et al.,, 1988), especially to extension torque (Wichmann et al., 1994b, ). Zold et al., 2007b reported an increase in the number of excitatory responses in the globus pallidus (GP; the rodent homolog of GPe) of rats with moderate nigrostriatal damage, but inhibitory responses increased after more extensive damage. A reduction in pallidal activity upon cortical stimulation was also observed in a rat model of PD (Magill et al.,, 2001). The STN responds more vigorously to cortical stimulation in parkinsonian rats (Magill et al.,, 2001). Furthermore, the duration and magnitude of both excitatory and inhibitory responses in the STN of African green monkeys increased after SNc lesion with the neurotoxin 1-methyl-4-phenyl-1,2,3,6-tetrahydropyridine (MPTP), most cells increasing their firing rate (Bergman et al.,, 1994).
EEG and magnetoencephalographic (MEG) spectra show that relative power in the delta and theta bands (i.e., the proportions of the total power in these frequency bands) is increased in PD patients compared to age-matched controls (Bosboom et al.,, 2006; Neufeld et al.,, 1994; Stoffers et al.,, 2007). In non-demented patients, increased delta and theta power is associated with more severe motor and cognitive symptoms (Bosboom et al.,, 2006; Neufeld et al.,, 1994), and may be specific to patients with REM sleep behavior disorder (Gagnon et al.,, 2004). PD is also accompanied by lower alpha peak frequencies, especially in patients with dementia (Sinanović et al.,, 2005; Soikkeli et al.,, 1991); e.g., Soikkeli et al., (1991) reported mean alpha peak frequencies of 9.6 Hz in controls, 8.3 Hz in non-demented PD patients, and 6.8 Hz in demented patients. Some studies also reported that absolute EEG power is increased across the spectrum in PD patients by an amount independent of medication state (Moazami-Goudarzi et al.,, 2008; Tanaka et al.,, 2000), although Yaar and Shapiro, (1983) found that levodopa increased spectral power in the left occipital lobe over all frequency bands. Increased corticothalamic coherence at 7 Hz (Sarnthein and Jeanmonod,, 2007) is in line with greater EEG power and a lower frequency of the alpha peak. Overall, EEG power appears to decline with advancing dementia, but according to Tanaka et al., (2000) demented patients still had higher delta (1.5–6 Hz), theta (6.5–8 Hz), and beta (13.5–30 Hz) power than controls. On the other hand, Soikkeli et al., (1991) reported higher delta and theta power, but lower beta power in demented patients than in control subjects. EEG frequency reduction in PD may be partly caused by changes in non-dopaminergic neurotransmitter systems (Stoffers et al.,, 2007). Especially the cholinergic and noradrenergic systems are implicated, since demented PD patients have reduced cortical cholinergic activity due to degeneration of the nucleus basalis of Meynert (Candy et al.,, 1983; Dubois et al.,, 1983), as well as more significant noradrenergic deficits than non-demented patients (Cash et al.,, 1987). Moreover, loss of cholinergic afferentation from the basal forebrain has been related to EEG frequency reduction with age (Buzsáki et al.,, 1988; Longo,, 1966; Metherate et al.,, 1992). We propose a mechanism by which nigrostriatal denervation itself also contributes to EEG frequency reduction in PD.
PD is also associated with enhanced oscillations at 3–7 Hz and 7–30 Hz in the BGTCS, which have been observed in humans and in animal models of PD in the GPi and GPe (Filion and Tremblay,, 1991; Levy et al.,, 2002; Nini et al.,, 1995; Raz et al.,, 2000), STN (Bergman et al.,, 1994; Levy et al.,, 2000; Wang et al.,, 2005), SNr (Wichmann et al.,, 1999), pallidal and cerebellar-receiving areas of the thalamus (Lamarre and Joffroy,, 1979; Lenz et al.,, 1994; Magnin et al.,, 2000; Ohye et al.,, 1974, 1989), striatal medium spiny neurons (Dejean et al.,, 2008) and tonically active interneurons (Raz et al.,, 2001), and sensory and motor cortices (Alberts et al.,, 1969; Cordeau et al.,, 1960; Lamarre and Joffroy,, 1979; Timmermann et al.,, 2003; Volkmann et al.,, 1996). In the GPi of PD patients, 5 Hz oscillations were found to be more common than 15–20 Hz oscillations (Levy et al.,, 2001). A percentage of GPe and GPi neurons in monkeys treated with MPTP displayed 5–8 Hz oscillations for short periods during tremor, and approximately 15 Hz oscillations in both pallidal segments in the absence of tremor, which sometimes persisted over longer intervals in the GPi (Filion and Tremblay,, 1991). Microelectrode recordings revealed stable 11–30 Hz synchronization and more transient 5 Hz coherence between pairs of neurons in the STN of PD patients, particularly those with tremor (Levy et al.,, 2000). The large power of beta oscillations in the STN (Kühn et al.,, 2005), and the differential modulation of low- and high-frequency activity by dopaminergic medication and during periods of intermittent tremor (Silberstein et al.,, 2003; Wang et al.,, 2005), suggest that 20 Hz oscillations are not generated as a harmonic of the 5 Hz rhythm.
2.3 Possible origins of oscillations
Despite the similar frequencies of slow oscillations in the BGTCS and resting tremor, it is unclear whether a direct causal relationship exists between the two, since rhythmically discharging cells have been found in the basal ganglia even without obvious tremor (Bergman et al.,, 1994; Levy et al.,, 2001; Ohye et al.,, 1974; Wichmann et al., 1994a, ; Williams et al.,, 2002), as has a lack of coherence even during tremor (Bergman et al.,, 1994). Furthermore, synchronized beta oscillations are also more prominent in patients with intermittent tremor than in non-tremulous patients, indicating an association between higher-frequency rhythms and tremor (Levy et al.,, 2000) (although we will see that relatively strong beta resonances can occur in a system that is likely to support theta oscillations, which may well be more directly related to tremor). The fact that even random electrical (Alberts,, 1972) or 10–30 Hz magnetic stimulation (Topka et al.,, 1999) of the motor cortex can induce 4–7 Hz tremor also shows that basal ganglia oscillations need not directly determine tremor frequency. Finally, the basal ganglia do not appear to initiate movements under normal conditions (Horak and Anderson,, 1984; Mink,, 1996; Rivlin-Etzion et al.,, 2006).
Involvement of the cerebellum in the generation of parkinsonian tremor has been suggested since tremor-like oscillations in the cerebellar-receiving ventralis intermedius (Vim) nucleus of the thalamus are stronger and show greater coherence with the EMG than oscillations in basal ganglia targets (Lenz et al.,, 1988), and Vim has long been a preferred surgical target for PD (Okun and Vitek,, 2004). However, all forms of tremor are accompanied by abnormal cerebellar activation, likely due to proprioceptive feedback from the limbs (Deuschl et al.,, 2001). More telling is the study by Deuschl et al., (1999) on a patient who developed PD 17 years after a stable lesion of the right cerebellar hemisphere. This patient exhibited a bilateral tremor with a frequency of 3.1 Hz on the side of the cerebellar lesion, and 4.3 Hz on the intact side, demonstrating that an intact olivocerebellar circuit is not necessary to produce tremor. The tremor on the lesioned side was a combination of resting, postural, and intention tremors, and was interpreted as rubral or Holmes tremor. The fact that levodopa is effective against Holmes tremor indicates that it is due to a combination of cerebellar and nigrostriatal damage, which is confirmed by PET imaging (Remy et al.,, 1995; Vélez et al.,, 2002). The cerebellum may prevent nigrostriatal degeneration from causing tremor during voluntary movement, and may modulate the frequency of resting tremor (Deuschl et al.,, 1999). The small degree of entrainment and phase resetting of parkinsonian tremor that can be achieved with imposed periodic movements (Rack and Ross,, 1986) and mechanical stimulation (Lee and Stein,, 1981), respectively, also indicates the limited influence of peripheral factors. Even if the frequency or presence of tremor is not directly determined by oscillations in the BGTCS, an important role for the basal ganglia in the production of tremor is therefore evident. Furthermore, a basal ganglia contribution to akinesia, bradykinesia, and rigidity is implied by the fact that pallidal or STN lesions or high-frequency stimulation can ameliorate these symptoms (Gross et al.,, 1997; Iacono et al.,, 1995; Limousin et al.,, 1998; Meissner et al.,, 2005).
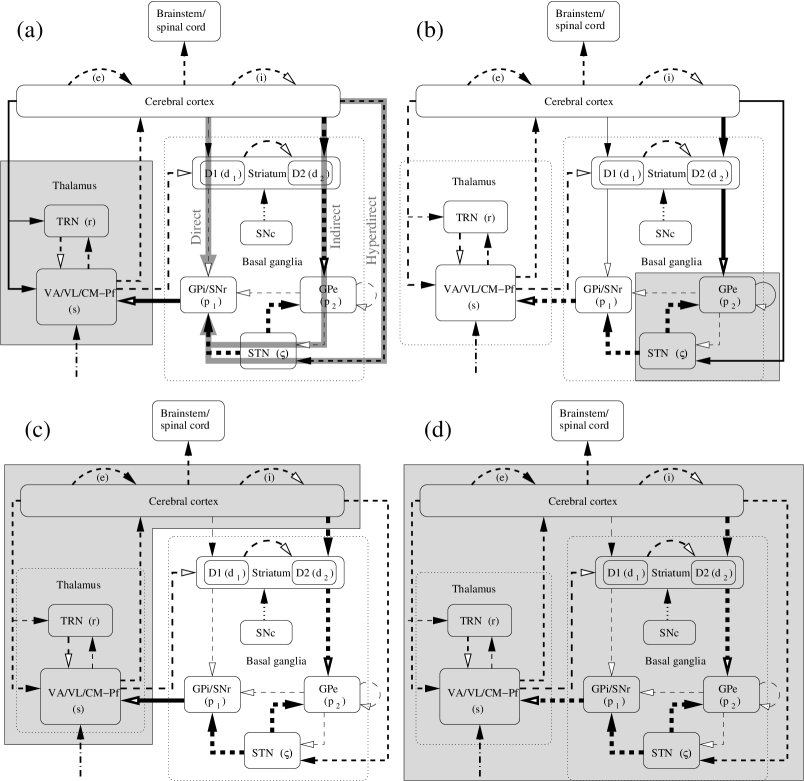
Due to the widespread nature of the oscillatory activity in PD, various parts of the BGTCS are implicated as possible sources (Deuschl et al.,, 2000; Elble,, 1996). Several hypotheses have been put forward concerning the origin of parkinsonian oscillations, which can be grouped into the following four—not necessarily mutually exclusive—categories for our purposes.
Hypothesis of thalamic origin
The first scenario, illustrated in Fig. 1(a), places the origin in the thalamus (Hurtado et al.,, 1999; Llinás,, 1984; Paré et al.,, 1990; Sarnthein and Jeanmonod,, 2007). The thalamus is implicated since striatal dopamine depletion leads to disinhibition of GPi and SNr, increasing inhibition of the VA and VL thalamic nuclei (Hutchison et al.,, 1994; Magnin et al.,, 2000; Pan and Walters,, 1988). Hyperpolarization of thalamic relay neurons has been shown to cause low-threshold calcium spike bursts (Deschênes et al.,, 1982; Jeanmonod et al.,, 1996; Llinás and Jahnsen,, 1982; Llinás and Steriade,, 2006), some of which occur rhythmically at an interburst frequency of 4 Hz in patients with symptoms related to thalamic hypoactivation, including parkinsonian tremor (Jeanmonod et al.,, 1996; Ohye et al.,, 1974). Such rebound bursts in response to tonic overinhibition by the GPi and SNr may be synchronized by lateral inhibition within the TRN, and their rhythmicity may be partly determined by network interactions between the TRN and the relay nuclei (Buzsáki,, 1991). The thalamic oscillations would mediate their effect on cortical and muscular activity through projections to the prefrontal and premotor cortices (Sarnthein and Jeanmonod,, 2007). Rhythmic oscillations may be relayed to the basal ganglia either via the striatum or via the corticosubthalamic projection, and enhanced within the loop formed by STN and GPe (Baufreton et al.,, 2005), which appear to become more sensitive to rhythmic inputs following loss of striatal and extrastriatal dopamine (Bevan et al.,, 2006). Finally, GPe and STN could output rhythmic oscillations via projections to GPi and SNr.
Until the recent finding of 5–13 Hz oscillations in medium spiny neurons of unanesthetized rats with nigrostriatal lesions (Dejean et al.,, 2008), evidence for the involvement of the corticostriatal and striatopallidal projections was mostly indirect. The delay in obtaining this experimental evidence is explained by the low firing rate of medium spiny neurons, which prevents autocorrelation functions from showing prominent oscillations. Dejean et al., (2008) overcame this problem by using peri-event histograms, and focused on high-voltage spindles to track rhythmic activity in the unanesthetized condition. An earlier argument put forward for the involvement of striatal projections (Murer et al.,, 2002) is the relatively long phase delay (20–30 ms) between rhythmic cortical activity at and activity in the STN and GPi of PD patients off medication (Marsden et al.,, 2001; Williams et al.,, 2002), which is longer than the corticosubthalamic delay of 10 ms estimated in a few studies (Ashby et al.,, 2001; Nambu et al.,, 2000). Further indirect evidence for striatal transmission of tremor-like rhythms is that the membrane potentials of striatal medium spiny neurons reliably follow 5 Hz cortical rhythms induced by light anesthesia in animals (Mahon et al.,, 2001; Wilson,, 1993). In addition, Tseng et al., (2001) demonstrated that slow (1 Hz) rhythmic cortical inputs induce oscillations at the same frequency in striatal neurons of anesthetized rats with nigrostriatal lesions. Oscillatory activity at 15 Hz is also observed in the tonically active cholinergic interneurons of the rat striatum (Raz et al.,, 1996, 2001), although the relationship between these oscillations and the activity of medium spiny neurons is unclear. The cholinergic interneurons may oscillate in response to nigrostriatal afferents, input from the GPe (Sato et al.,, 2000), or input from CM-Pf (Lapper and Bolam,, 1992).
On the other hand, involvement of the corticosubthalamic pathway is implied by the fact that the discharge rate and pattern of GP neurons is not significantly affected by cortical ablation in anesthetized rats, whereas in the STN, this abolishes slow oscillations coherent with the EEG (Magill et al.,, 2001). The regularization of GP (Ni et al.,, 2000), SNr (Burbaud et al.,, 1995; Tseng et al.,, 2000) and GPi (Wichmann et al., 1994b, ) activity upon STN lesion has also been put forward as evidence for the contribution of the corticosubthalamic projection, but these findings do not exclude the possibilities that oscillatory activity arises in the STN-GPe network or in cortico-basal ganglia-thalamic loops involving striatopallidal projections.
A possible objection to the hypothesis of a thalamic pacemaker for parkinsonian tremor is the fact that different body parts often tremble at slightly different frequencies, suggesting the absence of the overall synchronizing influence of the TRN (Paré et al.,, 1990). However, we have seen above that cortical and peripheral factors appear to play a role in determining tremor frequency. Lenz et al., (1993) and Zirh et al., (1998) noted a difference between the pattern of interspike intervals in thalamic bursts in parkinsonism and the gradual lengthening of interspike intervals characteristic of calcium spike-associated bursts. This may indicate that rhythmic GPi inputs to slightly depolarized thalamic neurons, rather than increased tonic GPi activity and consequent low-threshold calcium spike bursts, are responsible for the bursting patterns observed in the thalamus.
Hypothesis of origin in STN-GPe loop
A second hypothesis, illustrated in Fig. 1(b), states that changes in tonic input to the STN-GPe system cause these nuclei to produce oscillatory activity, which spreads to the basal ganglia output nuclei, thalamus, and cortex (Deuschl et al.,, 2000; Terman et al.,, 2002). It has been shown that STN neurons can switch from a single-spike mode to a burst-firing mode upon hyperpolarization by the GPe (Beurrier et al.,, 1999; Bevan et al.,, 2000). Although the GPe generally becomes less active in parkinsonism, excitation by the STN may induce periods of enhanced GPe firing, periodically hyperpolarizing STN neurons and causing rebound bursts. This mechanism was suggested by Plenz and Kital, (1999), who showed that the rat STN-GP network undergoes spontaneous 0.4–1.8 Hz oscillations in the absence of dopamine. Terman et al., (2002) modeled networks of STN and GPe neurons and showed that increased synaptic input from the striatum to the GPe and/or weakened intrapallidal inhibition can lead to slow ( Hz) synchronized oscillations in these nuclei or clustered rhythms at 4–6 Hz, depending on the network architecture and the STN-GPe connection strength. The reduction in lateral inhibition within the GPe would be caused by the enhanced release of enkephalin (Stanford and Cooper,, 1999; Steiner and Gerfen,, 1998), preventing desynchronization of GPe neurons by intranuclear interactions. Oscillations in the STN-GP circuit have also been replicated in computational models by Gillies et al., (2002); Humphries and Gurney, (2001); Humphries et al., (2006).
A requirement of this hypothesis is that the STN-GPe network be able to generate rhythmic activity in the absence of rhythmically modulated input. Both an experimental study (Magill et al.,, 2001), and a modeling study (Humphries et al.,, 2006) of rat basal ganglia have shown that small subpopulations of GP and STN neurons can sustain rhythmic oscillations around 1 Hz. However, Magill et al., (2001) reported that most correlated bursting in GPe and SNr was abolished by cortical desynchronization or ablation. A few other studies have also suggested that the isolated STN-GPe network does not generate significant rhythmic bursting activity.
First, a study in rats showed that GABA antagonists, mimicking reduced pallidal input to STN, can make bursting patterns more marked, but cannot change an irregular spiking mode into a bursting mode (Urbain et al.,, 2002). Furthermore, Wilson et al., (2006) showed that rhythmic oscillations were absent in a slice preparation of the isolated pallidosubthalamic network from dopamine-depleted mice. Wilson et al., (2006) pointed out that inputs from striatum and/or cortex may be needed to induce synchronized oscillations in these nuclei in the slice preparation, although these inputs were not necessary in the rat cell culture (Plenz and Kital,, 1999). However, the slice preparation of Wilson et al., (2006) may not have left sufficient GP projections intact to significantly inhibit the STN and evoke rebound firing in that nucleus.
Hypothesis of origin in corticothalamic loops
A third possibility, depicted in Fig. 1(c), is that rhythmic activity arises from reverberations within the corticothalamic network. If we assume that the frequency of resting tremor is directly determined by central oscillations, the lack of coherence between GPi cells firing near tremor frequencies and the tremor EMG (Lemstra et al.,, 1999) appears to be evidence for a thalamic or corticothalamic source of tremor oscillations. Magnin et al., (2000) reported a larger proportion of tremor-locked cells in the GPi than in the thalamus, which provides evidence both for and against this hypothesis. On the one hand, it suggests that oscillations arise upstream from the thalamus; on the other hand, rhythmic oscillations may not be relayed directly from GPi to thalamus. Although Magnin et al., (2000) found no synchronization between individual pallidal-receiving thalamic cells and tremor, it is possible that the average activity of a larger subpopulation was modulated rhythmically in a coherent manner, since even weak correlations between individual cells can lead to strong coherence at the population level (Schneidman et al.,, 2006).
Hypothesis of origin in basal ganglia-thalamocortical loops
Finally, resonances may originate in the BGTCS as a whole, rather than being confined to any particular region (Deuschl et al.,, 2000; Wichmann and DeLong,, 2003) [Fig. 1(d)]. This hypothesis implies that the rhythmicity would be determined by the delay for signals to complete a full loop from cortex through the basal ganglia, thalamus, and back to the cortex. Such a mechanism was proposed by Leblois et al., (2006), who described a neuronal network model of interacting direct and hyperdirect pathways, of which the latter sustained oscillations at 11 Hz when regulation by the direct pathway was suppressed. The objection that GPi and thalamic activity appear to be non-coherent during tremor (Lemstra et al.,, 1999; Magnin et al.,, 2000) can be raised against this hypothesis as well as against the hypothesis that oscillations arise in the STN-GPe network. However, as discussed above, lack of coherence of individual cells with the EMG or with other rhythmic cells does not appear to rule out the involvement of these cells in the generation of parkinsonian oscillations.
Our paper investigates which of the above hypotheses is supported by the known functional anatomy of the BGTCS if the dynamics is governed by mean-field activity.
3 Dynamical equations
The form of the model developed in Paper I and used here is based on Rennie et al., (1999) and Robinson et al., (1997); Robinson et al., 1998a ; Robinson et al., 1998b ; Robinson et al., (2002, 2005), work that partly built on models developed by Freeman, (1975), Jirsa and Haken, (1996), Nunez, (1974, 1995), Wright and Liley, (1996), and others. The model incorporates synaptic and dendritic integration effects, nonlinear response functions, axonal conduction delays, and spreading of wave-like activity along the cortical surface. The basic model equations were largely given in Paper I, but are summarized in Sec. 3.1 for convenience. Section 3.2 contains the equations that govern small perturbations about fixed point. In Sec. 3.3 we describe the parameter changes used to model parkinsonism.
3.1 Basic equations
The neuronal populations of the model will be indicated by the following subscripts: , cortical excitatory; , cortical inhibitory; , striatal D1 cells; , striatal D2 cells; , GPi/SNr; , GPe; , STN; , thalamic relay nuclei; and , TRN. We refer to brainstem input using a subscript . The subscript indicates both specific relay nuclei and the diffusely projecting CM-Pf complex. The dependence of the mean firing rate of each population of neurons on the cell-body potential relative to resting is modeled by a sigmoidal function taking the form (Robinson et al.,, 2002)
| (1) |
In previous works the cortex was modeled as two-dimensional since it has a large surface area but is comparatively thin, whereas other components were treated as uniform. In the present work we indicate the spatial coordinate for completeness, although we will only consider spatially uniform solutions. The functional dependence (1) results from averaging the response functions of neurons with slightly different firing thresholds. The quantity is the maximum firing rate, is the mean threshold potential, and is the standard deviation of firing thresholds. The latter is taken to be equal for all components, since we lack precise knowledge of the ranges of firing thresholds in different populations.
Changes in the cell-body potential of type neurons are triggered by pulses that arrive from type neurons after an axonal delay , are filtered by the dendritic tree, and summed at the cell body. The effect of an incoming pulse rate on the cell-body potential depends on the connection strengths between the neural populations. These are made up of the mean number of synapses, , and the typical time-integrated change in cell-body potential per incoming pulse, . Connection strengths are thus given by the products . The change in the average cell-body potential of type neurons due to the summation and temporal integration of incoming signals becomes (Robinson et al.,, 2004)
| (2) | |||
| (3) |
The differential operator approximates filtering of signals by the synapses and the dendritic tree (Rennie et al.,, 2000; Robinson et al.,, 1997). We assume without loss of generality, which in practice means that is the decay rate and the rise rate of the cell-body potential. The synapses and dendrites reduce the power of signals for angular frequency and especially for . In more complicated models, and may be taken to depend on both the sending and receiving populations, and the relevant neurotransmitter (Rennie et al.,, 2000).
The cortical signal depends not only on resonances with underlying structures, but also on corticocortical interactions. Many experiments have revealed propagating waves of neuronal activity upon local cortical stimulation (Chervin et al.,, 1988; Nunez,, 1974; Schiff et al.,, 2007; Xu et al.,, 2007), a feature previously included in a number of modeling studies (Bressloff,, 2001; Bressloff et al.,, 2003; Jirsa and Haken,, 1996, 1997; Nunez,, 1995). Although Nunez, (1995) focused on standing waves obtained when cortical waves are weakly damped, physiological and modeling evidence indicates that considerable damping occurs, and should be taken into account (Robinson et al., 2001a, ; Robinson et al.,, 2004; Wright and Liley,, 1995). We thus model propagation effects along the cortical surface due to long-range excitatory connections via a damped-wave equation with source term (Robinson et al.,, 1997; Robinson et al., 2001a, ),
| (4) |
The form (4) results when the range distribution of corticocortical axons is approximated as isotropic, and exponentially decaying at large distances compared to characteristic range (Robinson et al.,, 1997). The firing rate field is damped at a rate , where 5–10 m s-1 is the average propagation rate along pyramidal axons. For the remaining neuronal populations we assume propagation effects to be negligible, since their local interactions are relatively short-range. This leads to a small and large , and the simplified equation .
3.2 Linearized equations
Fixed-point firing rate fields for a constant, uniform input are found by setting all time and spatial derivatives in Eqs. (2)–(4) to zero (Rennie et al.,, 1999; Robinson et al.,, 2005). In the absence of perturbations the system will approach a stable fixed-point solution. Taylor expansion to first order around the fixed-point outgoing firing rates yields
| (5) | |||
| (6) |
where is the equilibrium potential, and is the slope of the sigmoid at the fixed point, given by
| (7) | |||||
| (8) |
The above quantities lead to a set of gains
| (9) |
giving the change in firing rate per unit change in afferent firing rate . For products of gains representing loops or sequences of connections we will use the short-hand notation
| (10) |
and similarly for products of more than two gains. This leads to the notations listed in Table 1.
| Number | Loop | Gain |
|---|---|---|
| 1 | Direct loop | |
| 2 | Indirect loop | |
| 3 | Alternative indirect loop with GPe-GPi/SNr projection | |
| 4 | Hyperdirect loop | |
| 5 | GPe-STN loop | |
| 6 | Direct thalamocortical loop | |
| 7 | Indirect thalamocortical loop through TRN | |
| 8 | Intrathalamic loop | |
| 9 | Basal ganglia-thalamic loop through D1 cells | |
| 10 | Basal ganglia-thalamic loop through D2 cells | |
| 11 | Basal ganglia-thalamic loop through D2 with GPe-GPi/SNr projection |
The linearized equation (6) is solved more easily by passing to Fourier space, transforming from spatial and temporal coordinates and to and . If we denote deviations from the fixed-point firing rates by , substitution of the form of obtained by Fourier transforming (2) yields
| (11) | |||||
| (12) |
Also, Fourier transformation of (4) yields
| (15) |
Expanding Eqs. (12) and (15) for each of the components and leads to a set of coupled linear equations that can be written in matrix form,
| (52) | |||||
| (53) | |||||
| (54) | |||||
| (55) |
Note that the differential operator associated with synaptodendritic transmission is transformed to in the Fourier domain, and differs from the operator associated with cortical wave propagation. Equation (52) allows us to derive a transfer function for input to the thalamus to the cortical excitatory firing rate ,
| (56) | ||||
| (57) | ||||
| (58) | ||||
| (59) | ||||
| (60) |
The transfer function is analogous to those customarily derived in control theory for linear systems (Dorf and Bishop,, 2001). Each of the consists of a product of dendritic and synaptic filter functions , gains , and phase factor , representing one of the loops of the model: and are the two possible corticothalamic loops, the first from cortex to relay nuclei and back to cortex, and the second passing through the TRN, while represents the classic direct pathway. Activity traveling along the indirect route, , the alternative indirect route, , and the hyperdirect route, , is modulated by the loop between STN and GPe, . This is expressed in the above equations by division of the relevant circuit strengths by , which itself contains a factor to account for intrapallidal connections. The strengths of all pathways passing through the thalamus are modulated by the intrathalamic loop via . Pathways through the striatum have a correction factor that accounts for intrastriatal inhibition. Finally, all major pathways are modulated by the loops involving thalamostriatal projections, for which the correction factor is denoted . The transfer function is considerably simplified if the thalamostriatal projection is removed, so that .
The electroencephalographic (EEG) signal is caused by extracellular currents near the dendrites of cortical neurons firing in partial synchrony (Nunez,, 1995; Ray,, 1990). As in previous works [e.g., Robinson et al., 2001b ; Robinson, (2003)], we take the cortical potential to be proportional to the excitatory firing rate field , since pyramidal neurons are the most aligned, most numerous, and largest cells contributing to the cortical signal. Hence, we approximate EEG spectral power as being proportional to . Parameter values in the normal state are given in Paper I, where their derivation and consistency with physiology are discussed extensively. As in that paper, we impose the random connectivity approximation (Braitenberg and Schüz,, 1998; Robinson et al., 2001b, ; Wright and Liley,, 1995), which leads to for .
3.3 Parameter changes in PD
In Paper I we considered five types of parameter changes for modeling the dopamine depletion that occurs in PD. These parameter changes are:
(I) decreasing both corticostriatal connection strengths and striatal firing thresholds to approximate a reduction in signal-to-noise ratio (SNR) in the striatum (Leblois et al.,, 2006; Nicola et al.,, 2004; O’Donnell,, 2003), as modeled by
| (61) | |||
| (62) |
where mV s, and s-1;
(II) increasing corticostriatal transmission to D2-expressing cells and decreasing transmission to D1-expressing cells, in line with the direct/indirect loop hypothesis (Albin et al.,, 1989; Alexander and Crutcher,, 1990; Mallet et al.,, 2006);
(III) weakened lateral inhibition in the GPe due to enhanced release of enkephalin (Stanford and Cooper,, 1999; Terman et al.,, 2002);
(IV) weaker intracortical excitation and especially inhibition to approximate the effects of mesocortical dopamine loss (Gulledge and Jaffe,, 2001; Gao and Goldman-Rakic,, 2003; Thurley et al.,, 2008; Zhou and Hablitz,, 1999);
(V) a combination of stronger cortico-D2 and weaker cortico-D1 transmission, weaker GPe-GPe inhibition, smaller cortical connection strengths, reduced GPe and STN firing thresholds, and a stronger D2-GPe projection. In particular, we considered the state that is obtained from the normal parameters in Paper I by setting mV s, mV s, mV s, mV s, mV s, mV s, mV, and mV. We will refer to this combination of parameters as the ‘full parkinsonian state’.
In this paper we consider the dynamical implications of dopamine depletion via the parameter changes (I)–(V), including responses to transient and ongoing stimuli, oscillations, and frequency spectra.
4 Gains and responses to transient and ongoing stimuli
The linear gains (9) quantify the effective interactions between populations. In Sec 4.1 we consider changes in gains with nigrostriatal denervation, and propose a mechanism by which nigrostriatal and mesocortical dopamine loss can contribute to bradykinesia. Neuronal responses to transient cortical stimuli are derived in Sec. 4.2 using the full nonlinear version of the model. In Sec. 4.3 neuronal responses for ongoing brainstem inputs to the thalamus are derived.
4.1 Changes in gains and a possible contribution to bradykinesia
Linear gains depend on the connection strengths not only directly, but also indirectly via the steady-state firing rates. The gains quantify the dynamic effects of changes in connection strengths. In the following, we discuss changes in gains obtained by manipulating the values of to simulate dopamine loss, and recomputing steady states after each manipulation. The derivative of the sigmoid at each steady state is given by Eqs. (7) and (8), which yields gains via Eqs. (9) and (10). In the absence of thalamic inputs, the rate and amplitude of changes in cortical activity depend mainly on the sum , which may be relevant to the symptoms of akinesia and bradykinesia, as further discussed below. Therefore, we report the value of this sum in each scenario, besides intracortical gains and the loop gains specified in Table 1.
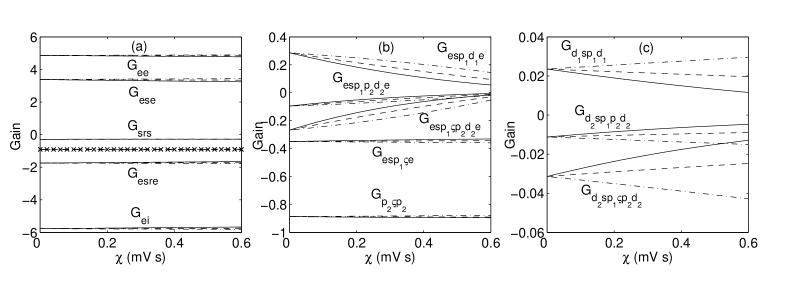
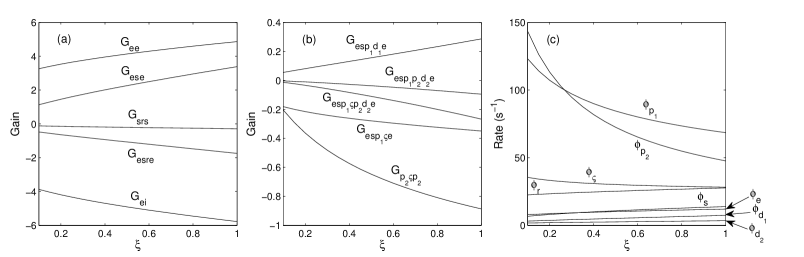
Simultaneous reduction of corticostriatal connection strengths and striatal firing thresholds has relatively little effect on gains, including the sum (cf. Fig. 2). Especially corticothalamic gains are constant [Fig. 2(a)], whereas both the direct and indirect loops become somewhat weaker [Fig. 2(b)], and basal ganglia-thalamic gains may become stronger or weaker depending on [Fig. 2(c); cf. Eq. (61)].
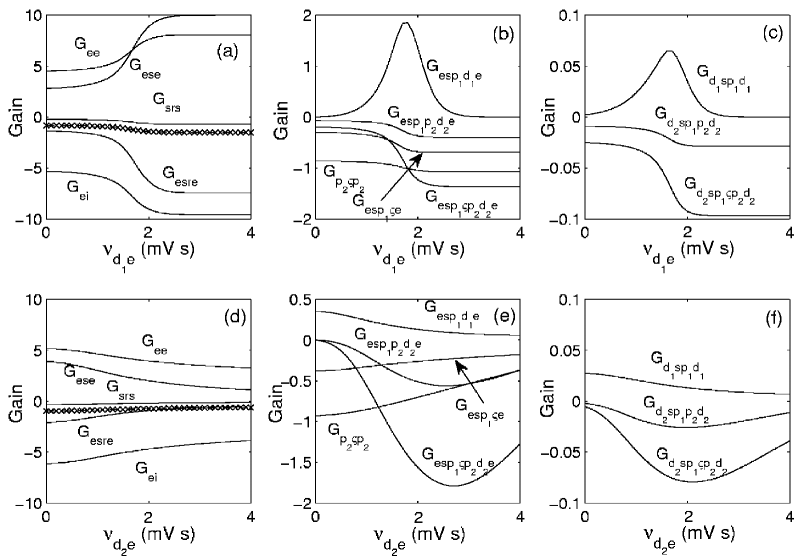
Figures 3(a) and 3(d) show that both increases in and decreases in reduce corticothalamic gains in absolute value. A slight reduction is also seen in . A larger enhances the strength of the indirect pathway while decreasing the strength of the direct pathway [cf. Figs. 3(b) and 3(e)]. On the other hand, decreasing from its normal value of mV s weakens both the direct and indirect pathways. These changes in corticostriatal connection strengths decrease the absolute values of the gains of the STN-GPe loop, , and the hyperdirect loop, .
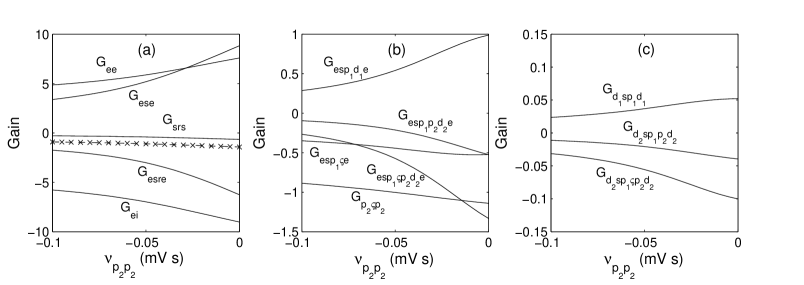
The enhancement of corticothalamic gains seen in Fig. 4(a) supports the view that reduced intrapallidal inhibition acts as a compensatory mechanism. However, Fig. 4(b) reveals that all basal ganglia-thalamocortical circuits are strengthened by this change, including the direct, indirect, and hyperdirect loops, as well as the circuit formed by the STN and GPe. Thus, weakened intra-GPe inhibition may help stabilize basal ganglia firing rates, but exacerbate oscillations (cf. Sec. 5.1).
As discussed in Paper I, a loss of direct dopaminergic inputs to the cortex is expected to reduce , and especially and . Since intracortical inhibition was taken to be stronger than excitation in the healthy state, this results in more similar strengths of excitation and inhibition, and a consequent decrease in .
Reducing the GPe firing threshold increases the absolute values of corticothalamic gains, including , as well as those of the direct, indirect, and hyperdirect loops, whereas lowering the STN firing threshold has the opposite effect. Reducing either or increases the gain of the STN-GPe loop. The indirect pathway is strengthened by greater , which weakens the direct, hyperdirect, and GPe-STN loops. Combining all parameter changes leads to a smaller (0.59 vs. 0.91 in the healthy state), a weaker direct loop ( 0.042 vs. 0.29), and stronger hyperdirect ( vs. ), STN-GPe ( vs. ), and especially indirect ( vs. ) loops in the parkinsonian state compared to the healthy state.
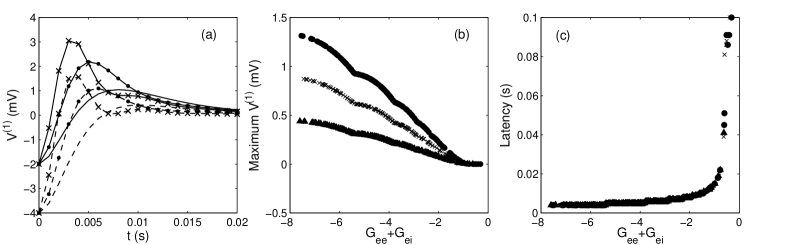
We investigate the results of changes in cortical gains by considering only cortical interactions and ignoring the damped-wave equation (4), which leads to . Substituting in Eqs. (2) and (3), and using the linear approximation yields
| (63) | |||
| (64) |
Here, we have made use of the random connectivity approximation to obtain and . The sizes and latencies of the maximums of and were determined using numerical integration of Eqs. (63) and (64) for three sets of initial conditions, using 200 pairs of values of and uniformly distributed in the intervals and . As illustrated in Fig. 5, response strength and latency do not depend on or individually, but input responses become slower and less pronounced with decreased . The decreased value of due to increased strength of the indirect pathway and/or impaired cortical inhibition after loss of mesocortical dopamine may thus be related to slowness of movement (bradykinesia) or absence of movement (akinesia), since threshold activation levels necessary to initiate movements may be reached more slowly, or not at all. This hypothesis is supported by the observation that MPTP lesion in monkeys causes the activity of motor cortical neurons to build up more slowly and persist longer during voluntary movements (Doudet et al.,, 1990). Similarly, transcranial magnetic stimulation leads to more gradual modification of motor unit activity in PD patients than in controls (Kleine et al.,, 2001).
4.2 Responses to transient stimuli
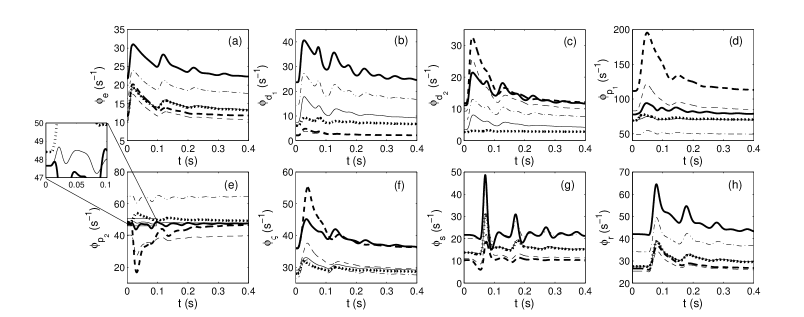
Figure 6 shows the responses in each neural population to a 10 ms square pulse with amplitude 60 s-1 applied at the cortex in the healthy condition with parameters as in Paper I, and with the five possible results of dopamine loss mentioned in Sec. 3.3. To compare these responses to experimental results, we make use of the finding that the average firing rate of motor cortical neurons is increased during movement (Grammont and Riehle,, 2003; Thach,, 1978).
In the healthy condition, the slight increase in the model rate of the output nuclei with cortical stimulation is in agreement with experimental findings that the majority of GPi neurons increase their activity before and during movement (Anderson and Horak,, 1985; Georgopoulos et al.,, 1983; Mitchell et al.,, 1987), presumably because of inhibition of competing motor programs when a target program is activated (Nambu et al.,, 2002). The latencies and directions of GPe responses seen in the insert to Fig. 6(e) closely match those observed upon stimulation of M1, SMA, or S1 in healthy awake monkeys: an early excitation after 8–11 ms, inhibition after 15–19 ms, and a late excitation after 26–32 ms (Kita et al.,, 2004; Nambu et al.,, 2000; Yoshida et al.,, 1993). With the parameters in Paper I, onset of GPe excitation by the STN occurs 8 ms after cortical stimulation, inhibition by striatum after 19 ms, and the second excitation by STN after 28 ms. The relative sizes of the peaks and trough depend on the stimulation intensity, longer or faster stimuli leading to a deeper trough. However, excitations are stronger than inhibition for 10 ms inputs up to at least s-1, in accord with predominantly excitatory responses to movement in healthy monkeys (Anderson and Horak,, 1985; Mitchell et al.,, 1987; Turner and Anderson,, 1997). The model and physiological data suggest that this excitation is mediated mainly via the hyperdirect pathway. In reality, movements may elicit stronger GPe excitation in view of the close association of cortico-STN fibers with the pyramidal tract (Giuffrida et al.,, 1985; Nambu et al.,, 2002), but we do not distinguish between cortical neurons projecting to striatum or STN in our model. In healthy African green monkeys, Bergman et al., (1994) found that the majority of STN cells increased their firing rates when torque was applied to the elbow, although cells that decreased their firing rates did so for longer. It is seen in Fig. 6(f) that the model STN rate displays a transient increase upon cortical stimulation, in agreement with these results.
Considering now the parkinsonian scenarios, reducing the SNR has little effect on most responses to a transient stimulus, and cortical and thalamic responses are virtually indistinguishable from normal ones (cf. Fig. 6). Striatal inhibition of GPe falls away, resulting in an amplified excitatory response to STN input. Corticothalamic responses are slightly attenuated when modeling dopamine loss with mV s and mV s, as expected from the smaller gains. These gain changes were inferred from the increased responsiveness of D2 cells and decreased responsiveness of D1 cells to cortical inputs measured experimentally, and are thus in accord with these results (Cepeda et al.,, 1998; Hernández-López et al.,, 1997; Hsu et al.,, 1995; Levine et al.,, 1996; Kiyatkin and Rebec,, 1996; Nicola et al.,, 2000; Toan and Schultz,, 1985; Umemiya and Raymond,, 1997). The larger increase in the firing rate of the output nuclei seen in Fig. 6(d) is in line with amplified GPi responses to passive limb movements in parkinsonian monkeys (Bergman et al.,, 1994; Filion et al.,, 1988; Wichmann et al., 1994b, ). The inhibitory response in the GPe is greatly amplified in this scenario, as seen in Fig. 6(e). This reproduces the effects of extensive nigrostriatal lesions in rats (Magill et al.,, 2001; Zold et al., 2007b, ), although facilitated excitation has also been observed (Tremblay et al.,, 1989). Finally, the more vigorous responses of STN neurons to cortical stimulation in parkinsonian rats, and to elbow flexion and extension in monkeys, corroborates the results in Fig. 6(f) (Bergman et al.,, 1994; Magill et al.,, 2001). Figures 6(a) shows that weakened intrapallidal inhibition ( mV s) amplifies damped oscillations around the dominant alpha frequency. An even stronger effect on corticothalamic interactions is exerted by smaller cortical gains, causing an amplification of damped oscillations at alpha and beta frequencies throughout the system, as seen in Figs. 6(a) and 6(g). Damped corticothalamic oscillations are enhanced very slightly by a lower GPe firing threshold, whereas a lower STN threshold and larger have the opposite effect. The full parkinsonian state produces changes in responses similar to those resulting only from stronger indirect and weaker direct pathways, and with a cortical rate that is closer to that in the healthy state, in line with experimental observations.
4.3 Responses to ongoing stimuli
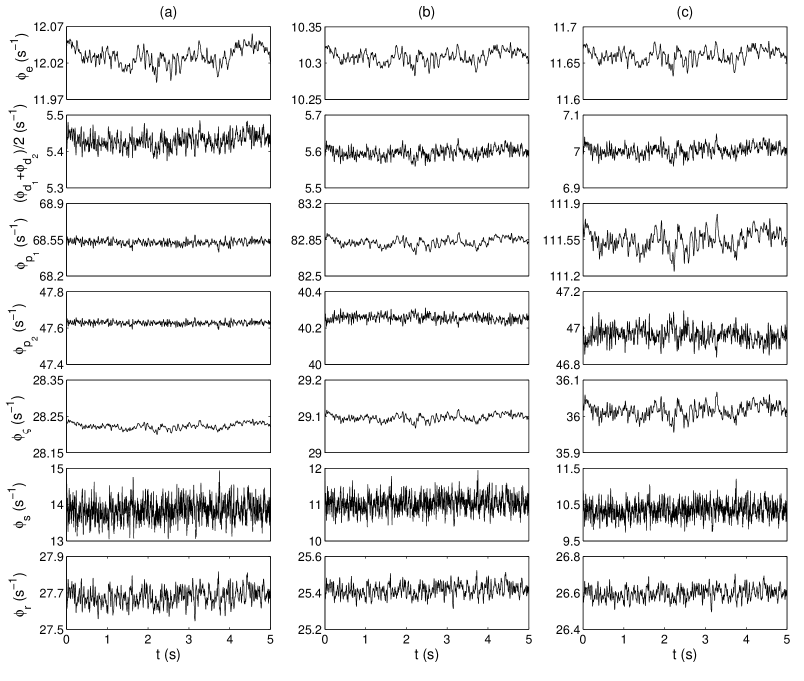
Figure 7 shows pulse rates for ongoing stimuli in the healthy and two model parkinsonian-type states. In each case the stimulus consisted of Gaussian noise with mean 10 s-1 and standard deviation 2 s-1. Firing rates of each component are plotted over equal intervals along the ordinate to allow comparison of variability across states. Figure 7 reveals relatively large fluctuations in pallidal and STN firing rates in modeled parkinsonian states, even in the GPe, where the average firing rate is lower than in the healthy state. These enhanced fluctuations point towards increased synchronization between individual cells in the basal ganglia nuclei. On the other hand, cortical, thalamic, and average striatal signals show reduced variability. The amplitude of fluctuations in the average signal of D1 and D2 cells depends on the relative changes in and , and is elevated compared to the healthy state for relatively large increases in . Mesocortical dopamine loss and changes secondary to nigrostriatal damage normalize the amplitude of the cortical signal, and further amplify basal ganglia fluctuations, as seen in Fig. 7(c). In Sec. 5.2 we will relate these observations to changes in frequency spectra.
5 Oscillations and spectral changes
In certain regimes the model displays oscillations that may culminate in limit cycles. Section 5.1 explores these oscillations, and in particular, we find approximately 5 Hz oscillations in the indirect loop and 20 Hz oscillations in corticothalamic circuits that may spread to the basal ganglia when the indirect pathway becomes strong. The spectral changes caused by dopamine loss are considered in Sec. 5.2. The involvement of the indirect pathway in the generation of parkinsonian symptoms has been questioned (Leblois et al.,, 2006) because GPe lesion does not lead to the characteristic motor symptoms or oscillations (Soares et al.,, 2004). In Sec. 5.3 we challenge the view that GPe lesion experiments exclude the indirect pathway as a substrate of parkinsonian oscillations.
5.1 Limit cycles and the emergence of theta and beta rhythms
The linearized equations given in Sec. 3.2 are only valid in a limited regime. Far from a steady state, the system may be attracted to a different fixed point or a limit cycle. Such deviations from steady state entail changes in gains, and we can vary the gains to determine the boundaries of the linearly stable region. A relationship between the frequencies of wave modes and their wavelengths is termed a dispersion relation. The transfer function (56) has an associated dispersion relation . For each combination of gain values, the dispersion relation has a specific (usually infinite) set of solutions . Of the (complex) solutions , the one with the largest imaginary part decays most slowly, since solutions consist of a weighted sum of plane waves . The boundary of the linearly stable zone occurs where the dispersion relation is satisfied for real , because for Im inputs are infinitely amplified at the corresponding frequencies. Previous work has shown that the spatially uniform mode is generally the least stable (Robinson et al., 2001a, ; Robinson,, 2005), leading us to consider this case. Due to the complexity of our system, instabilities lead to resonances at a range of frequencies depending on the gain being varied.
Perturbations of healthy state
We first consider the types of instabilities that can arise from perturbations around the healthy state, which is the low-firing rate fixed point corresponding to the parameters in Paper I. Table 2 lists the frequencies of instabilities for changes in gains relative to the healthy state. The gains at which the instabilities first occur are also given. For completeness, limits are listed for both increases and decreases in gains, partly since the signs of effective interactions are not known with certainty in every case (this applies especially to intrastriatal interactions). Some instabilities will not readily occur because of an extremely large threshold value, for instance for and . At a 0 Hz instability, the system may shift to a different steady state or go into a limit cycle if one exists.
| Gain | Sign | Upper threshold | (Hz) | Lower threshold | (Hz) |
|---|---|---|---|---|---|
| , | 5.6 | 0 | — | — | |
| , | 0 | — | — | ||
| , | 2.0 | 0 | 4.1 | ||
| 10 | 0 | 5.8 | |||
| 0.71 | 0 | — | — | ||
| 5.6 | 0 | 20 | |||
| 41 | 5.0 | 0 | |||
| 1.0 | 1.3 | — | — | ||
| 12 | 17 | 0 | |||
| 66 | 20 | 0 | |||
| 130 | 4.0 | 0 | |||
| 94 | 6.0 | 0 | |||
| 21 | 0 | 18 | |||
| 1.6 | 10 | — | — | ||
| 21 | 46 | 2.0 | |||
| 23 | 6.1 | 0 | |||
| 0.66 | 0.42 | 46 | |||
| 3.5 | 0 | 3.7 | |||
| 0.80 | 0 | 5.7 | |||
| 0 | 3.6 | ||||
| 4.1 | 3.3 | 0 | |||
| 1.8 | 30 | 0 |
Many of the instabilities in Table 2 are approximately equivalent, because the dispersion relation contains products and ratios of gains. This is clearest for and , since either raising one or decreasing the other leads to an instability at 46 Hz. A resonant frequency in the gamma band for the STN-GPe loop corresponds with the 55 Hz oscillation in the model of Humphries et al., (2006), and identifies this loop as a possible substrate for the enhanced gamma oscillations seen in parkinsonian patients on levodopa right before and during voluntary movements (Brown,, 2003; Cassidy et al.,, 2002).
Other gains that occur together in a loop cause instabilities at different frequencies, because they simultaneously modulate at least one other loop. For some of these gains, the loops that sustain the oscillations are relatively easy to determine. For instance, the gain is part of the thalamocortical loop strength , whereas is only relevant to the intrathalamic loop, . Since and cause instabilities at 3.6 Hz and 30 Hz, respectively, we can conclude that thalamocortical instabilities occur around 3–4 Hz, and intrathalamic rhythms have a frequency of about 30 Hz. In the absence of cortical and corticothalamic feedback and for , this frequency becomes Hz, analogous to spindle instabilities described by Robinson et al., (2002). The 3–4 Hz instability leads to a limit cycle at approximately the same frequency, which often has a spike-wave form and was shown by Robinson et al., (2002) and Breakspear et al., (2006) to have many of the characteristics of petit mal (or absence) seizures.
Other interactions between loops are more difficult to untangle. For example, the gain is part of the indirect and alternative indirect loops 2 and 3 (cf. Table 1 for loop numbering), while is part of the same loops and also the basal ganglia-thalamic loops 10 and 11. The basal ganglia-thalamic circuits through D2 support oscillations around 17 Hz for large . The frequency of the instability due to a large negative (18 Hz) is inversely related to axonal delays in the indirect loop, but also to and . This suggests that the oscillations are sustained by a complex interplay between corticothalamic circuits and the indirect loop, rather than any particular circuit separately. The gain from the output nuclei to the thalamus, , is part of the hyperdirect, direct, classic and alternative indirect (with the GPe-GPi/SNr projection) pathways, as well as loops involving thalamostriatal projections (Loops 1–4 and 9–11). The frequency of the instability for large is 5.7 Hz, and depends inversely on , and , with a weaker dependence on , or . This indicates that the oscillations are sustained by the hyperdirect pathway. Although the frequency due to strong (6.1 Hz) is close to that of tremor rhythms, we saw in Sec. 4.1 that neither a decreased striatal SNR, nor a stronger indirect and weaker direct loop, lead to a large hyperdirect loop gain. This suggests that limit cycle oscillations are unlikely to arise in the hyperdirect loop, as argued further below.
Perturbations leading to a strong indirect pathway: theta oscillations
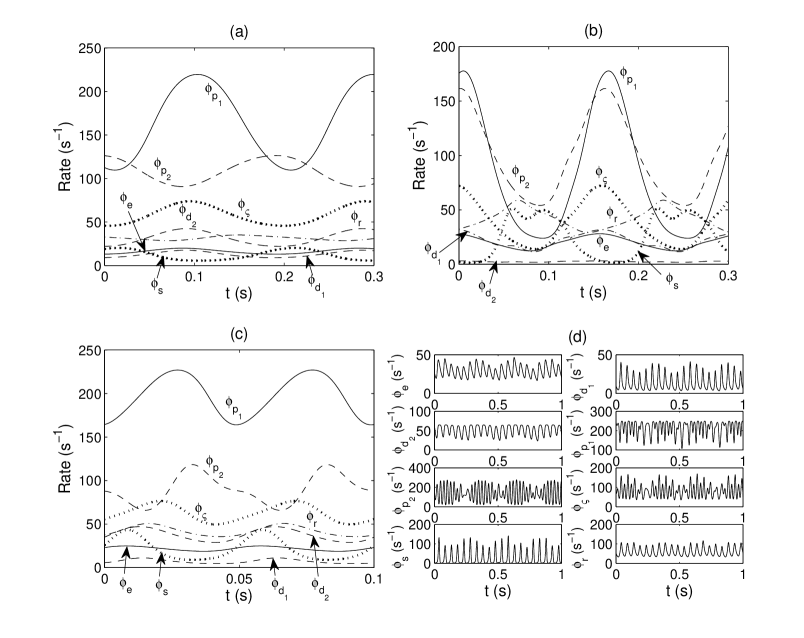
Since electrophysiological evidence and modeling results on firing rates (cf. Paper I) suggest that dopamine depletion increases the gain of the indirect pathway, we look at oscillations that appear when the balance is shifted from the direct to the indirect pathway. For parameter values that entail a sufficiently large increase of the indirect loop gain, the system undergoes a Hopf bifurcation, leading to a limit cycle around 5 Hz. In Fig. 8(a) we consider , which is instantiated by the parameters mV, mV, mV s, mV s, mV s, mV s, mV s, mV s, mV s, and s-1. Since the indirect loop has a negative overall gain, deviations from the mean activity are inverted after one pass around the loop, so that a single period of the oscillation corresponds to two passes, similar to oscillations in corticothalamic circuits involving the TRN (Robinson et al.,, 2002). Approximately 5 Hz oscillations only appear when the ratio of the indirect loop and corticothalamic gains is very large, although the latter still need to be sufficiently powerful for the system to support oscillations (here, ). Considering the extreme parameter values and firing rates, such limit cycle behavior is unlikely to occur in the system as a whole, but could appear in subcircuits, which would explain the limited percentage of oscillatory cells generally recorded (Bergman et al.,, 1994; Lemstra et al.,, 1999; Levy et al.,, 2001; Wichmann and Soares,, 2006). This scenario is further supported by the finding that oscillatory cells in the striatum, STN, and GPi have substantially higher firing rates than non-oscillatory cells (Dejean et al.,, 2008; Levy et al.,, 2000, 2001). Significantly, phase relationships between components comply with those in rats with nigrostriatal lesions (Walters et al.,, 2007): GPe activity is in antiphase with striatal, STN, cortical, and SNr activity. The fact that the GPe oscillates antiphase to STN implies that it is under inhibitory control of the striatum rather than excitatory control of the STN. A caveat is that the oscillations reported by Walters et al., (2007) occurred around 1 Hz, and may have arisen partly as a result of urethane anesthesia (Humphries et al.,, 2006; Magill et al.,, 2000). However, urethane-induced oscillations in GP appear to be in phase with cortical activity in the healthy state, whereas nigrostriatal lesion produces a subpopulation oscillating in antiphase to cortical slow waves (Zold et al., 2007a, ).
Perturbations leading to a strong hyperdirect pathway
Increasing the gain of the hyperdirect pathway (Loop 4) leads to phase relationships that are not supported by experiments. As an example, Fig. 8(b) shows the 6.2 Hz limit cycle corresponding to , obtained by setting mV, mV, mV s, mV s, mV s, and s-1. In this case, the GPe oscillates nearly in phase with the striatum, STN, cortex, and SNr, indicating that it is driven by STN input.
Perturbations leading to a strong indirect pathway: beta oscillations
As discussed above in relation to increases in , it is also possible to obtain 20 Hz oscillations when the indirect loop is strong, as seen experimentally in PD patients (Brown et al.,, 2001; Fogelson et al.,, 2006; Gatev et al.,, 2006; Levy et al.,, 2002; Williams et al.,, 2002). This happens particularly in combination with corticothalamic coupling that is strong in comparison to that leading to 5 Hz oscillations, while the ratio can be somewhat smaller. An example with and is presented in Fig. 8(c). The corresponding parameters are mV, mV, mV s, mV s, mV s, mV s, mV s, mV s, mV s, and s-1. The oscillations first appear in the cortex and thalamus, from where they spread to the basal ganglia. Approximately 20 Hz oscillations can also arise in corticothalamic circuits in the healthy state, seen both experimentally (Courtemanche et al.,, 2003) and in our model. It is possible that either the enhancement of these oscillations in the basal ganglia of PD patients contributes to antikinetic symptoms or tremor, or they may be secondary to other pathological activity rather than a cause of symptoms.
Perturbations leading to a strong indirect pathway: combined theta and beta
Our model predicts that if beta oscillations appear in the corticothalamic loop in the absence of nigrostriatal damage, then strong alpha oscillations will also be seen, since beta rhythms arise as a harmonic of the alpha resonance (Robinson et al., 2001b, ). However, 20 Hz and 3–7 Hz oscillations can appear together without 10 Hz activity when the alpha resonance is suppressed by nigrostriatal damage. Both and the ratio need to be large for this situation to occur. An example is given in Fig. 8(d) for and , with parameter values mV, mV, mV s, mV s, mV s, mV s, mV s, mV s, mV s, and s-1. The strong interaction between the theta and alpha-band roots of the dispersion relation relies on the relatively small distance between these roots, explaining why the indirect loop can suppress alpha, but not beta, activity. This is further discussed in Sec. 5.2.
All the above limit cycles have in common that they require relatively strong corticothalamic activation to arise, provided for instance by brainstem input to the thalamus or reduced intracortical inhibition, potentially helping to explain the worsening of tremor during mental stress (Deuschl et al.,, 2001; Zesiewicz and Hauser,, 2001). The direct loop can also contribute to excitation of the cortex and thalamus, so that 5 Hz and 20 Hz oscillations can appear when both the direct and indirect loops are strong. This implies that the direct and indirect loops need not be completely separated for basal ganglia-thalamocortical loops to support theta and beta oscillations.
For a given set of parameters, we can visualize the effects of changes in gains using a surface plot of the region in which the system is linearly stable. Figure 9 indicates the boundary of the linearly stable region parameterized by the gains of the direct loop, the combined classic and alternative indirect loops (the latter involving the GPe-GPi/SNr projection), and the STN-GPe loop, where the other gains are held constant at the normal values obtained from the parameters in Paper I. The top of the bar corresponds to the healthy state. The left-hand boundary corresponds to an approximately 5 Hz instability that arises when the indirect pathway dominates. When becomes large, the STN-GPe loop sustains oscillations around 46 Hz. The right-hand boundary indicates that a dominant direct pathway causes the system to become unstable at 0 Hz. Finally, the small region at the front corresponds to an instability at 15 Hz when both the direct and indirect pathways are strong.
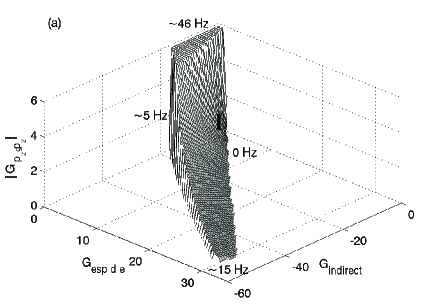
A similar diagram illustrates the dependence of stability and the frequency of theta oscillations on the gains of the hyperdirect, indirect, and corticothalamic loops [Fig. 9]. As discussed above, theta instabilities can arise for either strong hyperdirect or indirect pathways. The analogous roles of the hyperdirect and indirect loops are further indicated by the fact that the system remains stable for larger (Loops 2 and 3) if is relatively small. However, phase relationships, likely changes in corticostriatal connection strengths, and firing rates support the scenario in which is large compared to . Figure 9(b) shows that the system displays an instability at 0 Hz for strong corticothalamic interactions but a weak hyperdirect pathway. The frequency of theta oscillations increases with both and , ranging from about 4.2 to 7.8 Hz, which closely matches the range of tremor frequencies in parkinsonian patients. The lower frequencies of theta oscillations for smaller (a putative index of arousal) could be related to the slowing of tremor seen with age (Deuschl et al.,, 1996).
5.2 Changes in spectra with dopamine loss
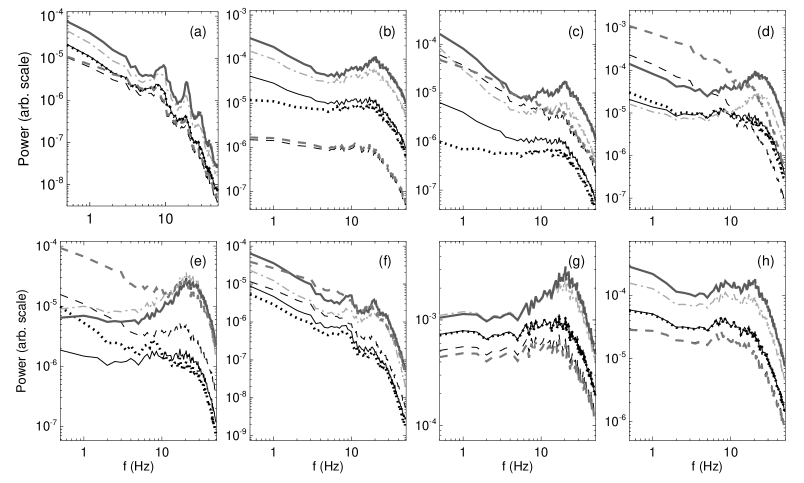
We now investigate the influence of dopamine loss on frequency spectra. Using the transfer function (56) we calculate the linear cortical spectrum up to a proportionality factor via . The results are shown in Fig. 10(a). If parkinsonism is modeled via mV s, mV s, and mV, parameters that represent a decreased striatal SNR, the cortical spectrum is virtually indistinguishable from that in the normal state. Modeling dopamine loss with mV s and mV s shifts the frequency of the alpha root from 8.9 Hz to 8.5 Hz, in line with slowed alpha peaks seen in PD patients (Sinanović et al.,, 2005; Soikkeli et al.,, 1991). A stronger indirect and weaker direct pathway also reduces overall cortical power and relative power at 7–12 Hz from 20% to 13%, but increases relative power at 3–7 Hz from 9% to 17%. Changes in relative alpha and theta power accord with empirical findings (Bosboom et al.,, 2006; Neufeld et al.,, 1994; Stoffers et al.,, 2007), but absolute power is reduced in contrast to what has been found experimentally (Moazami-Goudarzi et al.,, 2008; Tanaka et al.,, 2000). Reduced intrapallidal inhibition and particularly loss of mesocortical dopamine may account for some of the experimentally observed increase in power (cf. Fig. 10). It is interesting to note that balancing the relative strengths of excitation and inhibition in the cortex also produces an increase in relative theta and beta power. Thus, our model confirms that lateral disinhibition in the cortex can account for the experimentally observed co-production of low- and high-frequency activity, which has been termed the ‘edge effect’ (Llinás et al.,, 2005). The full parkinsonian state combines increased relative 3–7 Hz (23% vs. 9%) and decreased relative 7–12 Hz power (15% vs. 20%) with overall power not much lower than in the normal state (total power 1 Hz is 89% of the normal value). Assuming that cortical power is slightly reduced when the striatum is significantly involved, in line with the suppressed excitability of regions normally co-activated with the striatum, or during tasks that specifically require striatal activation (Monchi et al.,, 2004, 2007), these are realistic spectral changes. In cortical areas not directly linked with the striatum, power may be increased due to diffuse loss of dopaminergic innervation, or due to compensatory mechanisms. Finally, changes in parameters other than corticostriatal coupling strengths further slow the alpha root to 8.2 Hz in the full parkinsonian state.
The dispersion relation for the spatially uniform case is [cf. Eq. (57)]. Its solutions up to 40 Hz are plotted in Figs. 10(b) and 10(c) for the normal and dopamine-depleted states. Each of the states represents a stable system, since all roots are found in the lower half plane. Increased relative theta power corresponds to a smaller distance between the least stable roots on the imaginary axis, which ‘pulls’ the alpha roots to lower power and frequency. These root locus diagrams also show that reduced intracortical inhibition and a lower GPe threshold potential enhance gamma-band power around 35 Hz in the STN-GPe network. The frequency of this rhythm goes up as the corresponding roots move closer to the real axis, explaining the higher frequency (46 Hz) of limit cycles in the STN-GPe loop.
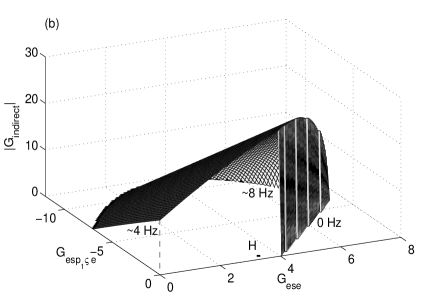
Spectra obtained by numeric integration of the full nonlinear equations are shown in Fig. 11. These were computed by averaging the Fourier transforms of 60 consecutive 2-s epochs for a Gaussian white noise input with mean 10 s-1 and standard deviation 2 s-1. The main results of parameter changes mimicking a reduced striatal SNR are lower-amplitude fluctuations in D1 and D2 cells, and increased low-frequency power in the GPe. The parameters mV s and mV s lead to decreased corticothalamic power, and increased power in all basal ganglia populations except D1. This accords with the enhanced fluctuations in the responses of the basal ganglia, and reduced fluctuations in thalamocortical responses to ongoing inputs seen in Sec. 4.3. Furthermore, these parameter changes amplify relative power at 15–25 Hz in the cortex, D1 neurons, and the STN, in line with increased beta coherence between cortex and STN in PD patients (Brown et al.,, 2001; Marsden et al.,, 2001). Lateral disinhibition of the GPe ( mV s) enhances fluctuations in all populations, and particularly activity around 20–30 Hz in both pallidal segments and the STN. Weaker cortical interactions ( mV s, mV s) cause similar changes, which are more pronounced in all components except the GPe than changes caused by reduced intrapallidal inhibition. Figure 11 shows that the full parkinsonian state is accompanied by increased relative 3–7 Hz power throughout the BGTCS compared to the healthy state. Relative power at 15–25 Hz is enhanced in the cortex (5.2% vs. 4.0%), D1 neurons (27% vs. 25%), and the STN (12% vs. 5%), and decreased in the remaining populations, partly due to the increase in theta power. As a fraction of power Hz, 15–25 Hz activity is enhanced also in the GPe (38% vs. 36%).

5.3 The paradox of GPe lesion
Leblois et al., (2006) did not include the indirect pathway in their model partly because of the finding by Soares et al., (2004) that GPe lesion in the monkey does not lead to parkinsonian motor symptoms or altered activity patterns in the GPi. The authors concluded that this invalidates the indirect loop as a candidate for the origin of synchronous oscillations and motor symptoms in PD. We modeled GPe lesion by reducing the absolute values of all gains emanating from the GPe, and , multiplying each by a factor between 0.1 and 1 with results shown in Fig. 12. Although corticothalamic rates are reduced, while pallidal and STN rates are increased by GPe lesion in our model, a reduction in all the gains implies that oscillations are damped rather than enhanced in the indirect, hyperdirect, and STN-GPe loops. However, as we saw in the previous sections, strengthening of the indirect pathway by either increasing or can lead to slow oscillations in this loop. Thus, a putative lack of parkinsonian signs following GPe lesion does not preclude the involvement of the indirect pathway in the generation of synchronous oscillations and motor symptoms. In fact, Chesselet and Delfs, (1996) noted that GPe lesion does not necessarily reflect what happens with nigrostriatal degeneration, precisely because it does not reproduce changes elsewhere, such as in STN or GPi. Besides, the negative result of Soares et al., (2004) may be related to a relatively small extent or to the location of the lesions, since Zhang et al., (2006) did report worsened akinetic symptoms after GPe lesions in MPTP-treated rhesus monkeys. This matches the smaller value of with reduced GPe output in our model (0.6 for vs. 0.9 in the healthy state, if impaired cortical inhibition is linked with akinesia (cf. Sec. 4.1).
6 Summary and discussion
Using a physiologically based mean-field model of the basal ganglia-thalamocortical system (BGTCS), we have reproduced many of the electrophysiological correlates of Parkinson’s disease (PD) with parameter values in the healthy and parkinsonian states estimated from known physiology. The analysis builds on a companion paper (Van Albada and Robinson,, 2009), which examined the effects of nigrostriatal dopamine depletion on firing rates. In that paper we showed that an increase in the cortical connection strength to striatal neurons expressing the D2 class of dopamine receptor, possibly along with a reduced connection strength to D1-expressing striatal neurons, leads to increased rates of the striatum, STN, and output nuclei, and decreased GPe and thalamic rates, in good agreement with many experiments. On the other hand, simultaneous decreases in corticostriatal connection strengths and striatal firing thresholds, chosen to mimic a reduced striatal signal-to-noise ratio,
had little effect on rates. We note that these results do not bear directly on the role of dopamine as a contrast enhancer, since these particular parameter changes may not adequately capture a reduced signal-to-noise ratio in the striatum as a whole, and dopamine may enhance differential responses to strong and weak inputs in some striatal neurons but not others. Disinhibition of the cortex due to impaired local dopaminergic innervation helped normalize the cortical firing rate, as seen experimentally. Other changes secondary to nigrostriatal damage, including lower GPe and STN firing thresholds and weaker intrapallidal inhibition, could account for the comparatively large increase in STN rate and conflicting findings on changes in GPe rate. In the present work we have investigated the dynamical implications of the above ways of modeling dopamine depletion. The wide range of phenomena accounted for suggests that the model provides a physiologically realistic representation of the mean-field dynamics of the BGTCS. Our main findings are listed below.
Outcomes of model
(i) Reduced availability of cortical dopamine may contribute to bradykinesia in PD patients by attenuating intracortical excitation by pyramidal cells, and especially inhibition by interneurons (Gulledge and Jaffe,, 2001; Gao and Goldman-Rakic,, 2003; Thurley et al.,, 2008), resulting in a smaller difference between excitatory and inhibitory gains. This causes more gradual changes in cortical activity, in agreement with slowed motor unit responses to transcranial magnetic stimulation in PD patients (Kleine et al.,, 2001), and slowed responses of motor cortex neurons in monkeys treated with the neurotoxin 1-methyl-4-phenyl-1,2,3,6-tetrahydropyridine (MPTP) (Doudet et al.,, 1990). Also, the silent period after suprathreshold stimulation of the cortex during muscle contraction is shortened in parkinsonian patients (Cantello et al.,, 1991), which is reversed by dopaminergic medication (Priori et al.,, 1994). Since the silent period is considered to be caused by the activation of GABAergic interneurons (Fuhr et al.,, 1991), this indicates the importance of impaired cortical inhibition in bradykinesia. Our model suggests that some of these changes are also explained by nigrostriatal dopamine loss, which can decrease cortical gains, and the difference between the strengths of intracortical excitation and inhibition, due to a shift in balance from the direct to the indirect pathway.
Other explanations for bradykinesia/akinesia have been put forward, such as overactivity of GPi and/or STN projections to the PPN (Munro-Davies et al.,, 1999), which in turn innervates the pontine and medullary reticulospinal systems (Jackson and Crossman,, 1983). In addition, rigidity, muscle weakness, tremor, slowing of thought, and compensation for loss of movement accuracy may all contribute to bradykinesia (Berardelli et al.,, 2001). Thus, other factors are likely to complement the mechanism proposed here.
(ii) An increase in the cortico-D2 connection strength with or without a weaker cortico-D1 projection leads to realistic changes in responses to transient stimuli. More vigorous model responses are observed in the STN and the output nuclei, in accord with experiments (Bergman et al.,, 1994; Filion et al.,, 1988; Wichmann et al., 1994b, ). As also observed experimentally (Magill et al.,, 2001; Zold et al., 2007b, ), the inhibitory phase of a triphasic early GPe model response becomes more pronounced as the indirect loop gains in strength. Changes in D1 and D2 responsiveness are in line with recorded effects of dopamine on the sensitivity of striatal medium spiny neurons to cortical inputs: D1 responses are attenuated and D2 responses are amplified with dopamine loss, as seen in experiments (Cepeda et al.,, 1998; Hernández-López et al.,, 1997; Hsu et al.,, 1995; Kiyatkin and Rebec,, 1996; Levine et al.,, 1996; Nicola et al.,, 2000; Toan and Schultz,, 1985; Umemiya and Raymond,, 1997).
(iii) The indirect basal ganglia pathway can sustain 5 Hz oscillations if dopamine depletion leads to greater cortical influence on D2-expressing striatal neurons with or without reduced influence on D1-expressing neurons. The fact that modulation of the direct pathway need not be opposite to that of the indirect pathway underlines that a complete separation of D1 and D2 neurons is not required to obtain this result. Limit cycle oscillations around 5 Hz only appear when the indirect loop is very strong compared to thalamocortical interactions, which is unlikely to happen in the system as a whole and confines oscillations to subcircuits. This scenario is supported by the limited proportion of tremor cells recorded in components of the BGTCS in parkinsonian humans and animals (Bergman et al.,, 1994; Lemstra et al.,, 1999; Levy et al.,, 2001; Wichmann and Soares,, 2006), and the high firing rate of oscillatory cells compared to non-oscillatory cells (Dejean et al.,, 2008; Levy et al.,, 2000, 2001). As explained in the Introduction, central oscillations need not directly determine the frequency of parkinsonian tremor, since cortical and peripheral factors appear to play a modulatory role. However, the frequency of oscillations in the indirect loop predicted by our model is close to the 4–6 Hz of parkinsonian rest tremor (Deuschl and Lücking,, 1989), as well as to measured rhythms in the basal ganglia, cortex, and thalamus (Bergman et al.,, 1994; Magnin et al.,, 2000; Raz et al.,, 2000; Volkmann et al.,, 1996; Wang et al.,, 2005; Wichmann et al.,, 1999). A relatively high level of arousal is required for limit cycle oscillations to appear, possibly helping to explain why tremor is exacerbated by anxiety and stress (Deuschl et al.,, 2001; Zesiewicz and Hauser,, 2001).
(iv) The phase relationships between the basal ganglia components oscillating at 5 Hz accord with those measured by Walters et al., (2007) for 1 Hz oscillations in anesthetized rats with dopaminergic lesions. Furthermore, Zold et al., 2007a reported a population of GP (the rodent homolog of GPe) neurons whose firing rate was modulated in antiphase to cortical slow waves and striatal activation in parkinsonian rats under anesthesia, whereas GP activity was in phase with cortex and striatum in healthy anesthetized rats. This suggests that parkinsonian slow oscillations are relayed via the striatopallidal axis rather than via the hyperdirect pathway through the STN, since the GPe is inhibited by the striatum, but excited by the STN. If these results generalize to PD patients, this is strong evidence for an origin of parkinsonian theta oscillations in the indirect loop. Leblois et al., (2006) proposed that the hyperdirect loop is the main substrate of parkinsonian oscillations based on a neuronal network model of the direct and hyperdirect loops. This would imply that GPe activity would be modulated in phase with STN activity, being driven by excitatory input from this nucleus, contrary to experimental observations. Moreover, an origin in the hyperdirect loop was suggested based on the assumption that firing rates are virtually unchanged, which does not appear to be generally applicable (see Paper I). In our model, a source of parkinsonian oscillations in the hyperdirect loop is incompatible with increased striatal rates and a decreased GPe rate, often measured in animal models of PD (Boraud et al.,, 1998; Chen et al.,, 2001; Filion and Tremblay,, 1991; Heimer et al.,, 2002; Kish et al.,, 1999; Pan and Walters,, 1988; Walters et al.,, 2007). In contrast, our model predicts both realistic changes in firing rates and oscillations in the indirect loop simultaneously for a stronger cortico-D2 connection. Moreover, striatal involvement in parkinsonian rhythms is strongly implied by the dense dopaminergic innervation of this nucleus, which is expected to powerfully modulate corticostriatal connection strengths.
(v) In the model, oscillations around 20 Hz that are normally largely confined to corticothalamic circuits are enhanced and spread to the basal ganglia (particularly to the STN) when the indirect loop becomes strong due to nigrostriatal degeneration, while cortex and thalamic relay nuclei are also relatively tightly coupled. Such enhanced 20 Hz oscillations have been found in many experimental studies of parkinsonism (Brown et al.,, 2001; Brown and Williams,, 2005; Fogelson et al.,, 2006; Gatev et al.,, 2006; Levy et al.,, 2002; Sharott et al.,, 2005). Cortical activity has been shown to be phase-advanced with respect to STN activity at 30 Hz, corroborating a corticothalamic origin of beta oscillations (Marsden et al.,, 2001; Williams et al.,, 2002). Depending on the relative gains of the corticothalamic and indirect loops, model rhythms at 20 Hz may be stronger or weaker than 5 Hz rhythms, and limit cycles may therefore show a combination of these frequencies, also in accord with experiments (Levy et al.,, 2001).
Enhanced beta oscillations in the basal ganglia may either be a side effect of other pathological changes, or be directly related to parkinsonian symptoms, as suggested by a number of studies. For instance, Silberstein et al., (2003) found a larger percentage of local field potential activity at 11–30 Hz in the pallidum of untreated PD patients compared to treated ones. Moreover, a study in which 20 Hz stimulation of the STN slowed finger-tapping rates supported a relationship between beta oscillations and akinesia/bradykinesia (Chen et al.,, 2007). A connection between beta oscillations in the basal ganglia and akinetic symptoms is further supported by the fact that the oscillations are attenuated before and during voluntary movement (Kühn et al.,, 2004), as is 15–30 Hz coherence between motor cortex and muscles (Farmer,, 2002). On the other hand, the low-pass filter characteristics of the pallidal-cortex-muscle axis suggest that beta oscillations may not strongly influence movement (Rivlin-Etzion et al.,, 2008), and 20 Hz synchronization in the STN was found to correlate with motor improvement after dopamine replacement therapy, rather than with the initial severity of symptoms (Weinberger et al.,, 2006). Thus, the precise relation between beta oscillations and parkinsonian symptoms remains to be elucidated.
(vi) Our model predicts a resonant frequency in the gamma band (30 Hz) for the loop formed by STN and GPe, in accord with modeling results of Humphries et al., (2006). Alterations in this network may therefore be responsible for enhanced gamma power in the STN observed in PD patients on levodopa (Fogelson et al.,, 2005), particularly in relation to movement (Cassidy et al.,, 2002). More recently, such gamma activity was also recorded in patients after overnight withdrawal from antiparkinsonian medication (Trottenberg et al.,, 2006). In PD patients, STN activity has been found to lead cortical activity in the gamma band (Williams et al.,, 2002), supporting our finding of an origin in the STN region.
(vii) Stronger cortico-D2 coupling increases the amplitude of fluctuations in firing rates across the spectrum in D2-expressing striatal neurons, GPe, STN, and the output nuclei, suggesting an increase in synchronization between individual cells. This applies especially to the GPe, where the firing rate is decreased, since increased rates may enhance power without changing the degree of synchronization. However, power at low frequencies is amplified by a factor of up to 40 in the output nuclei, whereas the increase in average rate from 69 s-1 to 112 s-1 only accounts for an approximate factor of 2.7 if the standard deviation is taken to be proportional to the average rate. STN power is also more amplified than accounted for by its higher average rate in the parkinsonian state. This strongly implies that synchronization is enhanced, in concordance with experimental studies (Goldberg et al.,, 2004; Hammond et al.,, 2007; Heimer et al.,, 2002; Levy et al.,, 2000; Morris et al.,, 2005). Levy et al., (2002) proposed that only oscillatory cells are synchronized in parkinsonism, although this study may have failed to detect fluctuations at the population level, and did not compare with healthy subjects. Our results suggest that dopamine loss increases synchronization across the whole spectrum, rather than only in peaks, thus including cells whose activity is not modulated at one of the main resonant frequencies of the system. This result requires further experimental verification.
(viii) Dominance of the indirect pathway increases relative theta power, decreases relative alpha power, and shifts the alpha peak of the electroencephalogram (EEG) to lower frequencies, in agreement with empirical findings (Bosboom et al.,, 2006; Neufeld et al.,, 1994; Sinanović et al.,, 2005; Soikkeli et al.,, 1991; Stoffers et al.,, 2007). Changes secondary to nigrostriatal dopamine loss, such as reduced intrapallidal inhibition, a stronger striato-GPe projection due to enhanced release of GABA, and lower GPe and STN threshold potentials, may also contribute to these spectral changes by further increasing the gain of the indirect loop. More pronounced EEG frequency reduction in demented patients may be partly explained by additional changes in cholinergic and noradrenergic signaling (Buzsáki et al.,, 1988; Candy et al.,, 1983; Cash et al.,, 1987; Dubois et al.,, 1983; Metherate et al.,, 1992). Total EEG power is decreased by a stronger indirect pathway in the model, in accord with its inhibitory effect on the thalamus and cortex. However, EEG power has been reported to be increased in PD (Moazami-Goudarzi et al.,, 2008; Tanaka et al.,, 2000). Loss of intrinsic cortical dopamine, reduced intrapallidal inhibition, and a lower GPe firing threshold may partly normalize EEG power that is reduced by a dominant indirect pathway. Considering that cortical responses are suppressed in PD in tasks or regions with significant involvement of the striatum (Monchi et al.,, 2004, 2007), we do not expect these changes to increase EEG power beyond the normal level. Rather, diffuse loss of mesocortical dopamine leading to cortical disinhibition (Mattay et al.,, 2002), and compensatory changes in areas not directly connected to the basal ganglia (Samuel et al.,, 1997), may cause the observed EEG amplification, whereas we expect EEG fluctuations in areas strongly connected with the basal ganglia to be diminished.
Wider context and future directions
The above results were obtained using a small number of variations around a single set of parameters representing the healthy state. Thus, the same axonal, dendritic, and synaptic delays that give realistic responses to transient cortical stimuli, a resonant frequency of the STN-GPe loop in the gamma band, and an alpha peak frequency around 9–10 Hz, predict frequencies around 5 Hz and 20 Hz for oscillations in the parkinsonian state. Moreover, the same parameter changes that yield plausible firing rate changes with nigrostriatal damage lead to increased relative theta power, decreased relative alpha power, and a lower alpha peak frequency, all in accord with experiments. This provides firm support for the proposed mechanisms, and strongly suggests that combinations of parameter values required to obtain these results were chosen in physiologically realistic ranges.
The debate on the substrate of parkinsonian oscillations has been fueled by paradoxical results concerning changes in GPi and STN activity and motor behavior following GPe lesion. Soares et al., (2004) observed a lack of parkinsonian symptoms or oscillatory bursting after GPe lesion, prompting Leblois et al., (2006) to reject the indirect pathway as a possible source of parkinsonian oscillations. However, despite the generally decreased firing rate of the GPe in parkinsonism, nigrostriatal and GPe lesions can have notably different effects on firing patterns in the BGTCS. This is apparent in our model from the fact that weaker efferent projections from the GPe lower all gains, rendering the system more stable and damping oscillations. Therefore, the supposed lack of parkinsonian symptoms following GPe lesion does not preclude the possibility that tremor rhythms arise in the indirect basal ganglia circuit. In fact, Soares et al., (2004) remarked that the involvement of the GPe is supported by the observation that oscillatory cells in the STN and GPi were slightly less numerous in GPe-lesioned animals than in intact animals. Furthermore, our model predicts that damage to the GPe impairs intracortical inhibition more than excitation, analogous to nigrostriatal damage, which matches the finding by Zhang et al., (2006) that GPe ablation does exacerbate the parkinsonian symptoms of akinesia/bradykinesia in rhesus monkeys previously treated with MPTP.
The different effects of GPe lesion and nigrostriatal lesions that reduce GPe activity exemplify the more general rule that a single structure can contribute to a variety of phenomena, depending on its connections and the parameter values of the system. Single circuits can also support different types of activity, as evidenced for instance by the different frequencies of oscillations in the indirect loop depending on the relative values of corticothalamic and indirect loop gains. This example immediately makes it clear that multiple structures can also contribute to a single effect, underlining the importance of including circuit interactions in models of neural systems rather than focusing only on localized ‘pacemakers’, as has sometimes been done in the past. An aspect of such models that is perhaps less often considered is that certain activity patterns can be sustained by multiple interacting circuits. An example was given in Sec. 5.1, where oscillations were derived arising from an interplay between corticothalamic circuits and the indirect loop, rather than in any circuit separately.
It is significant to note that bursting activity is not required to account for increased theta and beta oscillations and EEG slowing. Accordingly, bursting has gradually been deemphasized in the literature as an explanation for parkinsonian oscillations and symptoms, since it appears to be particularly prevalent during dyskinesias (Lee et al.,, 2001; Silberstein et al.,, 2003), treatment with the dopamine agonist apomorphine increases aperiodic bursting in STN and GPi (Levy et al.,, 2001), and bursts around tremor frequency give way to slower rhythmic bursts during voluntary movement (Rodriguez-Oroz et al.,, 2001). Nevertheless, calcium spike bursts in the relay nuclei may contribute to enhanced thalamocortical theta coherence (Sarnthein and Jeanmonod,, 2007), and to overproduction of beta and gamma activity in the cortex via the edge effect (Llinás et al.,, 2005; Moazami-Goudarzi et al.,, 2008). Therefore, taking into account thalamic bursting in our model may help explain increases in EEG power in the theta, beta, and gamma bands. It would also be relevant to include bursting properties of STN (Beurrier et al.,, 1999; Bevan et al.,, 2000) and GPe (Nambu and Llinás,, 1994) cells, which may modify the amplitude, frequency, and timing of rhythms predicted by our model. We aim to modify our model by including distinctive electrophysiological properties of STN, GPe, and thalamic bursting neurons in future work.
In addition to the functional interactions included in our model so far, there are projections from the GPe to the TRN (Gandia et al.,, 1993; Hazrati and Parent,, 1991) and to striatal interneurons (Bevan et al.,, 1998), from the thalamic parafascicular nucleus to the STN (Hassani et al.,, 1997; Mouroux et al.,, 1995), and between the PPN and all elements of the BGTCS (Hammond et al.,, 1983; Jackson and Crossman,, 1983; Lavoie and Parent,, 1994; Orieux et al.,, 2000). Studies in rats with nigrostriatal lesions have suggested that excitatory projections from the PPN are partly responsible for STN hyperactivity (Breit et al.,, 2006), despite the loss of neurons from this region in PD (Zweig et al.,, 1989), and the induction of akinesia by PPN lesion in otherwise healthy primates (Munro-Davies et al.,, 1999; Pahapill and Lozano,, 2000). Some of these projections may be included in future work. Instead of more detailed modeling, an alternative approach would be to simplify the current model to extract those features essential for explaining phenomena such as changes in firing rates, theta, beta, or gamma rhythms, or trends in EEG spectra. Simplified models could be analyzed more systematically and provide more robust parameter estimates, although these estimates would be less easily related to the underlying complex physiology. Thus, both more detailed and sparser modeling can provide new information complementing the predictions of the current model.
Acknowledgments
The authors are grateful to J.M. Clearwater and C.J. Rennie for help with some figures. This work was supported by an Endeavour International Postgraduate Research Scholarship, an International Postgraduate Award, and the Australian Research Council.
References
- Afsharpour, (1985) Afsharpour, S., 1985. Topographical projections of the cerebral cortex to the subthalamic nucleus. J. Comp. Neurol., 236, 14–28.
- Alberts, (1972) Alberts, W., 1972. A simple view of parkinsonian tremor. Electrical stimulation of cortex adjacent to the rolandic fissure in awake man. Brain Res., 44, 357–369.
- Alberts et al., (1969) Alberts, W., Wright Jr., E., Feinstein, B., 1969. Cortical potentials and parkinsonian tremor. Nature (London), 221, 670–672.
- Albin et al., (1989) Albin, R., Young, A., Penney, J., 1989. The functional anatomy of basal ganglia disorders. Trends Neurosci., 12, 366–375.
- Alexander and Crutcher, (1990) Alexander, G., Crutcher, M., 1990. Functional architecture of basal ganglia circuits: neural substrates of parallel processing. Trends Neurosci., 13, 266–271.
- Alexander et al., (1986) Alexander, G., DeLong, M., Strick, P., 1986. Parallel organization of functionally segregated circuits linking basal ganglia and cortex. Ann. Rev. Neurosci., 9, 357–381.
- Anderson and Horak, (1985) Anderson, M., Horak, F., 1985. Influence of the globus pallidus on arm movements in monkeys. III. Timing of movement-related information. J. Neurophysiol., 54, 433–448.
- Ashby et al., (2001) Ashby, P., Paradiso, G., Saint-Cyr, J., Chen, R., Lang, A., Lozano, A., 2001. Potentials recorded at the scalp by stimulation near the human subthalamic nucleus. Clin. Neurophysiol., 112, 431–437.
- Baufreton et al., (2005) Baufreton, J., Atherton, J., Surmeier, D., Bevan, M., 2005. Enhancement of excitatory synaptic integration by GABAergic inhibition in the subthalamic nucleus. J. Neurosci., 25, 8505–8517.
- Berardelli et al., (2001) Berardelli, A., Rothwell, J., Thompson, P., Hallett, M., 2001. Pathophysiology of bradykinesia in Parkinson’s disease. Brain, 124, 2131–2146.
- Bergman et al., (1994) Bergman, H., Wichmann, T., Karmon, B., DeLong, M., 1994. The primate subthalamic nucleus. II. Neuronal activity in the MPTP model of parkinsonism. J. Neurophysiol., 72, 507–520.
- Bernheimer et al., (1973) Bernheimer, H., Birkmayer, W., Hornykiewicz, O., Jellinger, K., Seitelberger, F., 1973. Brain dopamine and the syndromes of Parkinson and Huntington. J. Neurol. Soc., 20, 415–455.
- Beurrier et al., (1999) Beurrier, C., Congar, P., Bioulac, B., Hammond, C., 1999. Subthalamic nucleus neurons switch from single-spike activity to burst-firing mode. J. Neurosci., 19 (2), 599–609.
- Bevan et al., (1998) Bevan, M., Booth, P., Eaton, S., Bolam, J., 1998. Selective innervation of neostriatal interneurons by a subclass of neuron in the globus pallidus of the rat. J. Neurosci., 18, 9438–9452.
- Bevan et al., (2000) Bevan, M., Wilson, C., Bolam, J., Magill, P., 2000. Equilibrium potential of GABAa current and implications for rebound burst firing in rat subthalamic neurons in vitro. J. Neurophysiol., 83, 3169–3172.
- Bevan et al., (2006) Bevan, M., Atherton, J., Baufreton, J., 2006. Cellular principles underlying normal and pathological activity in the subthalamic nucleus. Curr. Opin. Neurobiol., 16, 621–628.
- Bolam et al., (2000) Bolam, J., Hanley, J., Booth, P., Bevan, M., 2000. Synaptic organisation of the basal ganglia. J. Anat., 196, 527–542.
- Boraud et al., (1998) Boraud, T., Bezard, E., Guehl, D., Bioulac, B., Gross, C., 1998. Effects of l-DOPA on neuronal activity of the globus pallidus externalis (GPe) and globus pallidus internalis (GPi) in the MPTP-treated monkey. Brain Res., 787, 157–160.
- Bosboom et al., (2006) Bosboom, J., Stoffers, D., Stam, C., van Dijk, B., Verbunt, J., Berendse, H., Wolters, E., 2006. Resting state oscillatory brain dynamics in Parkinson’s disease: an MEG study. Clin. Neurophysiol., 117, 2521–2531.
- Braitenberg and Schüz, (1998) Braitenberg, V., Schüz, A., 1998. Cortex: Statistics and Geometry of Neuronal Connectivity, second ed. Springer-Verlag, Berlin, Heidelberg, New York.
- Breakspear et al., (2006) Breakspear, M., Roberts, J.A., Terry, J.R., Rodrigues, S., Mahant, N., Robinson, P.A., 2006. A unifying explanation of primary generalized seizures through nonlinear brain modeling and bifurcation analysis. Cereb. Cortex, 16, 1296–1313.
- Breit et al., (2006) Breit, S., Lessmann, L., Unterbrink, D., Popa, R., Gasser, T., Schulz, J., 2006. Lesion of the pedunculopontine nucleus reverses hyperactivity of the subthalamic nucleus and substantia nigra pars reticulata in a 6-hydroxydopamine rat model. Eur. J. Neurosci., 24, 2275–2282.
- Bressloff, (2001) Bressloff, P.C., 2001. Traveling fronts and wave propagation failure in an inhomogeneous neural network. Physica D, 155, 83–100.
- Bressloff et al., (2003) Bressloff, P.C., Folias, S.E., Prat, A., Li, Y.-X., 2003. Oscillatory waves in inhomogeneous neural media. Phys. Rev. Lett., 91, 178101.1–4.
- Brown, (2003) Brown, P., 2003. Oscillatory nature of human basal ganglia activity: relationship to the pathophysiology of Parkinson’s disease. Mov. Disord., 18, 357–363.
- Brown and Williams, (2005) Brown, P., Williams, D., 2005. Basal ganglia local field potentials activity: character and functional significance in the human. Clin. Neurophysiol., 116, 2510–2519.
- Brown et al., (2001) Brown, P., Oliviero, A., Mazzone, P., Insola, A., Tonali, P., Di Lazzaro, V., 2001. Dopamine dependency of oscillations between subthalamic nucleus and pallidum in Parkinson’s disease. J. Neurosci., 21, 1033–1038.
- Burbaud et al., (1995) Burbaud, P., Gross, C., Benazzouz, A., Coussemacq, M., 1995. Reduction of apomorphine-induced rotational behaviour by subthalamic lesion in 6-OHDA lesioned rats is associated with a normalization of firing rate and discharge patterns of pars reticulata neurons. Exp. Brain Res., 105, 48–58.
- Buzsáki, (1991) Buzsáki, G., 1991. The thalamic clock: emergent network properties. Neuroscience, 41, 351–364.
- Buzsáki et al., (1988) Buzsáki, G., Bickford, R., Ponomareff, G., Thal, L., Mandel, R., Gage, F., 1988. Nucleus basalis and thalamic control of neocortical activity in the freely moving rat. J. Neurosci., 8, 4007–4026.
- Candy et al., (1983) Candy, J., Perry, R., Perry, E., Irving, D., Blessed, G., Fairbairn, A., Tomlinson, B., 1983. Pathological changes in the nucleus of Meynert in Alzheimer’s and Parkinson’s diseases. J. Neurol. Sci., 59, 277–289.
- Cantello et al., (1991) Cantello, R., Gianelli, M., Bettucci, D., Civardi, C., De Angelis, M., Mutani, R., 1991. Parkinson’s disease rigidity: magnetic motor evoked potentials in a small hand muscle. Neurology, 41, 1449–1456.
- Carpenter, (1981) Carpenter, M., 1981. Anatomy of the corpus striatum and brain stem integrating systems. In: Handbook of Physiology, vol. 2. American Physiological Society, Bethesda, Maryland, pp. 947–995.
- Cash et al., (1987) Cash, R., Dennis, T., L’Heureux, R., Raisman, R., Javoy-Agid, F., Scatton, B., 1987. Norephinephrine and dopamine in locus ceruleus. Neurology, 37, 42–46.
- Cassidy et al., (2002) Cassidy, M., Mazzone, P., Oliviero, A., Insola, A., Tonali, P., Di Lazzaro, V., Brown, P., 2002. Movement-related changes in synchronization in the human basal ganglia. Brain, 125, 1235–1246.
- Cepeda et al., (1998) Cepeda, C., Colwell, C., Itri, J., Chandler, S., Levine, M., 1998. Dopaminergic modulation of NMDA-induced whole cell currents in neostriatal neurons in slices: contribution of calcium conductances. J. Neurophysiol., 79, 82–94.
- Chen et al., (2001) Chen, M.-T., Morales, M., Woodward, D., Hoffer, B., Janak, P., 2001. In vivo extracellular recording of striatal neurons in the awake rat following unilateral 6-hydroxydopamine lesions. Exp. Neurol., 171, 72–83.
- Chen et al., (2007) Chen, C., Litvak, V., Gilbertson, T., Kühn, A., Lu, C., Lee, S., Tsai, C., Tisch, S., Limousin, P., Hariz, M., Brown, P., 2007. Excessive synchronization of basal ganglia neurons at 20 Hz slows movement in Parkinson’s disease. Exp. Neurol., 205, 214–221.
- Chervin et al., (1988) Chervin, R.D., Pierce, P.A., Connors, B.W., 1988. Periodicity and directionality in the propagation of epileptiform discharges across neocortex. J. Neurophysiol., 60, 1695–1713.
- Chesselet and Delfs, (1996) Chesselet, M.-F., Delfs, J., 1996. Basal ganglia and movement disorders: an update. Trends Neurosci., 19, 417–422.
- Cordeau et al., (1960) Cordeau, J., Gybels, J., Jasper, H., Poirier, L., 1960. Microelectrode studies of unit discharges in the sensorimotor cortex. Neurology, 10, 591–600.
- Courtemanche et al., (2003) Courtemanche, R., Fujii, N., Graybiel, A., 2003. Synchronous, focally modulated -band oscillations characterize local field potential activity in the striatum of awake behaving monkeys. J. Neurosci., 23, 11741–11752.
- Dejean et al., (2008) Dejean, C., Gross, C.E., Bioulac, B., Boraud, T., 2008. Dynamic changes in the cortex-basal ganglia network after dopamine depletion in the rat. J. Neurophysiol., 100, 385–396.
- Deschênes et al., (1982) Deschênes, M., Roy, J., Steriade, M., 1982. Thalamic bursting mechanism: an inward slow current revealed by membrane hyperpolarization. Brain Res., 239, 289–293.
- Deuschl and Lücking, (1989) Deuschl, G., Lücking, C., 1989. Tremor and electrically elicited long-latency reflexes in early stages of Parkinson’s disease. In: Przuntek, H., Riederer, P. (Eds.), Early Diagnosis and Preventive Therapy of Parkinson’s Disease. Springer Verlag, Vienna, New York, pp. 103–110.
- Deuschl et al., (1996) Deuschl, G., Krack, P., Lauk, M., Timmer, J., 1996. Clinical neurophysiology of tremor. J. Clin. Neurophysiol., 13, 110–121.
- Deuschl et al., (1999) Deuschl, G., Wilms, H., Krack, P., Würker, M., Heiss, W.-D., 1999. Function of the cerebellum in parkinsonian rest tremor and Holmes’ tremor. Ann. Neurol., 46, 126–128.
- Deuschl et al., (2000) Deuschl, G., Raethjen, J., Baron, R., Lindemann, M., Wilms, H., Krack, P., 2000. The pathophysiology of parkinsonian tremor: a review. J. Neurol., 247 (Suppl. 5), V/33–V/48.
- Deuschl et al., (2001) Deuschl, G., Raethjen, J., Lindemann, M., Krack, P., 2001. The pathophysiology of tremor. Muscle & Nerve, 6, 716–735.
- Dorf and Bishop, (2001) Dorf, R.C., Bishop, R.H., 2001. Modern Control Systems, ninth ed. Prentice-Hall, Upper Saddle River, NJ.
- Doudet et al., (1990) Doudet, D., Gross, C., Arluison, M., Bioulac, B., 1990. Modifications of precentral cortex discharge and EMG activity in monkeys with MPTP-induced lesions of DA nigral neurons. Exp. Brain Res., 80, 177–188.
- Dubois et al., (1983) Dubois, B., Ruberg, M., Javoy-Agid, F., Ploska, A., Agid, Y., 1983. A subcortico-cortical cholinergic system is affected in Parkinson’s disease. Brain Res., 288, 213–218.
- Ehringer and Hornykiewicz, (1960) Ehringer, H., Hornykiewicz, O., 1960. Verteilung von Noradrenalin und Dopamin (3-Hydroxytyramin) im Gehirn des Menschen und ihr Verhalten bei Erkrankungen des extrapyramidalen Systems. Klin. Wschr., 38, 1236–1239.
- Elble, (1996) Elble, R.J., 1996. Central mechanisms of tremor. J. Clin. Neurophysiol., 13, 133–144.
- Elble, (2002) Elble, R.J., 2002. Motor control and movement disorders. In: Jankovic, J., Tolosa, E. (Eds.), Parkinson’s Disease and Movement Disorders. Lippincott Williams & Wilkins, Philadelphia, pp. 11–22.
- Farmer, (2002) Farmer, S., 2002. Neural rhythms in Parkinson’s disease. Brain, 125, 1175–1176.
- Filion and Tremblay, (1991) Filion, M., Tremblay, L., 1991. Abnormal spontaneous activity of globus pallidus neurons in monkeys with MPTP-induced parkinsonism. Brain Res., 547, 142–151.
- Filion et al., (1988) Filion, M., Tremblay, L., Bédard, P., 1988. Abnormal influences of passive limb movement on the activity of globus pallidus neurons in parkinsonian monkeys. Brain Res., 444, 165–176.
- Floran et al., (1997) Floran, B., Floran, L., Sierra, A., Aceves, J., 1997. D2 receptor-mediated inhibition of GABA release by endogenous dopamine in the rat globus pallidus. Neurosci. Lett., 237, 1–4.
- Fogelson et al., (2005) Fogelson, N., Pogosyan, A., Kühn, A., Kupsch, A., Van Bruggen, G., Speelman, H., Tijssen, M., Quartarone, A., Insola, A., Mazzone, P., Di Lazzaro, V., Limousin, P., Brown, P., 2005. Reciprocal interactions between oscillatory activities of different frequencies in the subthalamic region of patients with Parkinson’s disease. Eur. J. Neurosci., 22, 257–266.
- Fogelson et al., (2006) Fogelson, N., Williams, D., Tijssen, M., van Bruggen, G., Speelman, H., Brown, P., 2006. Different functional loops between cerebral cortex and the subthalamic area in Parkinson’s disease. Cereb. Cortex, 16, 64–75.
- Freeman, (1975) Freeman, W. J., 1975. Mass Action in the Nervous System. Academic Press, New York.
- Fuhr et al., (1991) Fuhr, P., Agostino, R., Hallett, M., 1991. Spinal motor neuron excitability during the silent period after cortical stimulation. Electroencephalogr. Clin. Neurophysiol., 81, 257–262.
- Gagnon et al., (2004) Gagnon, J.-F., Fantini, M., Bédard, M.-A., Petit, D., Carrier, J., Rompré, S., Décary, A., Panisset, M., Montplaisir, J., 2004. Association between waking EEG slowing and REM sleep behavior disorder in PD without dementia. Neurology, 62, 401–406.
- Gandia et al., (1993) Gandia, J., De Las Heras, S., García, M., Giménez-Amaya, J., 1993. Afferent projections to the reticular thalamic nucleus from the globus pallidus and the substantia nigra in the rat. Brain Res. Bull., 32, 351–358.
- Gao and Goldman-Rakic, (2003) Gao, W.-J., Goldman-Rakic, P., 2003. Selective modulation of excitatory and inhibitory microcircuits by dopamine. Proc. Natl. Acad. Sci. USA, 100, 2836–2841.
- Gatev et al., (2006) Gatev, P., Darbin, O., Wichmann, T., 2006. Oscillations in the basal ganglia under normal conditions and in movement disorders. Mov. Disord., 21, 1566–1577.
- Georgopoulos et al., (1983) Georgopoulos, A., DeLong, M., Crutcher, M., 1983. Relations between parameters of step-tracking movements and single cell discharge in the globus pallidus and subthalamic nucleus of the behaving monkey. J. Neurosci., 3, 1586–1598.
- Gerfen et al., (1990) Gerfen, C., Engber, T., Mahan, L., Susel, Z., Chase, T., Monsma, F. J., Sibley, D., 1990. D1 and D2 dopamine receptor-regulated gene expression of striatonigral and striatopallidal neurons. Science, 250, 1429–1432.
- Gillies et al., (2002) Gillies, A., Willshaw, D., Li, Z., 2002. Subthalamic-pallidal interactions are critical in determining normal and abnormal functioning of the basal ganglia. Proc. R. Soc. Lond. B, 269, 545–551.
- Giuffrida et al., (1985) Giuffrida, R., Li Voisi, G., Maugeri, G., Perciavalle, V., 1985. Influences of pyramidal tract on the subthalamic nucleus in the cat. Neurosci. Lett., 54, 231–235.
- Goldberg et al., (2002) Goldberg, J., Boraud, T., Maraton, S., Haber, S., Vaadia, E., Bergman, H., 2002. Enhanced synchrony among primary motor cortex neurons in the 1-methyl-4-phenyl-1,2,3,6-tetrahydropyridine primate model of Parkinson’s disease. J. Neurosci., 22, 4639–4653.
- Goldberg et al., (2004) Goldberg, J., Rokni, U., Boraud, T., Vaadia, E., Bergman, H., 2004. Spike synchronization in the cortex-basal ganglia networks of parkinsonian primates reflects global dynamics of the local field potentials. J. Neurosci., 24, 6003–6010.
- Gonzalo et al., (2002) Gonzalo, N., Lanciego, J., Castle, M., Vázquez, A., Erro, E., Obeso, J., 2002. The parafascicular thalamic complex and basal ganglia circuitry: further complexity to the basal ganglia model. Thalamus Relat. Syst., 1, 341–348.
- Grammont and Riehle, (2003) Grammont, F., Riehle, A., 2003. Spike synchronization and firing rate in a population of motor cortical neurons in relation to movement direction and reaction time. Biol. Cybern., 88, 360–373.
- Graybiel, (1990) Graybiel, A., 1990. Neurotransmitters and neuromodulators in the basal ganglia. Trends Neurosci., 13, 244–254.
- Gross et al., (1997) Gross, C., Rougier, A., Guehl, D., Boraud, T., Julien, J., Bioulac, B., 1997. High-frequency stimulation of the globus pallidus internalis in Parkinson’s disease: a study of seven cases. J. Neurosurg., 87, 491–498.
- Gulledge and Jaffe, (2001) Gulledge, A., Jaffe, D., 2001. Multiple effects of dopamine on layer V pyramidal cell excitability in rat prefrontal cortex. J. Neurophysiol., 86, 586–595.
- Haber and Gdowski, (2004) Haber, S., Gdowski, M., 2004. The basal ganglia. In: Paxinos, G., Mai, J. (Eds.), The Human Nervous System. Elsevier, pp. 676–738.
- Hammond et al., (1983) Hammond, C., Rouzaire-Dubois, B., Féger, J., Jackson, A., Crossman, A., 1983. Anatomical and electrophysiological studies on the reciprocal projections between the subthalamic nucleus tegmenti pedunculopontinus in the rat. Neuroscience, 9, 41–52.
- Hammond et al., (2007) Hammond, C., Bergman, H., Brown, P., 2007. Pathological synchronization in Parkinson’s disease: networks, models and treatments. Trends Neurosci., 30, 357–364.
- Hartmann-von Monakow et al., (1978) Hartmann-von Monakow, K., Akert, K., Künzle, H., 1978. Projections of the precentral motor cortex and other cortical areas of the frontal lobe to the subthalamic nucleus in the monkey. Exp. Brain Res., 33, 395–403.
- Hassani et al., (1997) Hassani, O.-K., François, C., Yelnik, J., Féger, J., 1997. Evidence for a dopaminergic innervation of the subthalamic nucleus in the rat. Brain Res., 749, 88–94.
- Hazrati and Parent, (1991) Hazrati, L.-N., Parent, A., 1991. Projection from the external pallidum to the reticular thalamic nucleus in the squirrel monkey. Brain Res., 550, 142–146.
- Hazrati et al., (1990) Hazrati, L.-N., Parent, A., Mitchell, S., Haber, S., 1990. Evidence for interconnections between the two segments of the globus pallidus in primates: a PHA-L anterograde tracing study. Brain Res., 533, 171–175.
- Heimer et al., (2002) Heimer, G., Bar-Gad, I., Goldberg, J., Bergman, H., 2002. Dopamine replacement therapy reverses abnormal synchronization of pallidal neurons in the 1-methyl-4-phenyl-1,2,3,6-tetrahydropyridine primate model of parkinsonism. J. Neurosci., 22, 7850–7855.
- Hernández-López et al., (1997) Hernández-López, S., Bargas, J., Surmeier, D., Reyes, A., Galarraga, E., 1997. D1 receptor activation enhances discharge in neostriatal medium spiny neurons by modulating an L-type Ca2+ conductance. J. Neurosci., 17, 3334–3342.
- Hersch et al., (1995) Hersch, S., Ciliax, B., Gutekunst, C.-A., Rees, H., Heilman, C., Yung, K., Bolam, J., Ince, E., Yi, H., Levey, A., 1995. Electron microscopic analysis of D1 and D2 dopamine receptor proteins in the dorsal striatum and their synaptic relationships with motor corticostriatal afferents. J. Neurosci., 15, 5222–5237.
- Hirsch et al., (1988) Hirsch, E., Graybiel, A., Agid, Y., 1988. Melanized dopaminergic neurons are differentially susceptible to degeneration in Parkinson’s disease. Nature, 334, 345–348.
- Horak and Anderson, (1984) Horak, F., Anderson, M., 1984. Influence of globus pallidus on arm movements in monkeys.I. Effects of kainic acid-induced lesions. J. Neurophysiol., 52, 290–304.
- Hsu et al., (1995) Hsu, K.-S., Huang, C.-C., Yang, C.-H., Gean, P.-W., 1995. Presynaptic D2 dopaminergic receptors mediate inhibition of excitatory synaptic transmission in rat neostriatum. Brain Res., 690, 264–268.
- Humphries and Gurney, (2001) Humphries, M., Gurney, K., 2001. A pulsed neural network model of bursting in the basal ganglia. Neural Networks, 14, 845–863.
- Humphries et al., (2006) Humphries, M., Stewart, R., Gurney, K., 2006. A physiologically plausible model of action selection and oscillatory activity in the basal ganglia. J. Neurosci., 26, 12921–12942.
- Hurtado et al., (1999) Hurtado, J., Gray, C., Tamas, L., Sigvardt, K., 1999. Dynamics of tremor-related oscillations in the human globus pallidus: a single case study. Proc. Natl. Acad. Sci. USA, 96, 1674–1679.
- Hutchison et al., (1994) Hutchison, W., Lozano, A., Davis, K., Saint-Cyr, J., Lang, A., Dostrovsky, J., 1994. Differential neuronal activity in segments of globus pallidus in Parkinson’s disease patients. NeuroReport, 5, 1533–1537.
- Iacono et al., (1995) Iacono, R., Shima, F., Lonser, R., Kuniyoshi, S., Maeda, G., Yamada, S., 1995. The results, indications, and physiology of posteroventral pallidotomy for patients with Parkinson’s disease. Neurosurgery, 36, 1118–1127.
- Inase et al., (1997) Inase, M., Li, B.-M., Tanji, J., 1997. Dopaminergic modulation of neuronal activity in the monkey putamen through D1 and D2 receptors during a delayed Go/Nogo task. Exp. Brain Res., 117, 207–218.
- Jackson and Crossman, (1983) Jackson, A., Crossman, A., 1983. Nucleus tegmenti pedunculopontinus: efferent connections with special reference to the basal ganglia, studied in the rat by anterograde and retrograde transport of horseradish peroxidase. Neuroscience, 10, 725–765.
- Jeanmonod et al., (1996) Jeanmonod, D., Magnin, M., Morel, A., 1996. Low-threshold calcium spike bursts in the human thalamus. Brain, 119, 363–375.
- Jenkins et al., (1992) Jenkins, I., Fernandez, W., Playford, E., Lees, A., Frackowiak, R., Passingham, R., Brooks, D., 1992. Impaired activation of the supplementary motor area in Parkinson’s disease is reversed when akinesia is treated with apomorphine. Ann. Neurol., 32, 749–757.
- Jirsa and Haken, (1996) Jirsa, V. K., Haken, H., 1996. Field theory of electromagnetic brain activity. Phys. Rev. Lett., 77, 960–963.
- Jirsa and Haken, (1997) Jirsa, V.K., Haken, H., 1997. A derivation of a macroscopic field theory of the brain from the quasi-microscopic neural dynamics. Physica D, 99, 503–526.
- Kemp and Powell, (1971) Kemp, J., Powell, T., 1971. The structure of the caudate nucleus of the cat: light and electron microscopy. Philos. Trans. R. Soc. London B, 262, 383–401.
- Kim et al., (1976) Kim, R., Nakano, K., Jayaraman, A., Carpenter, M., 1976. Projections of the globus pallidus and adjacent structures: an autoradiographic study in the monkey. J. Comp. Neurol., 169, 263–290.
- Kish et al., (1999) Kish, L., Palmer, M., Gerhardt, G., 1999. Multiple single-unit recordings in the striatum of freely moving animals: effects of apomorphine and D-amphetamine in normal and unilateral 6-hydroxydopamine-lesioned rats. Brain Res., 833, 58–70.
- Kita, (1994) Kita, H., 1994. Parvalbumin-immunopositive neurons in rat globus pallidus: a light and electron microscopic study. Brain Res., 657, 31–41.
- Kita et al., (2004) Kita, H., Nambu, A., Kaneda, K., Tachibana, Y., Takada, M., 2004. Role of ionotropic glutamatergic and GABAergic inputs on the firing activity of neurons in the external pallidum in awake monkeys. J. Neurophysiol., 92, 3069–3084.
- Kiyatkin and Rebec, (1996) Kiyatkin, E., Rebec, G., 1996. Dopaminergic modulation of glutamate-induced excitations of neurons in the neostriatum and nucleus accumbens of awake, unrestrained rats. J. Neurophysiol., 75, 142–153.
- Kleine et al., (2001) Kleine, B., Praamstra, P., Stegeman, D., 2001. Impaired motor cortical inhibition in Parkinson’s disease: motor unit responses to transcranial magnetic stimulation. Exp. Brain Res., 138, 477–483.
- Koós and Tepper, (1999) Koós, T., Tepper, J., 1999. Inhibitory control of neostriatal projection neurons by GABAergic interneurons. Nat. Neurosci., 2, 467–472.
- Kreiss et al., (1997) Kreiss, D., Mastropietro, C., Rawji, S., Walters, J., 1997. The response of subthalamic nucleus neurons to dopamine receptor stimulation in a rodent model of Parkinson’s disease. J. Neurosci., 17, 6807–6819.
- Kühn et al., (2004) Kühn, A., Williams, D., Kupsch, A., Limousin, P., Hariz, M., Schneider, G.-H., Yarrow, K., Brown, P., 2004. Event-related beta desynchronization in human subthalamic nucleus correlates with motor performance. Brain, 127, 735–746.
- Kühn et al., (2005) Kühn, A. A., Trottenberg, T., Kivi, A., Kupsch, A., Schneider, G.-H., Brown, P., 2005. The relationship between local field potential and neuronal discharge in the subthalamic nucleus of patients with Parkinson’s disease. Exp. Neurol., 194, 212–220.
- Lamarre and Joffroy, (1979) Lamarre, Y., Joffroy, A., 1979. Experimental tremor in monkey: activity of thalamic and precentral cortical neurons in the absence of peripheral feedback. Adv. Neurol., 24, 109–122.
- Lapper and Bolam, (1992) Lapper, S., Bolam, J., 1992. Input from the frontal cortex and the parafscicular nucleus to cholinergic interneurons in the dorsal striatum of the rat. Neuroscience, 51, 533–545.
- Lavoie and Parent, (1994) Lavoie, B., Parent, A., 1994. Pedunculopontine nucleus in the squirrel monkey: projections to the basal ganglia as revealed by anterograde tract-tracing methods. J. Comp. Neurol., 344, 210–231.
- Leblois et al., (2006) Leblois, A., Boraud, T., Meissner, W., Bergman, H., Hansel, D., 2006. Competition between feedback loops underlies normal and pathological dynamics in the basal ganglia. J. Neurosci., 26, 3567–3583.
- Lee and Stein, (1981) Lee, R., Stein, R., 1981. Resetting of tremor by mechanical perturbations: a comparison of essential tremor and parkinsonian tremor. Ann. Neurol., 10, 523–531.
- Lee et al., (2001) Lee, J.-I., Shin, H., Nam, D.-H., Kim, J.-S., Hong, S.-C., Shin, H., Park, K., Eoh, W., Kim, J., Lee, W., 2001. Increased burst firing in substantia nigra pars reticulata neurons and enhanced response to selective D2 agonst in hemiparkinsonian rats after repeated administration of apomorphine. J. Korean Med. Sci., 16, 636–542.
- Le Moine and Bloch, (1995) Le Moine, C., Bloch, B., 1995. D1 and D2 dopamine receptor gene expression in the rat striatum: sensitive cRNA probes demonstrate prominent segregation of D1 and D2 mRNAs in distinct neuronal populations of the dorsal and ventral striatum. J. Comp. Neurol., 355, 418–426.
- Lemstra et al., (1999) Lemstra, A., Verhagen Metman, L., Lee, J., Dougherty, P., Lenz, F., 1999. Tremor-frequency (3–6 Hz) activity in the sensorimotor arm representation of the internal segment of the globus pallidus in patients with Parkinson’s disease. Neurosci. Lett., 267, 129–132.
- Lenz et al., (1988) Lenz, F., Tasker, R., Kwan, H., Schnider, S., Kwong, R., Murayama, Y., Dostrovsky, J., Murphy, J., 1988. Single unit analysis of the human ventral thalamic nuclear group: correlation of thalamic ”tremor cells” with the 3–6 Hz component of parkinsonian tremor. J. Neurosci., 8, 754–764.
- Lenz et al., (1993) Lenz, F., Vitek, J., DeLong, M., 1993. Role of the thalamus in parkinsonian tremor: evidence from studies in patients and primate models. Stereotact. Funct. Neurosurg., 60, 94–103.
- Lenz et al., (1994) Lenz, F., Kwan, H., Martin, R., Tasker, R., Dostrovsky, J., Lenz, Y., 1994. Single unit analysis of the human ventral thalamic nuclear group: tremor-related activity in functionally identified cells. Brain, 117, 531–543.
- Lester et al., (1993) Lester, J., Fink, S., Aronin, N., DiFiglia, M., 1993. Colocalization of D1 and D2 dopamine receptor mRNAs in striatal neurons. Brain Res., 621, 106–110.
- Levine et al., (1996) Levine, M., Li, Z., Cepeda, C., Cromwell, H., Altemus, K., 1996. Neuromodulatory actions of dopamine on synaptically-evoked neostriatal responses in slices. Synapse, 24, 65–78.
- Levy et al., (2000) Levy, R., Hutchison, D., Lozano, A., Dostrovsky, J., 2000. High-frequency synchronization of neuronal activity in the subthalamic nucleus of parkinsonian patients with limb tremor. J. Neurosci., 20, 7766–7775.
- Levy et al., (2001) Levy, R., Dostrovsky, J., Lang, A., Sime, E., Hutchison, W., Lozano, A., 2001. Effects of apomorphine on subthalamic nucleus and globus pallidus internus neurons in patients with Parkinson’s disease. J. Neurophysiol., 86, 249–260.
- Levy et al., (2002) Levy, R., Hutchison, W., Lozano, A., Dostrovsky, J., 2002. Synchronized neuronal discharge in the basal ganglia of parkinsonian patients is limited to oscillatory activity. J. Neurosci., 22, 2855–2861.
- Limousin et al., (1998) Limousin, P., Krack, P., Pollak, P., Benazzouz, A., Ardouin, C., Hoffmann, D., Benabid, A.-L., 1998. Electrical stimulation of the subthalamic nucleus in advanced Parkinson’s disease. New England J. Med., 339, 1105–1111.
- Llinás, (1984) Llinás, R., 1984. Rebound excitation as the basis for tremor. In: Findley, L., Capildeo, R. (Eds.), Movement Disorders: Tremor, MacMillan, London and Basingstoke, pp. 165–182.
- Llinás and Jahnsen, (1982) Llinás, R., Jahnsen, H., 1982. Electrophysiology of mammalian thalamic neurones in vitro. Nature, 297, 406–408.
- Llinás and Steriade, (2006) Llinás, R., Steriade, M., 2006. Bursting of thalamic neurons and states of vigilance. J. Neurophysiol., 95, 3297–3308.
- Llinás et al., (2005) Llinás, R., Urbano, F., Leznik, E., Ramírez, R., van Marle, H., 2005. Rhythmic and dysrhythmic thalamocortical dynamics: GABA systems and the edge effect. Trend Neurosci., 28, 325–333.
- Longo, (1966) Longo, V., 1966. Behavioral and electroencephalographic effects of atropine and related compounds. Pharmacol. Rev., 18, 965–996.
- Magill et al., (2000) Magill, P.J., Bolam, J.P., Bevan, M.D., 2000. Relationship of activity in the subthalamic nucleus-globus pallidus network to cortical electroencephalogram. J. Neurosci., 20, 820–833.
- Magill et al., (2001) Magill, P.J., Bolam, J.P., Bevan, M.D., 2001. Dopamine regulates the impact of the cerebral cortex on the subthalamic nucleus-globus pallidus network. Neuroscience, 106, 313–330.
- Magnin et al., (2000) Magnin, M., Morel, A., Jeanmonod, D., 2000. Single-unit analysis of the pallidum, thalamus and subthalamic nucleus in parkinsonian patients. Neuroscience, 96, 549–564.
- Mahon et al., (2001) Mahon, S., Deniau, J.-M., Charpier, S., 2001. Relationship between EEG potentials and intracellular activity of striatal and cortico-striatal neurons: an in vivo study under different anesthetics. Cereb. Cortex, 11, 360–373.
- Mallet et al., (2006) Mallet, N., Ballion, B., Le Moine, C., Gonon, F., 2006. Cortical inputs and GABA interneurons imbalance projection neurons in the striatum of parkinsonian rats. J. Neurosci., 26, 3884–3875.
- Marsden et al., (2001) Marsden, J., Limousin-Dowsey, P., Ashby, P., Pollak, P., Brown, P., 2001. Subthalamic nucleus, sensorimotor cortex and muscle interrelationships in Parkinson’s disease. Brain, 124, 378–388.
- Mattay et al., (2002) Mattay, V., Tessitore, A., Callicott, J., Bertolino, A., Goldberg, T., Chase, T., Hyde, T., Weinberger, D., 2002. Dopaminergic modulation of cortical function in patients with Parkinson’s disease. Ann. Neurol., 51, 156–164.
- Meador-Woodruff et al., (1991) Meador-Woodruff, J., Mansour, A., Healy, D., Kuehn, R., Zhou, Q., Bunzow, J., Akil, H., Civelli, O., Watson, S. J., 1991. Comparison of the distributions of D1 and D2 dopamine receptor mRNAs in rat brain. Neuropsychopharmacology, 5, 231–242.
- Meissner et al., (2005) Meissner, W., Leblois, A., Hansel, D., Bioulac, B., Gross, C., Benazzouz, A., Boraud, T., 2005. Subthalamic high frequency stimulation resets subthalamic firing and reduces abnormal oscillations. Brain, 128, 2372–2382.
- Metherate et al., (1992) Metherate, R., Cox, C., Ashe, J., 1992. Cellular bases of neocortical activation: modulation of neural oscillations by the nucleus basalis and endogenous acetylcholine. J. Neurosci., 12, 4701–4711.
- Mink, (1996) Mink, J., 1996. The basal ganglia: focused selection and inhibition of competing motor programs. Prog. Neurobiol., 50, 381–425.
- Mitchell et al., (1987) Mitchell, S., Richardson, R., Baker, F., DeLong, M., 1987. The primate globus pallidus: neuronal activity related to direction of movement. Exp. Brain Res., 68, 491–505.
- Moazami-Goudarzi et al., (2008) Moazami-Goudarzi, M., Sarnthein, J., Michels, L., Moukhtieva, R., Jeanmonod, D., 2008. Enhanced frontal low and high frequency power and synchronization in the resting EEG of parkinsonian patients. NeuroImage, 41, 985–997.
- Monchi et al., (2004) Monchi, O., Petrides, M., Doyon, J., Postuma, R., Worsley, K., Dagher, A., 2004. Neural bases of set-shifting deficits in Parkinson’s disease. J. Neurosci., 24, 702–710.
- Monchi et al., (2007) Monchi, O., Petrides, M., Mejia-Constain, B., Strafella, A., 2007. Cortical activity in Parkinson’s disease during executive processing depends on striatal involvement. Brain, 130, 233–244.
- Morris et al., (2005) Morris, G., Hershkovitz, Y., Raz, A., Nevet, A., Bergman, H., 2005. Physiological studies of information processing in the normal and Parkinsonian basal ganglia: pallidal activity in Go/No-Go task and following MPTP treatment. Prog. Brain Res., 147, 285–293.
- Mouroux et al., (1995) Mouroux, M., Hassani, O., Feger, J., 1995. Electrophysiological study of the excitatory parafascicular projection to the subthalamic nucleus and evidence for ipsilateral and contralateral controls. Neuroscience, 67, 399–407.
- Munro-Davies et al., (1999) Munro-Davies, L., Winter, J., Aziz, T., 1999. The role of the pedunculopontine region in basal-ganglia mechanisms of akinesia. Exp. Brain Res., 129, 511–517.
- Murer et al., (2002) Murer, M., Tseng, K., Kasanetz, F., Belluscio, M., Riquelme, L., 2002. Brain oscillations, medium spiny neurons, and dopamine. Cell. Mol. Neurobiol., 22, 611–632.
- Nambu and Llinás, (1994) Nambu, A., Llinás, R., 1994. Electrophysiology of globus pallidus neurons in vitro. J. Neurophysiol., 72, 1127–1139.
- Nambu and Llinás, (1997) Nambu, A., Llinás, R., 1997. Morphology of globus pallidus neurons: its correlation with electrophysiology in guinea pig brain slices. J. Comp. Neurol., 377, 85–94.
- Nambu et al., (2000) Nambu, A., Tokuno, H., Hamada, I., Kita, H., Imanishi, M., Akazawa, T., Ikeuchi, Y., Hasegawa, N., 2000. Excitatory cortical inputs to pallidal neurons via the subthalamic nucleus in the monkey. J. Neurophysiol., 84, 289–300.
- Nambu et al., (2002) Nambu, A., Tokuno, H., Takada, M., 2002. Functional significance of the cortico-subthalamo-pallidal ‘hyperdirect’ pathway. Neurosci. Res., 43, 111–117.
- Neufeld et al., (1994) Neufeld, M., Blumen, S., Aitkin, I., Parmet, Y., Korczyn, A., 1994. EEG frequency analysis in demented and nondemented parkinsonian patients. Dementia, 5, 23–28.
- Ni et al., (2000) Ni, Z.-G., Bouali-Benazzouz, R., Gao, D.-M., Benabid, A.-L., Benazzouz, A., 2000. Changes in the firing patterns of globus pallidus neurons after the degeneration of nigrostriatal pathway are mediated by the subthalamic nucleus in the rat. Eur. J. Neurosci., 12, 4338–4344.
- Nicola et al., (2000) Nicola, S., Surmeier, D., Malenka, R., 2000. Dopaminergic modulation of neuronal excitability in the striatum and nucleus accumbens. Ann. Rev. Neurosci., 23, 185–215.
- Nicola et al., (2004) Nicola, S., Hopf, F., Hjelmstad, G., 2004. Contrast enhancement: a physiological effect of striatal dopamine? Cell Tissue Res., 318, 93–106.
- Nini et al., (1995) Nini, A., Feingold, A., Slovin, H., Bergman, H., 1995. Neurons in the globus pallidus do not show correlated activity in the normal monkey, but phase-locked oscillations appear in the MPTP model of parkinsonism. J. Neurophysiol., 74, 1800–1805.
- Nunez, (1974) Nunez, P., 1974. Wave-like properties of the alpha rhythm. IEEE Trans. Biomed. Eng., 21, 473–482.
- Nunez, (1995) Nunez, P., 1995. Neocortical Dynamics and Human EEG Rhythms. Oxford University Press, Oxford.
- O’Donnell, (2003) O’Donnell, P., 2003. Dopamine gating of forebrain neural ensembles. Eur. J. Neurosci., 17, 429–435.
- Ogura and Kita, (2000) Ogura, M., Kita, H., 2000. Dynorphin exerts both postsynaptic and presynaptic effects in the globus pallidus of the rat. J. Neurophysiol., 83, 3366–3376.
- Ohye et al., (1974) Ohye, C., Saito, Y., Fukamachi, A., Narabayashi, H., 1974. An analysis of the spontaneous rhythmic and non-rhythmic burst discharges in the human thalamus. J. Neurol. Sci., 22, 245–259.
- Ohye et al., (1989) Ohye, C., Shibazaki, T., Hirai, T., Wada, H., Hirato, M., Kawashima, Y., 1989. Further physiological observations on the ventralis intermedius neurons in the human thalamus. J. Neurophysiol., 61, 488–500.
- Okun and Vitek, (2004) Okun, M., Vitek, J., 2004. Lesion therapy for Parkinson’s disease and other movement disorders: update and controversies. Mov. Disord., 19, 375–389.
- Orieux et al., (2000) Orieux, G., François, C., Féger, J., Yelnik, J., Vila, M., Ruberg, M., Agid, Y., Hirsch, E., 2000. Metabolic activity of excitatory parafascicular and pedunculopontine inputs to the subthalamic nucleus in a rat model of Parkinson’s disease. Neuroscience, 97, 79–88.
- Pahapill and Lozano, (2000) Pahapill, P., Lozano, A., 2000. The pedunculopontine nucleus and Parkinson’s disease. Brain, 123, 1767–1783.
- Pan and Walters, (1988) Pan, H., Walters, J., 1988. Unilateral lesion of the nigrostriatal pathway decreases the firing rate and alters the firing pattern of globus pallidus neurons in the rat. Synapse, 2, 650–656.
- Paré et al., (1990) Paré, D., Curro’Dossi, R., Steriade, M., 1990. Neuronal basis of the parkinsonian resting tremor: a hypothesis and its implications for treatment. Neuroscience, 35, 217–226.
- Parent, (1990) Parent, A., 1990. Extrinsic connections of the basal ganglia. Trends Neurosci., 13, 254–258.
- (176) Parent, A., Hazrati, L.-N., 1995a. Functional anatomy of the basal ganglia. I. The cortico-basal ganglia-thalamo-cortical loop. Brain. Res. Rev., 20, 91–127.
- (177) Parent, A., Hazrati, L.-N., 1995b. Functional anatomy of the basal ganglia. II. The place of subthalamic nucleus and external pallidum in basal ganglia circuitry. Brain. Res. Rev., 20, 128–154.
- Parent et al., (2001) Parent, M., Levesque, M., Parent, A., 2001. Two types of projection neurons in the internal pallidum of primates: single-axon tracing and three-dimensional reconstruction. J. Comp. Neurol., 439, 162–175.
- Parkinson, (1817) Parkinson, J., 1817. An Essay on the Shaking Palsy. Sherwood, Neely, and Jones, London.
- Playford et al., (1992) Playford, E., Jenkins, I., Passingham, R., Nutt, J., Frackowiak, R., and Brooks, D., 1992. Impaired mesial frontal and putamen activation in Parkinson’s disease: a positron emission tomography study. Ann. Neurol., 32, 151–161.
- Plenz, (2003) Plenz, D., 2003. When inhibition goes incognito: feedback interaction between spiny projection neurons in striatal function. Trends Neurosci., 26, 436–443.
- Plenz and Kital, (1999) Plenz, D., Kital, S., 1999. A basal ganglia pacemaker formed by the subthalamic nucleus and external globus pallidus. Nature, 400, 677–682.
- Priori et al., (1994) Priori, A., Berardelli, A., Inghilleri, M., Accornero, N., Manfredi, M., 1994. Motor cortical inhibition and the dopaminergic system: pharmacological changes in the silent period after transcranial brain stimulation in normal subjects, patients with Parkinson’s disease and drug-induced parkinsonism. Brain, 117, 317–323.
- Querejeta et al., (2001) Querejeta, E., Delgado, A., Valdiosera, R., Erlij, D., Aceves, J., 2001. Intrapallidal D2 dopamine receptors control globus pallidus neurons activity in the rat. Neurosci. Lett., 300, 79–82.
- Rack and Ross, (1986) Rack, P., Ross, H., 1986. The role of reflexes in the resting tremor of Parkinson’s disease. Brain, 109, 115–141.
- Ray, (1990) Ray, W., 1990. The electrocortical system. In: Cacioppo, J., Tassinary, L. (Eds.), Principles of Psychophysiology, Cambridge University Press, Cambridge, pp. 385–412.
- Raz et al., (1996) Raz, A., Feingold, A., Zelanskaya, V., Vaadia, E., Bergman, H., 1996. Neuronal synchronization of tonically active neurons in the striatum of normal and parkinsonian primates. J. Neurophysiol., 76, 2083–2088.
- Raz et al., (2000) Raz, A., Vaadia, E., Bergman, H., 2000. Firing patterns and correlations of spontaneous discharge of pallidal neurons in the normal and the tremulous 1-methyl-4-phenyl-1,2,3,6-tetrahydropyridine vervet model of parkinsonism. J. Neurosci., 20, 8559–8571.
- Raz et al., (2001) Raz, A., Frechter-Mazar, V., Feingold, A., Abeles, M., Vaadia, E., Bergman, H., 2001. Activity of pallidal and striatal tonically active neurons is correlated in MPTP-treated monkeys but not in normal monkeys. J. Neurosci., 21, RC128(1–5).
- Remy et al., (1995) Remy, P., de Recondo, A., Defer, G., Loc’h, C., Amarenco, P., Planté-Bordeneuve, V., Dao-Castellana, M.-H., Bendriem, B., Crouzel, C., Clanet, M., Rondot, P., Samson, Y., 1995. Peduncular ‘rubral’ tremor and dopaminergic devervation: A PET study. Neurology, 45, 472–477.
- Rennie et al., (1999) Rennie, C. J., Robinson, P. A., Wright, J. J., 1999. Effects of local feedback on dispersion of electrical waves in the cerebral cortex. Phys. Rev. E, 59, 3320–3329.
- Rennie et al., (2000) Rennie, C., Wright, J., Robinson, P., 2000. Mechanisms of cortical electrical activity and emergence of gamma rhythm. J. Theor. Biol., 205, 17–35.
- Rivlin-Etzion et al., (2006) Rivlin-Etzion, M., Marmor, O., Heimer, G., Raz, A., Nini, A., Bergman, H., 2006. Basal ganglia oscillations and pathophysiology of movement disorders. Curr. Opin. Neurobiol., 16, 629–637.
- Rivlin-Etzion et al., (2008) Rivlin-Etzion, M., Marmor, O., Saban, G., Rosin, B., Haber, S., Vaadia, E., Prut, Y., Bergman, H., 2008. Low-pass filter properties of basal ganglia-cortical-muscle loops in the normal and MPTP primate model of parkinsonism. J. Neurosci., 28, 633–649.
- Robinson, (2003) Robinson, P. A., 2003. Neurophysical theory of coherence and correlations of electroencephalographic signals. J. Theor. Biol., 222, 163–175.
- Robinson, (2005) Robinson, P. A., 2005. Propagator theory of brain dynamics. Phys. Rev. E, 72, 011904.1–011904.13.
- Robinson et al., (1997) Robinson, P. A., Rennie, C. J., Wright, J. J., 1997. Propagation and stability of waves of electrical activity in the cerebral cortex. Phys. Rev. E, 56, 826–840.
- (198) Robinson, P. A., Rennie, C. J., Wright, J. J., Bourke, P. D., 1998a. Steady states and global dynamics of electrical activity in the cerebral cortex. Phys. Rev. E, 58, 3357–3571.
- (199) Robinson, P. A., Wright, J. J., Rennie, C. J., 1998b. Synchronous oscillations in the cerebral cortex. Phys. Rev. E, 57, 4578–4588.
- (200) Robinson, P. A., Loxley, P. N., O’Connor, S. C., Rennie, C. J., 2001a. Modal analysis of corticothalamic dynamics, electroencephalographic spectra, and evoked potentials. Phys. Rev. E, 63, 041909.1–041909.13.
- (201) Robinson, P. A., Rennie, C. J., Wright, J. J., Bahramali, H., Gordon, E., Rowe, D. L., 2001b. Prediction of electroencephalographic spectra from neurophysiology. Phys. Rev. E, 63, 021903.1–021903.18.
- Robinson et al., (2002) Robinson, P. A., Rennie, C. J., Rowe, D. L., 2002. Dynamics of large-scale brain activity in normal arousal states and epileptic seizures. Phys. Rev. E, 65, 041924.1–041924.9.
- Robinson et al., (2004) Robinson, P., Rennie, C., Rowe, D., O’Connor, S., 2004. Estimation of multiscale neurophysiologic parameters by electroencephalographic means. Hum. Brain Mapp., 23, 53–72.
- Robinson et al., (2005) Robinson, P. A., Rennie, C. J., Rowe, D. L., O’Connor, S. C., Gordon, E., 2005. Multiscale brain modelling. Philos. Trans. R. Soc. B, 360, 1043–1050.
- Rodriguez-Oroz et al., (2001) Rodriguez-Oroz, M., Rodriguez, M., Guridi, J., Mewes, K., Chockkman, V., Vitek, J., DeLong, M., Obeso, J., 2001. The subthalamic nucleus in Parkinson’s disease: somatotopic organization and physiological characteristics. Brain, 124, 1777–1790.
- Sabatini et al., (2000) Sabatini, U., Boulanouar, K., Fabre, N., Martin, F., Carel, C., Colonnese, C., Bozzao, L., Berry, I., Montastruc, J., Chollet, F., Rascol, O., 2000. Cortical motor reorganization in akinetic patients with Parkinson’s disease. Brain, 123, 394–403.
- Sadikot et al., (1990) Sadikot, A., Parent, A., François, C., 1990. The centre médian and parafascicular thalamic nuclei project respectively to the sensorimotor and associative-limbic striatal territories in the squirrel monkey. Brain Res., 510, 161–165.
- Sadikot et al., (1992) Sadikot, A., Parent, A., Smith, Y., Bolam, J., 1992. Efferent connections of the centromedian and parafascicular thalamic nuclei in the squirrel monkey: a light and election microscopic study of the thalamostriatal projection in relations to striatal heterogeneity. J. Comp. Neurol., 320, 228–242.
- Samuel et al., (1997) Samuel, M., Ceballos-Baumann, A., Blin, J., Uema, T., Boecker, H., Passingham, R., Brooks, D., 1997. Evidence for lateral premotor and parietal overactivity in Parkinson’s disease during sequential and bimanual movements. Brain, 120, 963–976.
- Sarnthein and Jeanmonod, (2007) Sarnthein, J., Jeanmonod, D., 2007. High thalamocortical theta coherence in patients with Parkinson’s disease. J. Neurosci., 27, 124–131.
- Sato et al., (2000) Sato, F., Lavallée, P., Lévesque, M., Parent, A., 2000. Single-axon tracing study of neurons of the external segment of the globus pallidus in primate. J. Comp. Neurol., 417, 17–31.
- Schiff et al., (2007) Schiff, S.J., Huang, X., Wu, J.-Y., 2007. Dynamical evolution of spatiotemporal patterns in mammalian middle cortex. Phys. Rev. Lett., 98, 178102.1–178102.4.
- Schneidman et al., (2006) Schneidman, E., Berry II, M., Segev, R., Bialek, W., 2006. Weak pairwise correlations imply strongly correlated network states in a neural population. Nature, 440, 1007–1012.
- Sharott et al., (2005) Sharott, A., Magill, P., Harnack, D., Kupsch, A., Meissner, W., Brown, P., 2005. Dopamine depletion increases the power and coherence of -oscillations in the cerebral cortex and subthalamic nucleus of the awake rat. Eur. J. Neurosci., 21, 1413–1422.
- Shink and Smith, (1995) Shink, E., Smith, Y., 1995. Differential synaptic innervation of neurons in the internal and external segments of the globus pallidus by the GABA- and glutamate-containing terminals in the squirrel monkey. J. Comp. Neurol., 358, 119–141.
- Silberstein et al., (2003) Silberstein, P., Kühn, A., Kupsch, A., Trottenberg, T., Krauss, J., Wöhrle, J., Mazzone, P., Insola, A., Di Lazzaro, V., Oliviero, A., Aziz, T., Brown, P., 2003. Patterning of globus pallidus local field potentials differs between Parkinson’s disease and dystonia. Brain, 126, 2597–2608.
- Sinanović et al., (2005) Sinanović, O., Kapidzić, A., Kovacević, L., Hudić, J., Smajlović, D., 2005. EEG frequency and cognitive dysfunction in patients with Parkinson’s disease. Med. Arh., 59, 286–287.
- Smith et al., (1994) Smith, Y., Wichmann, T., DeLong, M., 1994. Synaptic innervation of neurones in the internal pallidal segment by the subthalamic nucleus and the external pallidum in monkeys. J. Comp. Neurol., 343, 297–318.
- Soares et al., (2004) Soares, J., Kliem, M., Betarbet, R., Greenamyre, J., Yamamoto, B., Wichmann, T., 2004. Role of external pallidal segment in primate parkinsonism: comparison of the effects of 1-methyl-4-phenyl-1,2,3,6-tetrahydropyridine-induced parkinsonism and lesions of the external pallidal segment. J. Neurosci., 24, 6417–6426.
- Soikkeli et al., (1991) Soikkeli, R., Partanen, J., Soininen, H., Pääkkönen, A., Riekkinen Sr., P., 1991. Slowing of EEG in Parkinson’s disease. Electroencephalogr. Clin. Neurophysiol., 79, 159–165.
- Somogyi et al., (1981) Somogyi, P., Bolam, J., Smith, A., 1981. Monosynaptic cortical input and local axon collaterals of identified striatonigral neurons. A light and electron microscopic study using the Golgi-peroxidase transport-degeneration procedure. J. Comp. Neurol., 195, 567–584.
- Stanford and Cooper, (1999) Stanford, I., Cooper, A., 1999. Presynaptic and opioid receptor modulation of GABAa ipscs in the rat globus pallidus in vitro. J. Neurosci., 19, 4796–4803.
- Steiner and Gerfen, (1998) Steiner, H., Gerfen, C., 1998. Role of dynorphin and enkephalin in the regulation of striatal output pathways and behavior. Exp. Brain Res., 123, 60–76.
- Stoffers et al., (2007) Stoffers, D., Bosboom, J., Deijen, J., Wolters, E., Berendse, H., Stam, C., 2007. Slowing of oscillatory brain activity is a stable characteristic of Parkinson’s disease without dementia. Brain, 130, 1847–1860.
- Tanaka et al., (2000) Tanaka, H., Koenig, T., Pascual-Marqui, R., Hirata, K., Kochi, K., Lehmann, D., 2000. Event-related potential and EEG measures in Parkinson’s disease without and with dementia. Dement. Geriatr. Cogn. Disord., 11, 39–45.
- Tanner and Goldman, (1996) Tanner, C., Goldman, S., 1996. Epidemiology of Parkinson’s disease. Neurol. Clin., 14, 317–335.
- Taverna et al., (2004) Taverna, S., van Dongen, Y., Groenewegen, H., Pennartz, C., 2004. Direct physiological evidence for synaptic connectivity between medium-sized spiny neurons in rat nucleus accumbens in situ. J. Neurophysiol., 91, 1111–1121.
- Terman et al., (2002) Terman, D., Rubin, J., Yew, A., Wilson, C., 2002. Activity patterns in a model for the subthalamopallidal network of the basal ganglia. J. Neurosci., 22, 2963–2976.
- Thach, (1978) Thach, W.T., 1978. Correlation of neural discharge with pattern and force of muscular activity, joint position, and direction of intended next movement in motor cortex and cerebellum. J. Neurophysiol., 41, 654–676.
- Thurley et al., (2008) Thurley, K., Senn, W., Lüscher, H.-R., 2008. Dopamine increases the gain of the input-output response of rat prefrontal pyramidal neurons. J. Neurophysiol., 99, 2985–2997.
- Timmermann et al., (2003) Timmermann, L., Gross, J., Dirks, M., Volkmann, J., Freund, H.-J., Schitzler, A., 2003. The cerebral oscillatory network of parkinsonian resting tremor. Brain, 126, 199–212.
- Toan and Schultz, (1985) Toan, D., Schultz, W., 1985. Responses of rat pallidum cells to cortex stimulation and effects of altered dopaminergic activity. Neuroscience, 15, 683–694.
- Topka et al., (1999) Topka, H., Mescheriakov, S., Boose, A., Kuntz, R., Hertrich, I., Seydel, L., Dichgans, J., Rothwell, J., 1999. A cerebellar-like terminal and postural tremor induced in normal man by transcranial magnetic stimulation. Brain, 122, 1551–1562.
- Tremblay et al., (1989) Tremblay, L., Filion, M., Bédard, P., 1989. Responses of pallidal neurons to striatal stimulation in monkeys with MPTP-induced parkinsonism. Brain Res., 498, 17–33.
- Trottenberg et al., (2006) Trottenberg, T., Fogelson, N., Kühn, A., Kivi, A., Kupsch, A., Schneider, G.-H., Brown, P., 2006. Subthalamic gamma activity in patients with Parkinson’s disease. Exp. Neurol., 200, 56–65.
- Tseng et al., (2000) Tseng, K., Riquelme, L., Belforte, J., Pazo, J., Murer, M., 2000. Substantia nigra pars reticulata units in 6-hydroxydopamine-lesioned rats: responses to striatal D2 dopamine receptor stimulation and subthalamic lesions. Eur. J. Neurosci., 12, 247–256.
- Tseng et al., (2001) Tseng, K., Kasanetz, F., Kargieman, L., Riquelme, L., Murer, M., 2001. Cortical slow oscillatory activity is reflected in the membrane potential and spike trains of striatal neurons in rats with chronic nigrostriatal lesions. J. Neurosci., 21, 6430–6439.
- Turner and Anderson, (1997) Turner, R., Anderson, M., 1997. Pallidal discharge related to the kinematics of reaching movements in two dimensions. J. Neurophysiol., 77, 1051–1074.
- Uhl et al., (1985) Uhl, G., Hedreen, J., Price, D., 1985. Loss of neurons from the ventral tegmental area contralateral to therapeutic surgical lesions. Neurology, 35, 1215–1218.
- Umemiya and Raymond, (1997) Umemiya, M., Raymond, L., 1997. Dopaminergic modulation of excitatory postsynaptic currents in rat neostriatal neurons. J. Neurophysiol., 78, 1248–1255.
- Urbain et al., (2002) Urbain, N., Rentéro, N., Gervasoni, D., Renaud, B., Chouvet, G., 2002. The switch of subthalamic neurons from an irregular to a bursting patterns does not solely depend on their GABAergic inputs in the anesthetic-free rat. J. Neurosci., 22, 8665–8675.
- Van Albada and Robinson, (2009) Van Albada, S.J., Robinson, P. Mean-field modeling of the basal ganglia-thalamocortical system. I. Firing rates in healthy and parkinsonian states. J. Theor. Biol. 257, 642–663.
- Vélez et al., (2002) Vélez, M., Cosentino, C., Torres, L., 2002. Levodopa-responsive rubral (Holmes’) tremor. Mov. Disord., 17, 741–742.
- Volkmann et al., (1996) Volkmann, J., Joliot, M., Mogilner, A., Ioannides, A., Lado, F., Fazzini, E., Ribary, U., Llinás, R., 1996. Central motor loop oscillations in parkinsonian resting tremor revealed by magnetoencephalography. Neurology, 46, 1359–1370.
- Walters et al., (2007) Walters, J., Hu, D., Itoga, C., Parr-Brownlie, L., Bergstrom, D., 2007. Phase relationships support a role for coordinated activity in the indirect pathway in organizing slow oscillations in basal ganglia output after loss of dopamine. Neuroscience, 144, 762–776.
- Wang et al., (2005) Wang, S.-Y., Aziz, T., Stein, J., Liu, X., 2005. Time-frequency analysis of transient neuromuscular events: dynamic changes in activity of the subthalamic nucleus and forearm muscles related to the intermittent resting tremor. J. Neurosci. Meth., 145, 151–158.
- Weinberger et al., (2006) Weinberger, M., Mahant, N., Hutchison, W., Lozano, A., Moro, E., Hodaie, M., Lang, A., Dostrovsky, J., 2006. Beta oscillatory activity in the subthalamic nucleus and its relation to dopaminergic response in Parkinson’s disease. J. Neurophysiol., 96, 3248–3256.
- Wichmann and DeLong, (2003) Wichmann, T., DeLong, M., 2003. Pathophysiology of Parkinson’s disease: the MPTP primate model of the human disorder. Ann. N.Y. Acad. Sci., 991, 199–213.
- Wichmann and Soares, (2006) Wichmann, T., Soares, J., 2006. Neuronal firing before and after burst discharges in the monkey basal ganglia is predictably patterned in the normal state and altered in parkinsonism. J. Neurophysiol., 95, 2120–2133.
- (250) Wichmann, T., Bergman, H., DeLong, M., 1994a. The primate subthalamic nucleus. I. Functional properties in intact animals. J. Neurophysiol., 72, 494–506.
- (251) Wichmann, T., Bergman, H., DeLong, M., 1994b. The primate subthalamic nucleus. III. Changes in motor behavior and neuronal activity in the internal pallidum induced by subthalamic inactivation in the MPTP model of parkinsonism. J. Neurophysiol., 72, 521–530.
- Wichmann et al., (1999) Wichmann, T., Bergman, H., Starr, P., Subramanian, T., Watts, R., DeLong, M., 1999. Comparison of MPTP-induced changes in spontaneous neuronal discharge in the internal pallidal segment and in the substantia nigra pars reticulata in primates. Exp. Brain Res., 125, 397–409.
- Williams et al., (2002) Williams, D., Tijssen, M., van Bruggen, G., Bosch, A., Insola, A., Di Lazzaro, V., Mazzone, P., Oliviero, A., Quartarone, A., Speelman, D., Brown, P., 2002. Dopamine-dependent changes in the functional connectivity between basal ganglia and cerebral cortex in humans. Brain, 125, 1558–1569.
- Wilson, (1993) Wilson, C.J., 1993. The generation of natural firing patterns in neostriatal neurons. Prog. Brain Res., 99, 277–297.
- Wilson, (2007) Wilson, C., 2007. GABAergic inhibition in the neostriatum. In: Tepper, J., Abercrombie, E., Bolam, J. (Eds.), Progress in Brain Research, vol. 160. GABA and the Basal Ganglia: From Molecules to Systems. Elsevier, pp. 91–110.
- Wilson et al., (2006) Wilson, C., Cash, D., Galley, K., Chapman, H., Lacey, M., Stanford, I., 2006. Subthalamic nucleus neurones in slices from 1-methyl-4-phenyl-1,2,3,6-tetrahydropyridine-lesioned mice show irregular, dopamine-reversible firing pattern changes, but without synchronous activity. Neuroscience, 143, 565–572.
- Wright and Liley, (1995) Wright, J., Liley, D., 1995. Simulation of electrocortical waves. Biol. Cybern., 72, 347–356.
- Wright and Liley, (1996) Wright, J., Liley, D., 1996. Dynamics of the brain at global and microscopic scales: neural networks and the EEG. Behav. Brain Sci., 19, 285–309.
- Xu et al., (2007) Xu, W., Huang, X., Takagaki, K., Wu, J.-Y., 2007. Compression and reflection of visually evoked cortical waves. Neuron, 55, 119–129.
- Yaar and Shapiro, (1983) Yaar, I., Shapiro, M., 1983. A quantitative study of the electroencephalographic response to levodopa treatment in parkinsonian patients. Clin. Electroencephalogr., 14, 82–85.
- Yoshida et al., (1993) Yoshida, S., Nambu, A., Jinnai, K., 1993. The distribution of the globus pallidus neurons with input from various cortical areas in the monkeys. Brain. Res., 611, 170–174.
- Zesiewicz and Hauser, (2001) Zesiewicz, T., Hauser, R., 2001. Phenomenology and treatment of tremor disorders. Neurol. Clin., 19, 651–680.
- Zhang et al., (2006) Zhang, J., Russo, G., Mewes, K., Rye, D., Vitek, J., 2006. Lesions in monkey globus pallidus externus exacerbate parkinsonian symptoms. Exp. Neurol., 199, 446–453.
- Zhou and Hablitz, (1999) Zhou, F.-M., Hablitz, J., 1999. Dopamine modulation of membrane and synaptic properties of interneurons in rat cerebral cortex. J. Neurophysiol., 81, 967–976.
- Zirh et al., (1998) Zirh, T., Lenz, F., Reich, S., Dougherty, P., 1998. Patterns of bursting occurring in thalamic cells during parkinsonian tremor. Neuroscience, 83, 107–121.
- (266) Zold, C., Ballion, B., Riquelme, L., Gonon, F., Murer, M., 2007a. Nigrostriatal lesion induces D2-modulated phase-locked activity in the basal ganglia of rats. Eur. J. Neurosci., 25, 2131–2144.
- (267) Zold, C., Larramendy, C., Riquelme, L., Murer, M., 2007b. Distinct changes in evoked and resting globus pallidus activity in early and late Parkinson’s disease experimental models. Eur. J. Neurosci., 26, 1267–1279.
- Zweig et al., (1989) Zweig, R., Jankel, W., Hedreen, J., Mayeux, R., Price, D., 1989. The pedunculopontine nucleus in Parkinson’s disease. Ann. Neurol., 26, 41–46.