Performance of new silica aerogels in a
threshold C̆erenkov
counter
Abstract
New highly transparent, hydrophobic silica aerogels with refractive indices of 1.01 to 1.07 have been produced by Aspen Aerogels, Inc., and select tiles have been tested using an electron beam at the DESY, Hamburg facility. A diffusively-reflective threshold C̆erenkov counter was designed and constructed for the purpose of evaluating the aerogels, and can accommodate aerogel tile areas of up to 20 cm by 20 cm. Measurements of the performance of the counter using the new aerogels as C̆erenkov radiators are given in terms of photoelectron yields and a figure of merit.
keywords:
Particle identification methods, Cherenkov detectors1 Introduction
Silica aerogels perform a vital role in nuclear and particle physics experiments as radiators for C̆erenkov detectors. These aerogels cover a range of refractive index from about 1.01 to 1.08, and can be both highly transparent and hydrophobic. The often-large volume of aerogel required for experiments can be very costly, and commercial alternatives to products such as those produced by Matsushita Electric Works could be beneficial. The work presented in this paper is part of an effort to test the performance of new hydrophobic aerogels produced by Aspen Aerogels in prototype C̆erenkov detectors, and answers the call for proposals found in the U.S. DOE Small Business Innovation Research (SBIR) Funding Opportunity Annoucements (FOAs) (see for example page 103 of Phase I Release 1 found in [1]). The SBIR FOAs call for cost-effective C̆erenkov radiators with indices between those of gases and liquids, e.g., aerogels. The ultimate goal is the qualification of commercially produced, cost-efficient, and high-quality aerogel for use in the physics community by benchmarking the performance of the aerogel in both threshold and ring-imaging C̆erenkov detectors. In this paper, we report on aerogel production and testing performed using a threshold-type counter.
A number of aerogel tiles have been produced by Aspen Aerogels, and a small selection have been used for testing in the research presented here. A summary of the techniques used in the production of the aerogels is given in section 2 along with a description of the technique used for measuring the refractive index of the tiles. In this section, we also present the distribution of refractive index measurements taken.
The performance testing was achieved by measuring the performance of a prototype C̆erenkov threshold counter using the new aerogels. Quantification of the performance is given in terms of both photoelectron yield from the photomultiplier tubes (PMTs) that view the counter, as well as calculated figures of merit. This approach is an alternative to measuring individual optical properties of the aerogel, and instead aims to provide a benchmark in the context of C̆erenkov particle detection. The prototype counter was evaluated using an electron test beam at DESY, Hamburg. Details of the experimental setup and test beam can be found in section 3.
Analysis of the experimental data is discussed in section 4, where a variation on a common and robust method of photoelectron quantification is presented. The analysis focuses on determination of the relative inefficiency of detecting electrons in order to extrapolate to average photoelectron yield using the application of Poisson statistics. This avoids difficulties often encountered when complex PMT responses are fit. Another desireable feature of this approach is that it provides a means of measuring systematic error in the determination of photoelectron yields.
In section 5 we describe a figure of merit (FoM) intended to quantify performance in a way that is comparable to different geometries. This FoM is derived from, and nearly identical to, that described by D.W. Higinbotham [2], and as such provides a direct comparison to previous experimental results analyzed in [2]. The aerogel configurations tested, with tile sizes up to 20 cm by 20 cm, are described in section 6 along with photoelectron yields and figures of merit. In addition, dependence of the photoelectron yields on aerogel depth and incident beam position are presented and discussed.
2 Silica aerogels
2.1 Sol-gel chemistry
Fabrication of aerogels generally involves two major steps: formation of a wet gel, and drying of the wet gel to form an aerogel. The vast majority of silica aerogels prepared today utilize silicon alkoxide precursors; this route avoids the formation of undesirable salt by-products and allows more control over the final product. The most common alkoxide precursors are tetramethylorthosilicate (TMOS) and tetraethylorthosilicate (TEOS), however, many others can be used to impart different properties to the gel. The reaction is typically performed in ethanol, with the aerogel density dependent on the concentration of alkoxide. Hexamethyldisilazane (HMDZ) is often used during aging of TEOS or TMOS gels to make the silica surface hydrophobic. However, this treatment takes time, and the transparency of the aerogel is affected by the amount of HMDZ. In this program, a methylsiliconate precursor was used as the co-precursor with TEOS, which showed great results in terms of aerogel hydrophobicity and transparency.
2.2 Aging process
It is often assumed that the hydrolysis and condensation reactions of the silicon alkoxides are complete when a sol reaches the gel point, however the silica backbone of the gel still contains a significant number of unreacted alkoxide groups. In fact, hydrolysis and condensation reactions continue after several days beyond the gelation point. Failure to realize and accommodate this is a common mistake preparing silica aerogel monoliths, as weak aerogels will result. Strengthening the gel is a result of the aging process, and is enhanced by controlling the pH and water content of the aging bath. Common aging procedures for base catalyzed gels involve soaking the gel in an alcohol/ammonia mixture, at a pH of 8-9 for up to 48 hours at 60 °C. The time required for this process depends on the gel thickness. Any water left in the gel will not be removed by supercritical drying, and will lead to an opaque, white, and very dense aerogel.
2.3 Supercritical drying
The final process step for silica aerogels is supercritical drying. This is where the liquid within the gel is removed, at supercritical conditions, leaving only the linked silica network [3], [4]. The process can be performed by venting the ethanol above its critical point or by prior solvent exchange with CO2 followed by supercritical CO2 venting [5], [6]. The gels are put in a high pressure vessel with liquid CO2 and solvent exchange occurs between ethanol and CO2. Once the ethanol is extracted, the gels are brought to the critical point of CO2 (31.06 °C and 1050 psi) and CO2 is slowly vented. Once the pressure reaches ambient, the vessel is opened and crack-free aerogel monoliths are obtained. In this program, a 60 liter vessel was used to fabricate the aerogel tiles for optical characterization. Batches of different refractive index were fabricated for C̆erenkov detection performance evaluation at Arizona State University.
2.4 Refractive index
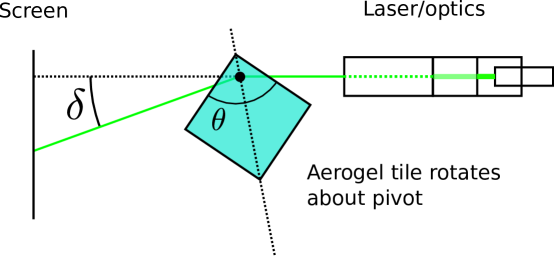
Figure 1 shows the setup for measuring the index of refraction for a tile of aerogel. The method is common (see [7] and [8] for other accounts), and easily yields precise measurements for low index materials like aerogel. Refractive indices are calculated by measuring the minimum deflection of a laser beam through the corner of an aerogel tile. The relevant relationship is given by the common formula for a prism,
| (1) |
where is the refractive index at the wavelength of the laser, is the minimum angle of deflection, and is the prism angle (in this case, about ). The minimum angle is found by measuring the minimum deflection of the laser beam on a ruled screen. The aerogel is pivoted about the intersection of the undeflected laser line, and a line bisecting the corner of the tile. As the aerogel is pivoted back and forth, a minimum deflection is easily found.
The laser used is at a wavelength of 532 nm, and lies comfortably in the spectral range of bialkali photocathodes, such as those used by the photomultiplier tubes in our C̆erenkov test counter.
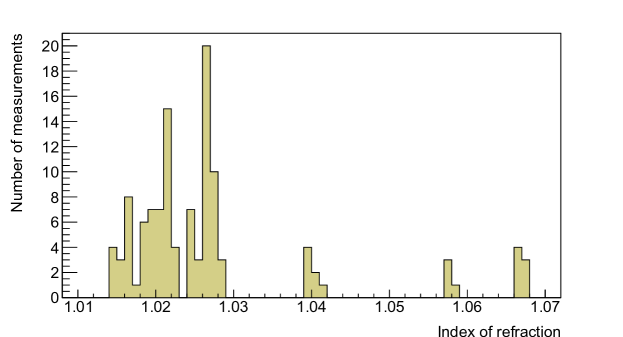
In Figure 2, a histogram of all of the refractive index measurements represents the range of indices produced for evaluation. In this paper, measurements of only a portion of the tiles are presented.
3 Experimental setup
3.1 C̆erenkov Counter
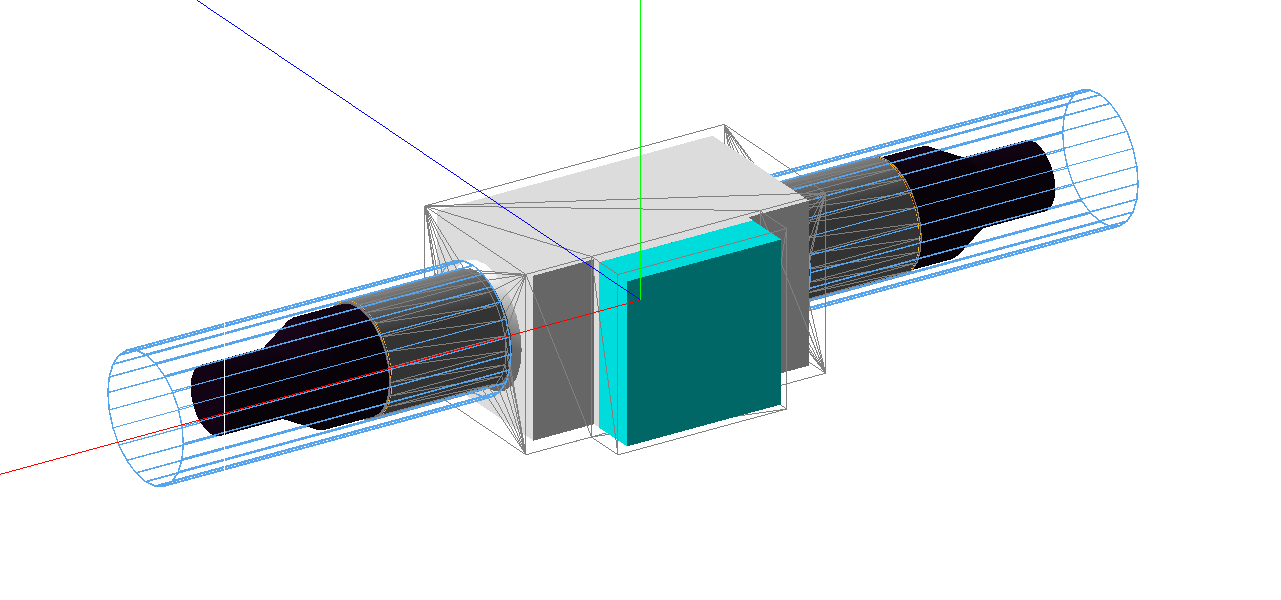
A diffusively reflective threshold counter was developed for testing the new aerogels. It consists of an aluminum light box with dimensions 36.32 x 20.32 x 20 cm3 in the , , and directions respectively (see Figure 3 for axes), a 20.32 x 20.32 x 6.4 cm3 box extruded upstream from the light box to house aerogel, and two 5” Photonis XP4500B photomultiplier tubes (PMTs) coupled to the sides of the light box. A 0.6 mm-thick aluminum window is seen by the beam before passing through the aerogel. The light box and aerogel box are lined on the inside with a white, diffusively reflective “paper”, Millipore GVHP00010. The PMTs are coupled to the light box with polished circular-cylindrical aluminum light guides with an inside diameter of 13.6 cm. The PMTs use a UV glass and a bi-alkali photocathode, and manufacturer’s specifications for the Photonis XP4500B state a peak quantum efficiency of 24%, with a spectral range of about 200 - 650 nm where the efficiency falls off below 10% of peak.
The purpose of the aluminum light guides is to couple the PMTs at a distance so that shielding for static magnetic fields can be effectively used. The test counter is not tested in a significant magnetic field here, but the performance of the counter itself in this configuration is of interest for future applications. In this setup, magnetic shields produced by MuShield are in place which reduce ambient magnetic field at the photocathodes by a factor of 100.
3.2 Data acquisition
For readout, we use a 12-bit 250 MS/s digitizer (CAEN V1720). The PMTs coupled with the Photonis VD105k bases produce a signal with a FWHM ns. This is too sharp of a pulse for the digitizer sample rate, so the PMT signals are fed through passive 32 MHz low-pass LC filters. When an external trigger is received, a number of digitized samples recorded in the vicinity of the trigger are stored for offline analysis. These samples include data prior to the trigger, so that a pedestal can be calculated for each event.
3.3 Test beam
The T22 e-/e+ test beam at the DESY facility in Hamburg was used to perform tests of the aerogel/counter combination. The beam is generated by converting bremsstrahlung radiation from carbon fiber targets in the DESY II lepton storage ring. The leptons in this storage ring are bunched, and revolve once every microsecond [9]. For this setup, converted electrons at an energy of 2 GeV are selected, with an energy spread . The beam is shaped by a 20 x 20 mm2 primary collimator, and then a 6 x 6 mm2 secondary collimator. Located immediately downstream of the secondary collimator is a broad scintillator (S1). Approximately 5 m further downstream is the C̆erenkov test counter, and another 5 m downstream is a 2 x 2 cm2 scintillator (S2). The test counter was mounted to an X-Y translation table for relative beam positioning, and to measure position dependence. A trigger signal is produced with coincidence between S1 and S2. The average trigger rate is kHz.
For simplicity, it’s beneficial to argue that on each trigger, only one electron passes through the counter. Given the trigger rate and the bunched nature of the storage ring, we estimate that there are an average of 1.002 electrons passing through the counter on triggered events. This estimate relies on the assumption that all electrons passing through the counter produce a trigger. Based on the observed narrowness of the beam, this is a reasonable assumption.
4 Signal analysis
4.1 Pulse binning
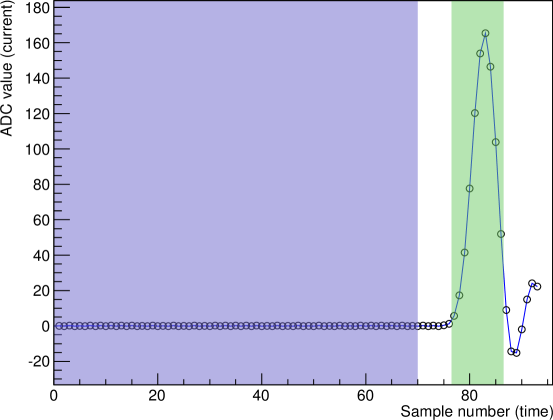
As described in section 3.2, the PMT waveforms are digitized to be analyzed offline. The timing of the signal is tuned so that 70 samples of electronic pedestal are obtained before the desired PMT signal (Figure 4). The pedestal for each event and for each PMT is therefore amply measured in order to produce a sharp zero-photoelectron peak, on which our analysis ultimately relies. For each event, the latter portion of the waveform in Figure 4 is integrated relative to the calculated pedestal and binned into a pulse-height spectrum (Figure 5).
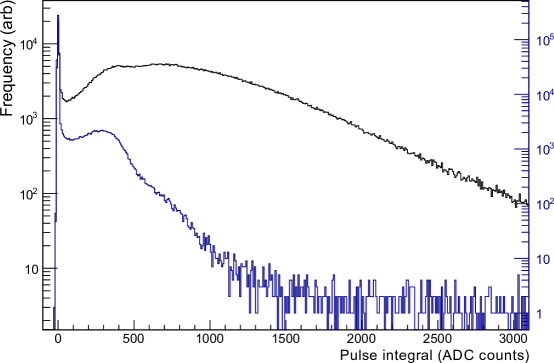
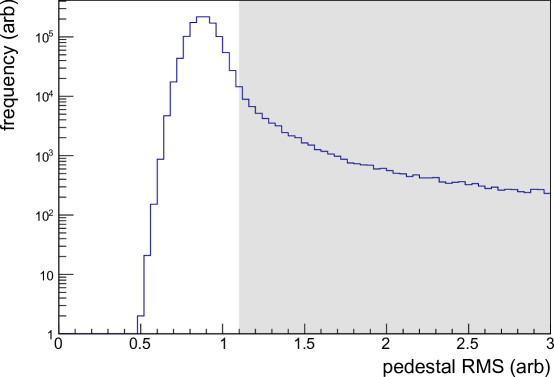
In order to minimize the effects of dark current, a cut is placed on the standard deviation of the pedestal samples to enforce the assumption of a constant signal with a small random error. This cut, shown in Figure 6, is necessary for minimizing artifacts in the zero-photoelectron peak due to dark current.
4.2 Determination of average photoelectron counts
The pulse-height spectrum shown in Figure 5 has a sharp peak at the left corresponding to the absence of photomultiplication, and its integrated value divided by the total number of events is therefore considered to be the probability that zero photoelectrons are produced in the PMT for a triggerable event in a given counter configuration. The probability distribution for the number of photoelectrons emitted from the PMT cathodes in a triggerable event is well approximated by a Poisson, given the low probability of a radiated photon producing a photoelectron. We therefore claim that the average number of photoelectrons produced for such an event is equal to
| (2) |
where and are the pedestal event and total event counts respectively. This general approach has been compared to other techniques in [10], where R. Dossi et al. also incorporate a model for single- and multiple-photoelectron peaks for a fit to data. We have chosen this approach since it has the advantage of few assumptions, and we have found it to be robust in our application.
Systematic error in the determination of comes from overlap of the pedestal peak with contributions from non-zero photoelectron signals. This is potentially largely due to incomplete photomultiplication in the large PMTs. In practice, a sharp pedestal peak is necessary and a cutoff is placed on the integration of the pedestal peak and varied to examine systematic effects. As a guide for this cutoff, a method of determining the width of the pedestal peak will be incorporated in order to place the cutoff at an estimated probability of pedestal noise excursions.
4.2.1 Deconvolution
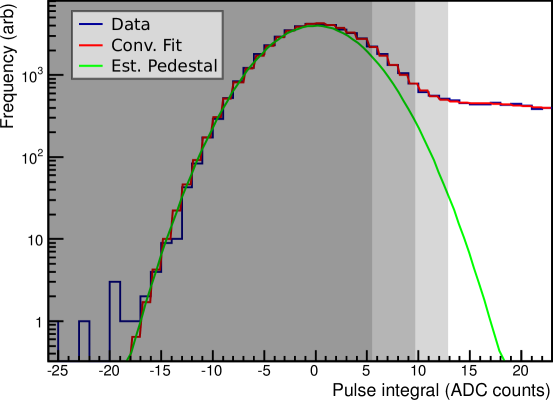
To determine the width of the pedestal peak, a deconvolution method is applied to the pulse-height spectrum with an estimated point-spread function (PSF). The PSF is approximated by a Gaussian with an unknown width, and the reconvolved spectrum is fit to the measured spectrum using a least-squares search method over the PSF width parameter. Figure 7 gives an example of the result of such a fit. The purpose of such a process is to gain a precise form of the PSF.
By constraining the deconvolved spectrum to exist in a positive semi-definite range, we can demand that the true charges deposited on the PMT anode are of only one sign (negative, since the sign is inverted for a positive spectrum). This allows the pedestal region of the spectrum to provide a stable constraint on the PSF. In this way, the fitted PSF can be said to represent the random error in the measurement of charge collected by the PMT anode.
An iterative deconvolution approach known as the Lucy-Richardson algorithm is used [11]. This approach provides a straightforward means of obtaining a maximum-likelihood solution while enforcing the condition , where represent the discrete values of the deconvolved spectrum.
4.2.2 Pedestal integration
Figure 7 shows the pedestal peak of a pulse-height spectrum along with the predicted pedestal contribution from the deconvolved spectrum. To determine the pedestal contribution from the data, the pulse-height spectrum is integrated from left to right to specific probability intervals based on the fitted PSF. The pedestal integral is taken to be
| (3) |
where is the inverse complementary error function – are 0.9, 0.99, and 0.999 – is the width of the Gaussian PSF – and is the measured spectrum. By combining Equation 2 and 3, provide average photoelectron values () for a mid-range result at 99%, and a reasonable range from the upper bound at 90% and the lower bound at 99.9%.
5 Figure of Merit
D.W. Higinbotham [2] presents a useful Figure of Merit for threshold C̆erenkov counters in the form of
| (4) |
where is the depth of the aerogel, is the average light box reflectivity (using reasonable values for reflector and aerogel reflectivity given by [2] for uniformity), and is the fraction of the light box covered by photosensitive detector. The factor is approximately proportional to the number of photons radiated from the aerogel, and is the limit of
| (5) |
which estimates the probability of a photon reaching a photocathode under the assumption that there is a flat distribution of reflections across the surface of the light box. then contains information on light losses in the aerogel, quantum efficiency of photon detectors, and higher-order geometrical effects. In the results of this paper, we will utilize this FoM in a slightly modified form.
Due to the depth of our counter and the rapidity of the beam used for testing, C̆erenkov radiation in the air contributes non-trivially to our measured photoelectron yield, making a FoM of the form of Equation 4 artificially large. We will account for this by taking
| (6) |
so that
| (7) |
where subscripts and represent aerogel and air respectively. This provides an correction that reduces the FoM to compare more directly with counters that have less contribution from air.
6 Aerogel configurations and results
| Batch | Depth (mm) | (cm-1) | |||
|---|---|---|---|---|---|
| Empty (air) | 0 | N/A | N/A | ||
| 1 | 28 | 40 | |||
| 41 | 36 | ||||
| 56 | 32 | ||||
| 2 | 53 | 0.0007 | 34 | ||
| 3 | 62 | 0.0023 | 28 |
The performance of the C̆erenkov threshold test counter has been analyzed with three different batches of aerogel. The batches provide a small spread in refractive index and two different aerogel tile form factors. The tiles from each batch are 1 - 2 cm deep squares.
- Batch 1
-
has a mean refractive index of 1.026 and has a square area .
- Batch 2
-
has a mean refractive index of 1.028, and also has a square area .
- Batch 3
-
also has a mean refractive index of 1.028, but with a square area . This is considered a large tile.
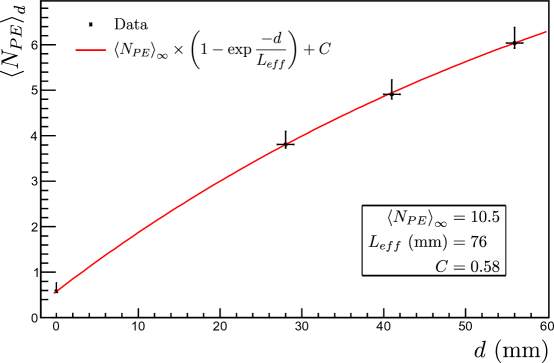
Table 1 lists measurements for a series of aerogel configurations. For each configuration, the total aerogel depth, average number of photoelectrons , the mean refractive index, the spread in index measurements, and a Figure of Merit have been calculated. Figure 8 shows a plot of the first four configurations listed in Table 1, along with a fit to the values showing the non-linear depth dependence of Batch 1. This fit is of the form used by I. Adachi et al. [12], and is given by
| (8) |
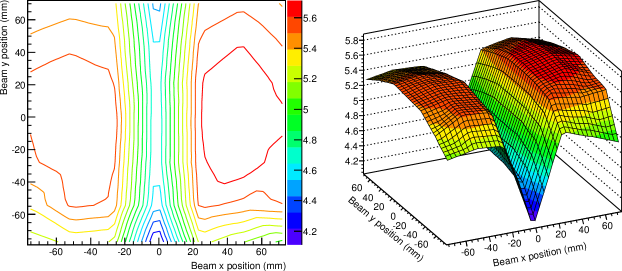
where is the depth of the aerogel stack, and the effective absorption length contains information about absorption and scattering in the aerogel convolved with the geometry and reflectivity of the test counter. The spatial dependence of the test counter response with the Batch 3 large tiles has been measured by scanning the counter transversely with respect to the beam, and is shown in Figure 9.
6.1 Large tile performance
Examining the features in Figure 9, we find that a 1 cm-wide strip of aluminum that was used to hold the aerogel tiles in place during testing produced a significant effect in the spatial scan as indicated by the large dip in the center of the scan. There is also a small asymmetry in the response of the counter on either side of the aluminum support, indicating a difference in quantum efficiencies between the two PMT photocathodes. Finally, a gentle slope exists toward the edges of the scan as a result of the geometry of the light box. A Monte-Carlo simulation was performed which qualitatively replicated each of these features.
The spatial scan shows that the uniformity of the counter in the regions not affected by the aluminum aerogel support is quite good. Each of the measurements listed in Table 1 were obtained with the beam center varying by no more than a few mm relative to the counter, and are each around 50,-50 mm. We conclude that the small variations in relative beam center produced variations between batches in the average number of measured photoelectrons on the order of a percent.
7 Summary
Hydrophobic aerogels have been produced for use as C̆erenkov radiators in a threshold counter. Measurements of the performance of the aerogel/counter combination with aerogel refractive indices from 1.026 to 1.028 and various depths have been performed, yielding photoelectron counts between 3.8 and 6.4 (Table 1). Using a figure of merit in the style of D.W. Higinbotham [2], low-order effects from the specific refractive indices used – as well as from the geometry (aerogel depth, PMT area, etc) – have been removed to produce values from 28 - 40 cm-1 that can be used to compare to previous experimental results.
Acknowledgements.
This material is based upon work supported by the Department of Energy under Award Number DE-SC0004290 and by the National Science Foundation Awards 0969654 and 1306547. The authors would also like to thank the OLYMPUS collaboration for the beam time at the DESY detector testing facility.Disclaimer
This report was prepared as an account of work sponsored by an agency of the United States Government. Neither the United States Government nor any agency thereof, nor any of their employees, makes any warranty, express or implied, or assumes any legal liability or responsibility for the accuracy, completeness, or usefulness of any information, apparatus, product, or process disclosed, or represents that its use would not infringe privately owned rights. Reference herein to any specific commercial product, process, or service by trade name, trademark, manufacturer, or otherwise does not necessarily constitute or imply its endorsement, recommendation, or favoring by the United States Government or any agency thereof. The views and opinions of authors expressed herein do not necessarily state or reflect those of the United States Government or any agency thereof.
References
- [1] “FY 2015 | U.S. DOE Office of Science (SC).” Web page, November, 2015.
- [2] D. Higinbotham, Diffusely reflective aerogel cherenkov detector simulation techniques, Nucl. Instrum. Methods Phys. Res. A 414 (1998), no. 2-3 332 – 339.
- [3] S. S. Kistler, E. A. Fischer, and I. R. Freeman, Sorption and surface area in silica aerogel, J. Am. Chem. Soc. 65 (1943), no. 10 1909–1919, [http://pubs.acs.org/doi/pdf/10.1021/ja01250a034].
- [4] M. A. McHugh and V. J. Krukonis, Supercritical fluid extraction: principles and practice. Boston: Butterworths, 1986.
- [5] P. Tewari and A. Hunt, Hydrolysis and condensation of alkoxides to form alcogels; window, appliance insulation, Sept. 9, 1986. US Patent 4,610,863.
- [6] P. H. Tewari, A. J. Hunt, and K. D. Lofftus, Ambient-temperature supercritical drying of transparent silica aerogels, Mater. Lett. 3 (1985), no. 9-10 363 – 367.
- [7] Y. K. Akimov, V. P. Zrelov, A. I. Puzynin, S. V. Filin, A. I. Filippov, and V. A. Sheinkman, An aerogel threshold cerenkov counter, Instrum. Exp. Tech. 45 (2002) 634–639. 10.1023/A:1020497800282.
- [8] Belle Collaboration, S. Sahu, M. Wang, R. Suda, R. Enomoto, K. Peng, C. Wang, I. Adachi, M. Amami, Y. Chang, R. Guo, K. Hayashi, T. Iijima, T. Sumiyoshi, and Y. Yoshida, Measurement of Radiation Damage on Silica Aerogel Cherenkov Radiator, Nucl. Instrum. Methods Phys. Res. A A382 (1996) 441–446, [hep-ex/9604004].
- [9] “DESY | Test Beam | Description.” Web page, November, 2015.
- [10] R. Dossi, A. Ianni, G. Ranucci, and O. J. Smirnov, Methods for precise photoelectron counting with photomultipliers, Nucl. Instrum. Methods Phys. Res. A 451 (2000), no. 3 623–637.
- [11] L. B. Lucy, An iterative technique for the rectification of observed distributions, Astron. J. 79 (June, 1974) 745+.
- [12] I. Adachi, T. Sumiyoshi, K. Hayashi, N. Iida, R. Enomoto, K. Tsukada, R. Suda, S. Matsumoto, K. Natori, M. Yokoyama, and H. Yokogawa, Study of a threshold cherenkov counter based on silica aerogels with low refractive indices, Nucl. Instrum. Methods Phys. Res. A 355 (1995), no. 2-3 390 – 398.