Recent Results from RENO
Abstract:
RENO (Reactor Experiment for Neutrino Oscillation) is the reactor neutrino experiment which has been taking data from August 2011 with two identical near and far detectors at Hanbit Nuclear Power Plant, Yonggwang, Korea. Using 1,500 live days of data, and are updated using spectral measurements: and . The 5 MeV excess dependency on the reactor thermal power rate is again clearly observed with the increased data set.
1 Introduction
RENO has successully measured the value of the smallest neutrino mixing angle, , and has undertaken the measurement of the squared mass difference . The inverse beta decay (IBD) data collected at RENO uses electron antineutrinos produced by six equally spaced reactors of the Hanbit nuclear power plant. There are two identical detectors located at near and far sites at 294 m and 1,383 m, respectively, from the center of the reactor array. The power plant consists of six equally spaced reactor cores placed linearly and provides a total thermal power of 16.8 GWth in full operation mode.
Even though all three neutrino mixing angles and two mass square differences in the PMNS matrix are measured based on reactor experiments, precise measurements of these parameters are still important issues for current and future neutrino oscillation experiments to measure leptonic CP violation and to determine neutrino mass ordering. Recently some methodologies to measure neutrino mass ordering using reactor anti electron neutrino are discussed [1].
In this work RENO improved background systematic uncertainty and updated and using 1,500 live days of data collected in the detectors. The updated 5 MeV excess estimation is also reported.
2 RENO Detector
RENO near (far) detector is constructed with 120 (450) m.w.e. overburden. The two detectors are assembled identically in a concentric cylindrical shape. Each detector consists of inner detector (ID) and outer veto detector (OD) filled with 350 ton purified water. The ID consists of target (16 ton liquid scintillator with 0.1% Gd), -catcher (29 ton liquid scintillator), and buffer (65 ton mineral oil) from the detector center. Total 354 (67) Hamamatsu 10 inch PMTs are installed on the buffer (veto) wall. More details on the RENO experimental setup and the detector are found in [2, 3].
3 Data Sample
RENO has been taking data since 2011 continuously with average DAQ live time efficiency of 95% for both detectors. In this analysis we use data collected from Aug. 19, 2011 to Apr. 23, 2017 for near detector and from Aug. 11, 2011 to Sep. 23, 2015 for far detector. Total live time of the data is 15,47.35 (1,397.78) days for near (far) detector.
| Detector | Near | Far |
|---|---|---|
| Selected candidate events | 732.168 | 68.055 |
| Total background rate | 9.340.37 | 1.950.15 |
| IBD rate after background subtraction | 463.800.66 | 46.750.24 |
| Livetime [days] | 1,547.35 | 1,397.78 |
| Accidental | 2.070.02 | 0.380.01 |
| 9Li/8He | 5.490.36 | 0.930.15 |
| Fast neutron | 1.740.02 | 0.350.01 |
| 252Cf | 0.040.01 | 0.280.02 |
RENO select IBD event sample by applying the IBD selection criteria described in [2]. In this analysis, to reduce background rate and its uncertainty, the optimized values of the spatial coincidence requirement of R ¡ 2.0 m to lower the accidental background is considered. The following multiplicity requirements are also changed to make additional reduction of fast neutron, 9Li/8He and 252Cf backgrounds (note that the indexes of changed criteria are the ones used in [3]): a timing veto requirement for rejecting coincidence pair (a) if they are accompanied by any preceding ID or OD trigger within a 300 s window before their prompt candidate, (b) if they are followed by any subsequent ID-only trigger other than those associated with the delayed candidate within a 200 (800) s window from their prompt candidate (only far 252Cf contaminated data), (d) if there are other subsequent pairs within the 500 (1,000) s interval (only far 252Cf contaminated data), (f) if they are accompanied by a prompt candidate of EP ¿ 3 MeV and Qmax/Qtot ¡ 0.04 within a 10 (20) s window and a distance of 40 (50) cm for near (far) 252Cf contaminated data; (ix) a spatial veto requirement for rejecting coincidence pairs in the far detector only if the vertices of their prompt candidates are located in a cylindrical volume of 50 cm in radius, centered at x = +12.5 cm and y = +12.5 cm and z ¡ -110 cm. Total dead time due to the selection criteria is estimated as 40.37 (31.47)% for near (far) data. The same detection efficiency in [4] is used in this analysis.
Some background could remain in the IBD candidate events sample passing the selection criteria. The methods to estimate the remaining background are well described in [4] and adopting the same method for the 1,500 live days of RENO data we estimated the remaining background and summarized in Table 1.
| Bin-correlated | Bin-uncorrelated | |
|---|---|---|
| Total background | 0.60% (near), 1.99% (far) | 3.94% (near), 2.71% (far) |
| Accidental | 0.37% (near), 0.96% (far) | 0.18% (near), 0.49% (far) |
| 9Li/8He | 1.01% (near), 3.66% (far) | 6.71% (near), 4.17% (far) |
| Fast neutron | 0.23% (near), 0.54% (far) | 0.75% (near), 0.83% (far) |
| 252Cf | 6.00% (near), 1.11% (far) | 10.23% (near), 12.62% (far) |
4 Systematic Uncertainties
To obtain the systematic uncertainties, the methods described in [4] is applied. Based on these methods we estimated our systematic uncertainties on background and summarized in Table 2. The systematic uncertainties of reactor, detection efficiency including timing veto, and energy scale remain the same as before [4].
5 Results
With 1,500 live days of data we estimate the 5 MeV excess and spectral measurement of and .
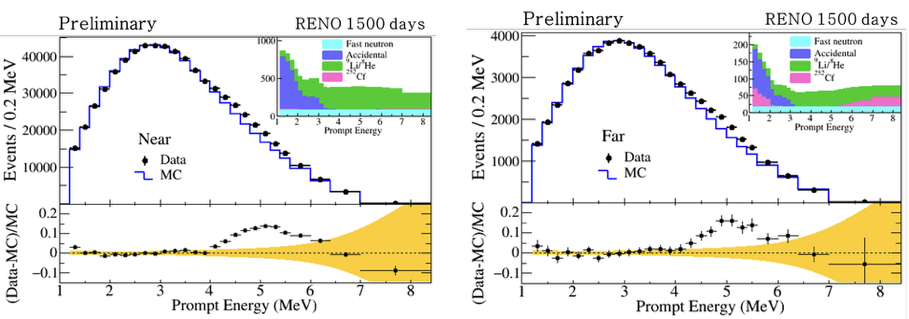
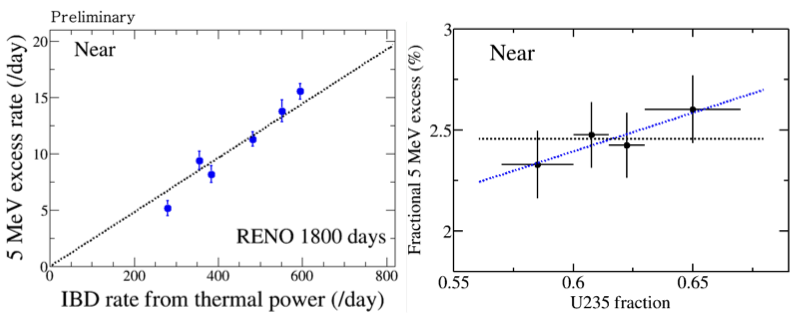
RENO is the first reactor neutrino experiment group who discovers the 5 MeV excess based on spectral comparion of observed and expected IBD prompt events at the two detectors in 2014 using 800 live days of RENO data [5]. The correlation between the 5 MeV excess and the IBD rate, i.e. the reactor thermal power was also reported. These results are updated using 1,500 live days of data. Figure 1 top panels show observed IBD prompt spectra of near and far data compared to the expected ones by the Huber and Mueller model [6, 7] normalized to the area except the 5 MeV excess region. The bottom panels of the Fig. 1 depict the difference between the two spectra in the corresponding upper panels, where yellow bands represent uncertainties in the model. A clear spectral discrepancy is observed in the region of 5 MeV in both detectors. For the spectral comparison only, the MC predicted energy spectra are normalized to the observed events out of the excess range 3.6 ¡ Ep ¡ 6.6 MeV. The excess of events is estimated as about 2.5% of the total observed reactor rate in both detectors.
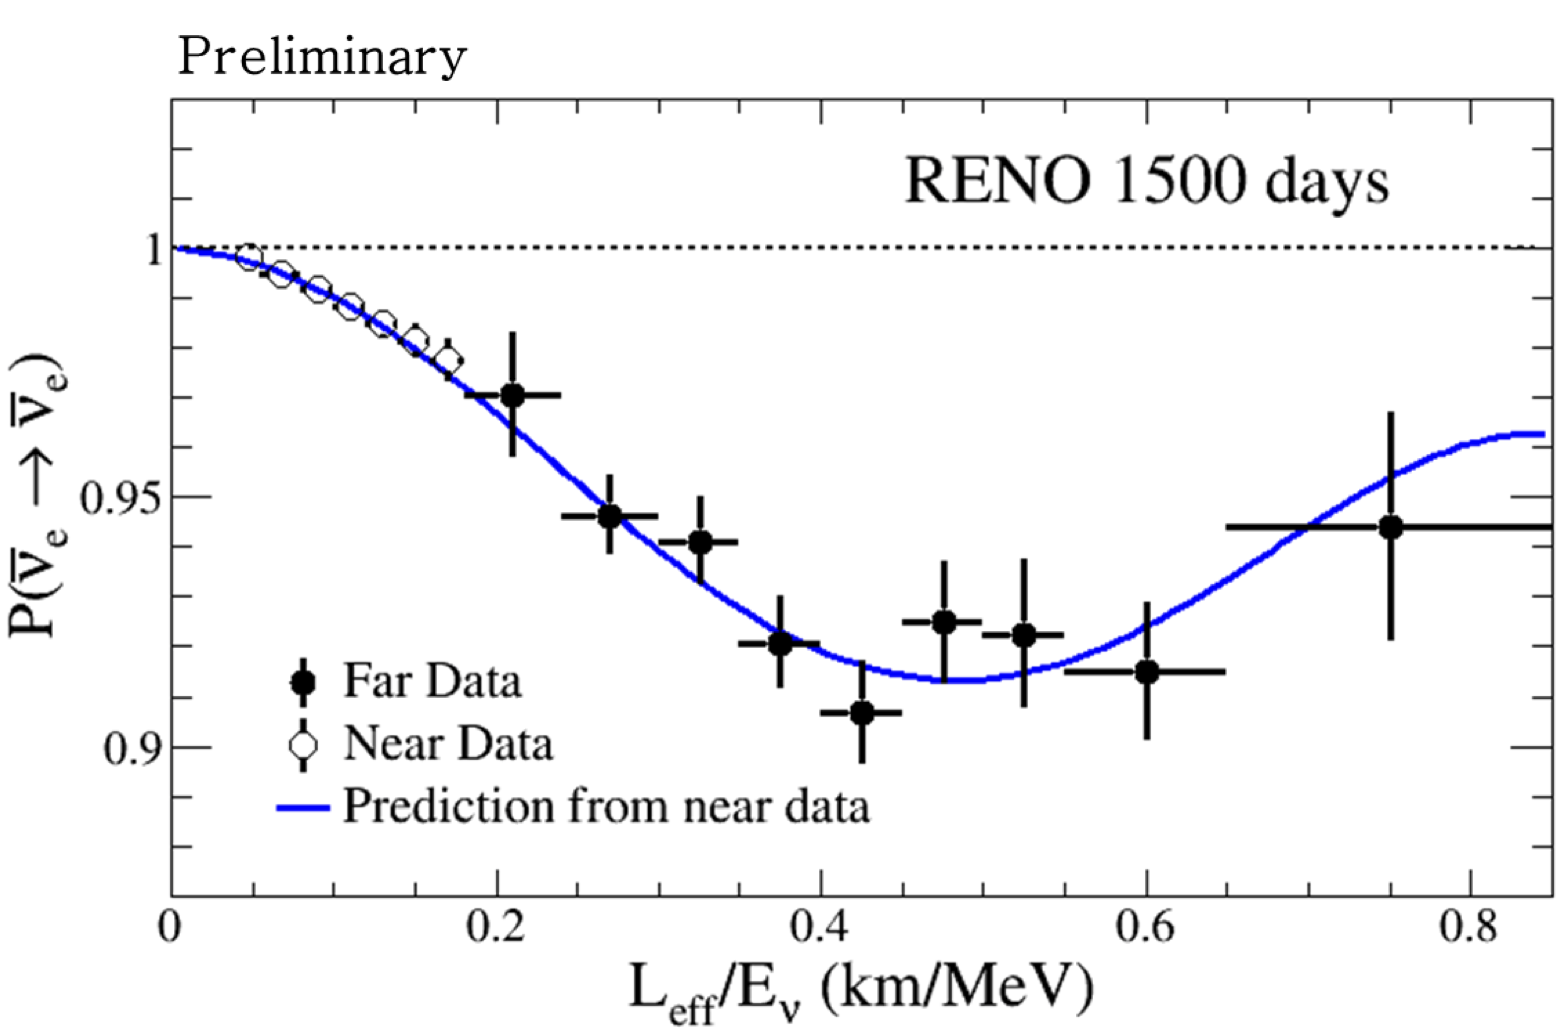
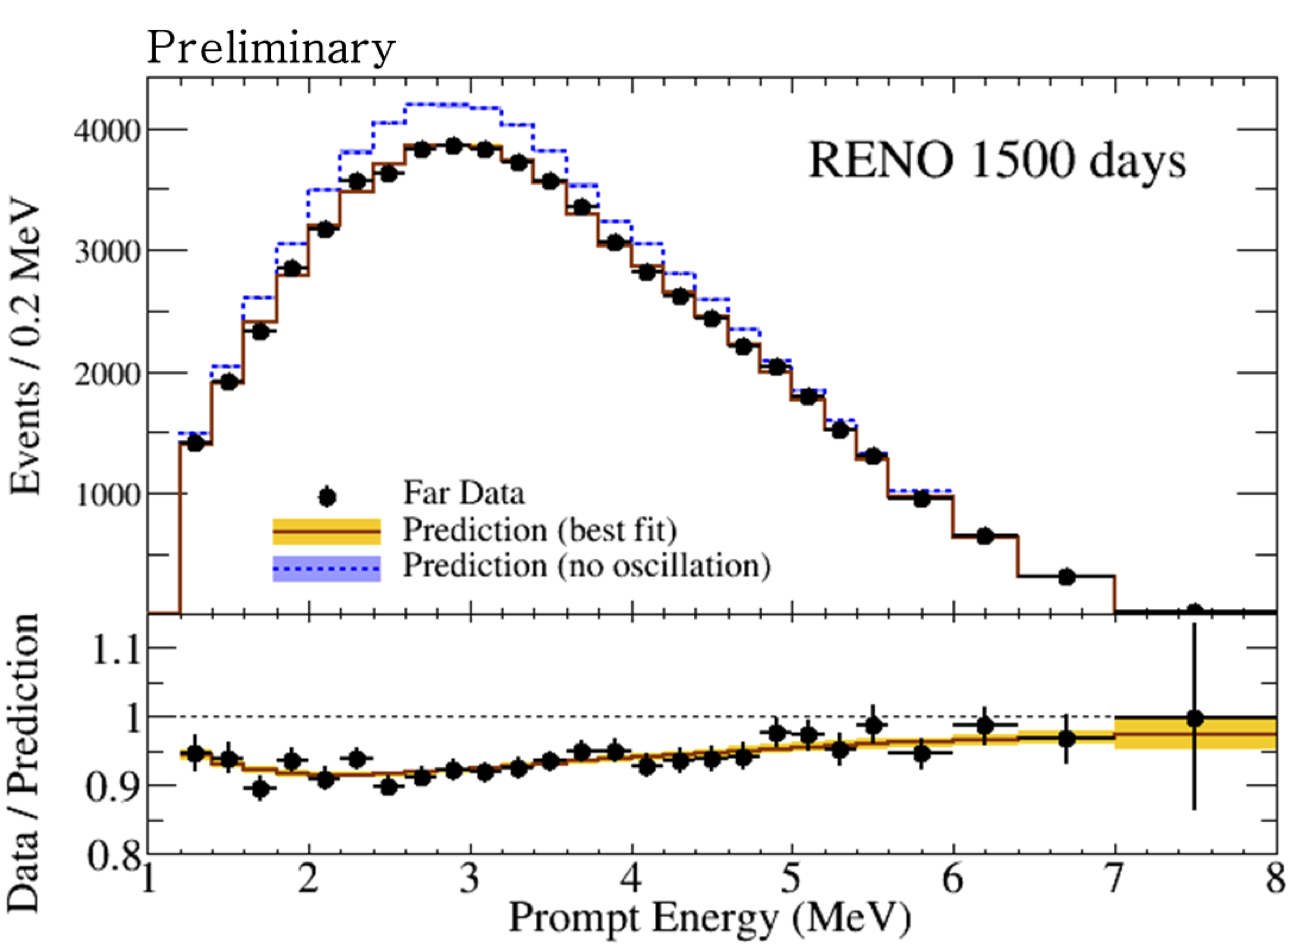
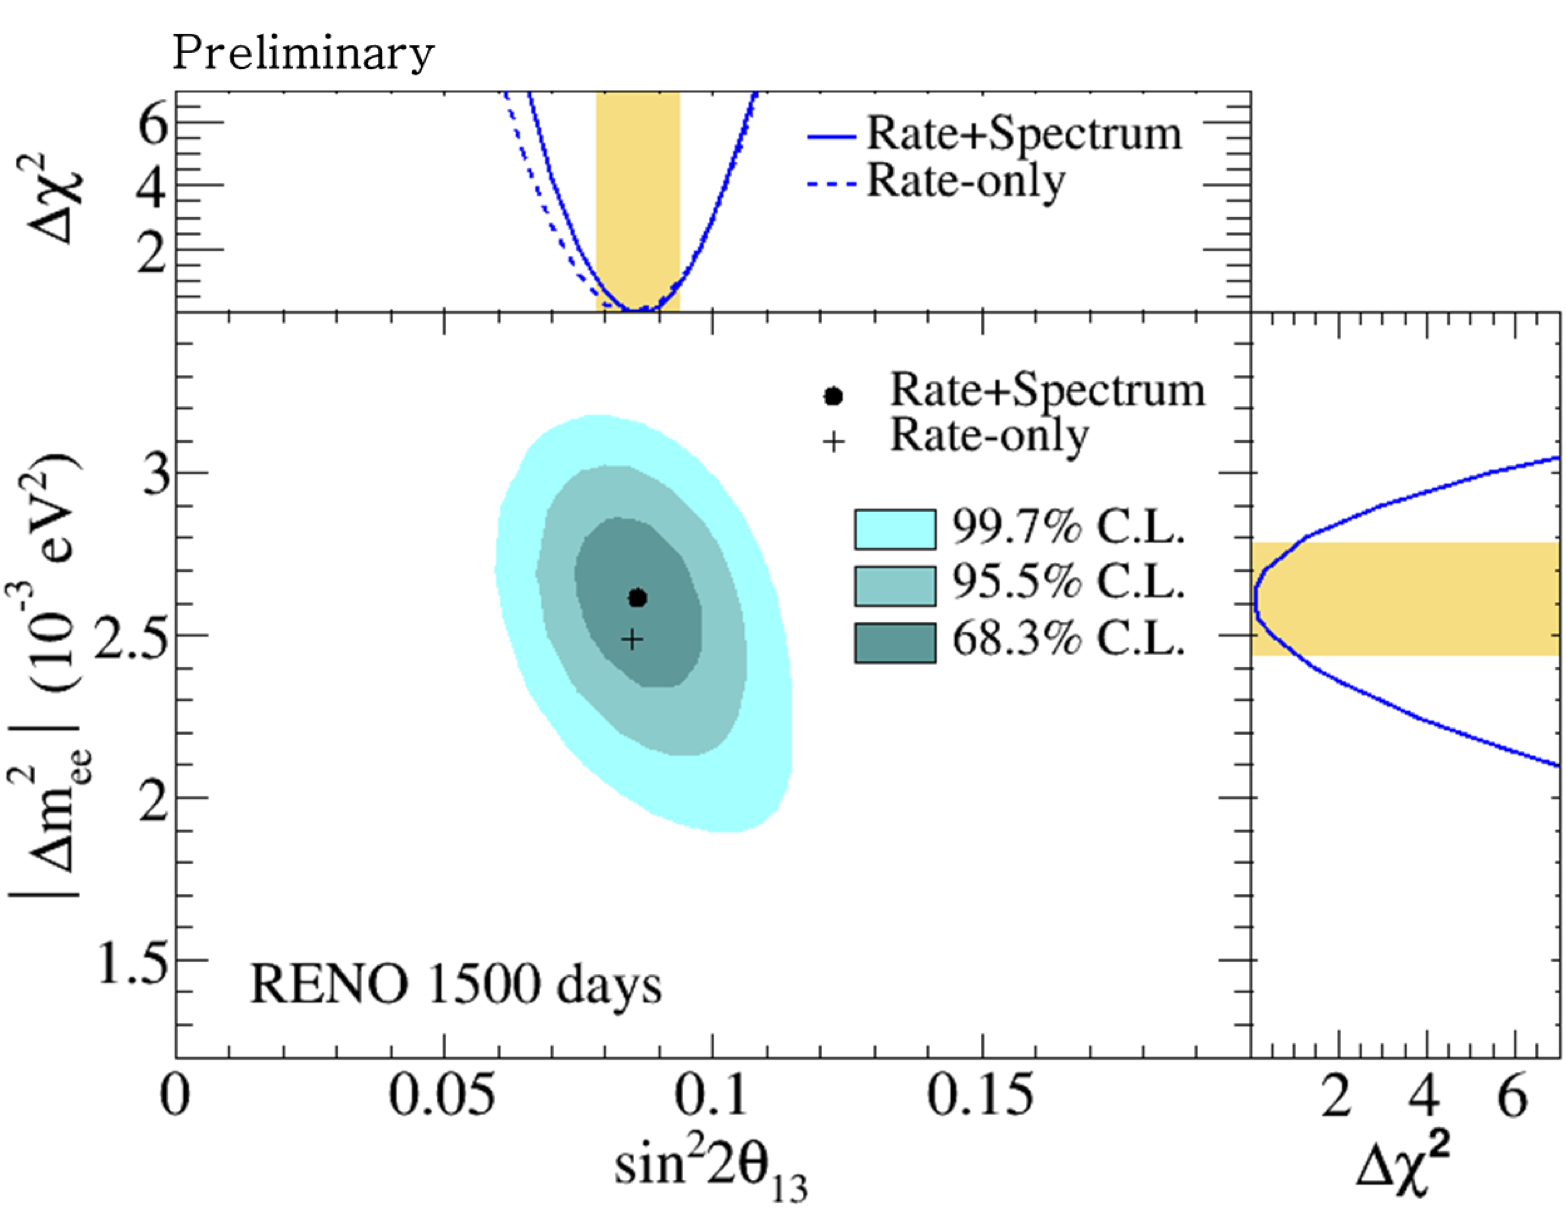
Using the function for the rate + shape analysis described in [3], and are obtained for the 1,500 live days of RENO data. The measured values using events in 1.2 ¡ Ep ¡ 8 MeV are: and . The total uncertainty on () is reduced from 12 (10)% to 9 (7)% compared to our previous measurements using 500 live days of data [3]. Figure 3 top panel shows the observed IBD prompt spectrum at far (black dots with error bars) and the expected one obtained from near data assuming no oscillation. There is a clear discrepancy between the two due to electron anti neutrino disappearance at far, and their ratio is drawn in the bottom panel where the energy dependent discrepancy is shown well. Figure 4 shows the contour plot and the best-fit values of rate + shape (black dot) and rate-only (cross sign) measurements. Figure 5 shows the electron anti neutrino survival probability as a function of Leff/E. Both near (open circles) and far (black dots) data points are shown with the best-fit oscillation probability (blue curve). The far data points matches very well to the best-fit oscillation. The near data points, however, matches extremely well to the best-fit oscillation since the near expectation without oscillation was obtained by unavoidably using near data itself rather than MC. Note that MC can not be used in this case because of the mismatch in the 5 MeV excess region.
In summary, using 1,500 live days of data RENO has reduced the uncertainties to 9% and 7% for the and measurements, respectively. RENO has a plan to reduce the uncertainty to 6% using data taken by 2018. With additional 2 or 3 more years of data taking from 2019 the uncertainty on the measurement is expected to be reduced to 45% even though the uncertainty would remain as 6%.
References
- [1] M. Y. Pac, Nucl. Phys. B902, 326 (2016) and refecnces therein.
- [2] J. K. Ahn et al. (RENO Collaboration), arXiv:1003.1391 (2010).
- [3] J. H. Choi et al., Nucl.Instrum.Meth. A810, 100 (2016).
- [4] S. H. Seo et al. (RENO Collaboration), arXiv:1610.04326, submitted to PRD (2016).]
- [5] S. H. Seo (RENO Collaboration), AIP Conf. Proc. 1666, 080002 (2015), arXiv:1410.7987.
- [6] Th. A. Mueller et al., Phys. Rev. C 83 054615 (2011).
- [7] P. Huber, Phys. Rev. C 84, 024617 (2011).