The VLT/MUSE view of the central galaxy in Abell 2052
We report observations of the radio galaxy 3C317 (at z=0.0345) located at the center of the Abell cluster A2052, obtained with the VLT/MUSE integral field spectrograph. The Chandra images of this cluster show cavities in the X-ray emitting gas, which were produced by the expansion of the radio lobes inflated by the active galactic nucleus (AGN). Our exquisite MUSE data show with unprecedented detail the complex network of line emitting filaments enshrouding the northern X-ray cavity. We do not detect any emission lines from the southern cavity, with a luminosity asymmetry between the two regions higher than 75. The emission lines produced by the warm phase of the interstellar medium (WIM) enable us to obtain unique information on the properties of the emitting gas. We find dense gas (up to 270 cm-3) that makes up part of a global quasi spherical outflow that is driven by the radio source, and obtain a direct estimate of the expansion velocity of the cavities (265 km s-1). The emission lines diagnostic rules out ionization from the AGN or from star-forming regions, suggesting instead ionization from slow shocks or from cosmic rays. The striking asymmetric line emission observed between the two cavities contrasts with the less pronounced differences between the north and south sides in the hot gas; this represents a significant new ingredient for our understanding of the process of the exchange of energy between the relativistic plasma and the external medium. We conclude that the expanding radio lobes displace the hot tenuous phase of the interstellar medium (ISM), but also impact the colder and denser ISM phases. These results show the effects of the AGN on its host and the importance of radio mode feedback.
Key Words.:
galaxies: active – galaxies: nuclei – galaxies: clusters: general – galaxies: clusters: individual (A2052) – galaxies: star formation –ISM: jets and outflows1 Introduction
The exchange of matter and energy between active galactic nuclei (AGN), their host galaxies, and clusters of galaxies–known as the AGN feedback process–is a fundamental ingredient in the formation and evolution of astrophysical structures. Galaxy formation models consider two modes of AGN feedback: the quasar mode, which operates during a luminous nuclear phase and produces winds powered by radiation pressure, and the radio mode, in which kinetic energy is released through relativistic jets (Fabian 2012). Powerful outflows have been extensively observed at both low and high redshift (Swinbank et al. 2015; Carniani et al. 2016; Maiolino et al. 2012), but the observational evidence that they have a relevant impact on the star formation of their host galaxies remains elusive.
So far, the clearest evidence of AGN feedback has been found in the local Universe, where X-ray images of galaxy clusters revealed cavities in the hot ionized medium (HIM) ( K), often filled by the radio emitting plasma. The radio sources hosted in the brightest cluster galaxies (BCGs) were able to displace the low-density gas forming the hot phase of the ISM while expanding (McNamara et al. 2000; Bîrzan et al. 2004, 2012).
The X-ray image of the galaxy cluster A2052 from the Chandra satellite provides one of the clearest examples of such cavities: a pair of symmetric depressions in the X-ray surface brightness is closely correlated with the presence of radio emission (Blanton et al. 2001). In A2052 the estimate of the total energy required to inflate the cavity is a few 1057 erg (Bîrzan et al. 2004). Since gas speed cannot be measured from X-ray observations, it is assumed that the bubble moves outward at the sound speed ( for an external gas temperature of 107 K, Blanton et al. 2011) or, alternatively, that its motion is driven by buoyancy forces (Panagoulia et al. 2014), resulting in a cavity age of years.
The presence of warm ionized medium (WIM) producing optical emission lines in the central region of A2052 (Baum et al. 1988; Heckman et al. 1989; McDonald et al. 2010) offers the unique possibility of studying the dynamics of the expanding cavity and the energy exchange between the active nucleus and the surrounding medium, an essential ingredient for a better understanding of the feedback process.
We observed the central brightest cluster galaxy, UGC 9799, in the optical band with the VLT/MUSE integral field spectrograph. UGC 9799 is an elliptical galaxy (z=0.0345 where 1 corresponds to 0.69 kpc) associated with the radio source 3C 317. The mass of its central supermassive black hole, estimated from the central stellar velocity dispersion ( km s-1, Smith et al. 2004), and the relation of with (Kormendy & Ho 2013) is 10. Source 3C 317 shows an amorphous radio halo, elongated in the NS direction and extended over 60 kpc (Morganti et al. 1993), with a radio luminosity of P=erg s-1 Hz-1 at 178 MHz (Spinrad et al. 1985); the radio core is coincident with the optical center of the galaxy. The optical nucleus has emission line ratios typical of low-ionization nuclear emission line regions (LINERs, Heckman 1980; Buttiglione et al. 2010).
2 Observation and data reduction
We pointed the telescope at A2052 and we took advantage of the large field of view () of the instrument to observe both the northern and southern X-ray cavities. The observations were obtained with the VLT/MUSE spectrograph on 13 April, 13 May, and 28 May 2016 for about two hours split between five exposures of 25 minutes each, taken with different seeing conditions (between 0.6 to 2.0). Four datasets were affected by bad sky conditions, resulting in strong reddening and uncertainties in the flux calibration or poor seeing conditions. We thus decided to limit our analysis to the exposure with the highest spatial resolution (0.6) and best sky conditions, namely MUSE.2016-05-13T05:19:36.833. We used the ESO MUSE pipeline (version 1.6.2) to obtain a fully reduced and calibrated data cube. No correction for the small Galactic reddening, E(B-V)=0.03, is applied.
To subtract the stellar continuum, we need to optimally bin the data to detect the stellar absorption features in the spectra, preserving the highest possible spatial resolution. Therefore, we performed a Voronoi adaptive spatial binning of the cube data, requiring an average signal-to-noise ratio per wavelength channel of at least 50 in the range 4500-7000 . We used the Penalized Pixel-Fitting code (pPXF, Cappellari & Copin 2003) to fit the absorption stellar features with a linearly independent subset of stellar templates from Vazdekis et al. 2010 that combine theoretical isochrones with the full MILES empirical stellar library (Falcón-Barroso et al. 2011). We adopt a 10th order additive polynomial correction for the continuum and included the emission lines in the fit instead of masking them. From this analysis we also estimated the recession velocity for UGC 9799 of 1033010 , in good agreement with previous optical measurements (Katgert et al. 1998; Wegner et al. 1999; Smith et al. 2000).
We fit simultaneously all emission lines in the red portion of the spectrum (from 6000 to 7000 ) with a single Gaussian profile, one for each line. The line wavelength separation is fixed to the theoretical value, while the intensities are free to vary (except for the 6584,6548 ratio, which is fixed to 3). We repeated the reduction procedure for the blue spectrum to measure the H and 4959,5007 lines. In a few regions, the emission lines show two well-separated peaks and, in these cases, we included a second Gaussian component.
3 Results
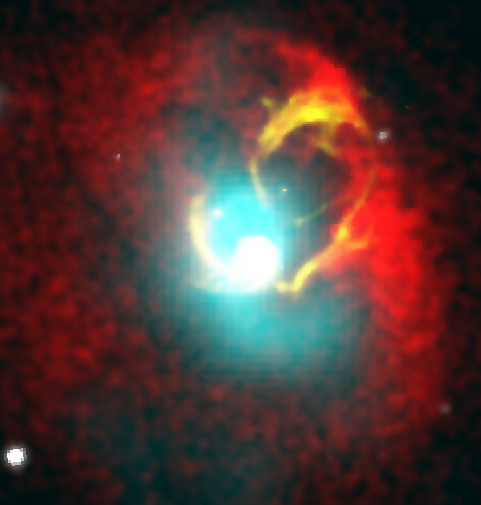
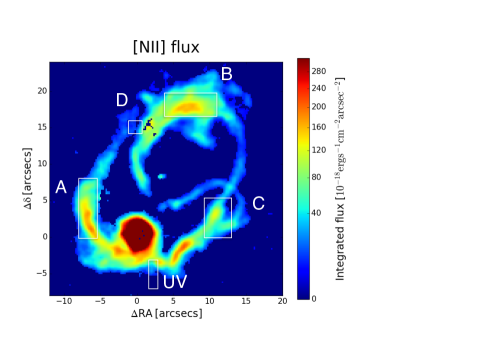
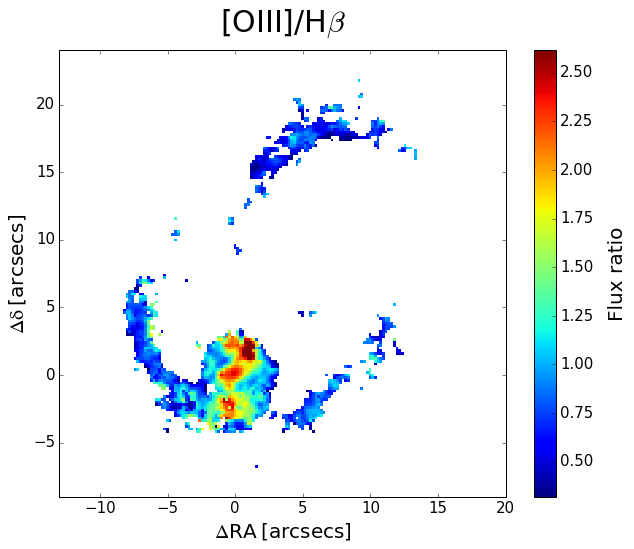
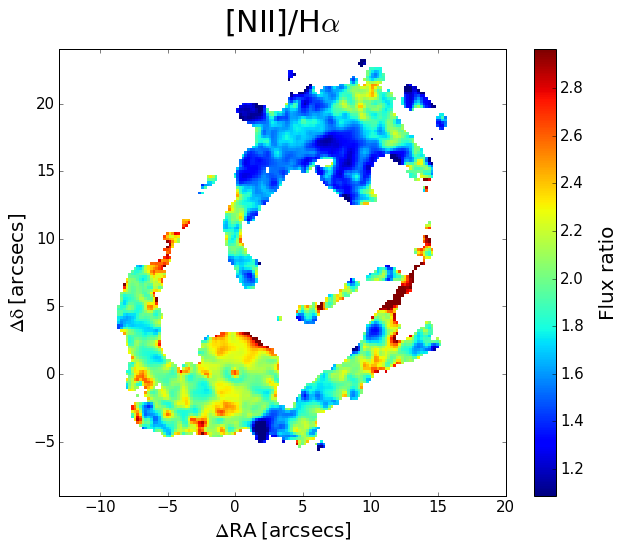
The resulting image obtained in the forbidden line at 6584 Å, the strongest line in our spectra, shows a complex network of filaments enshrouding the northern X-ray cavity (Figs. 1 and 2). The emission line filaments are co-spatial with those traced by the hot gas and by the dust features seen in the Hubble Space Telescope images (Sparks et al. 2000), while they are anti-correlated with the radio emitting plasma. No lines are detected from the southern cavity. We integrated over two square regions centered at 13 NW and SE from the nucleus, and found a flux asymmetry higher than 75.
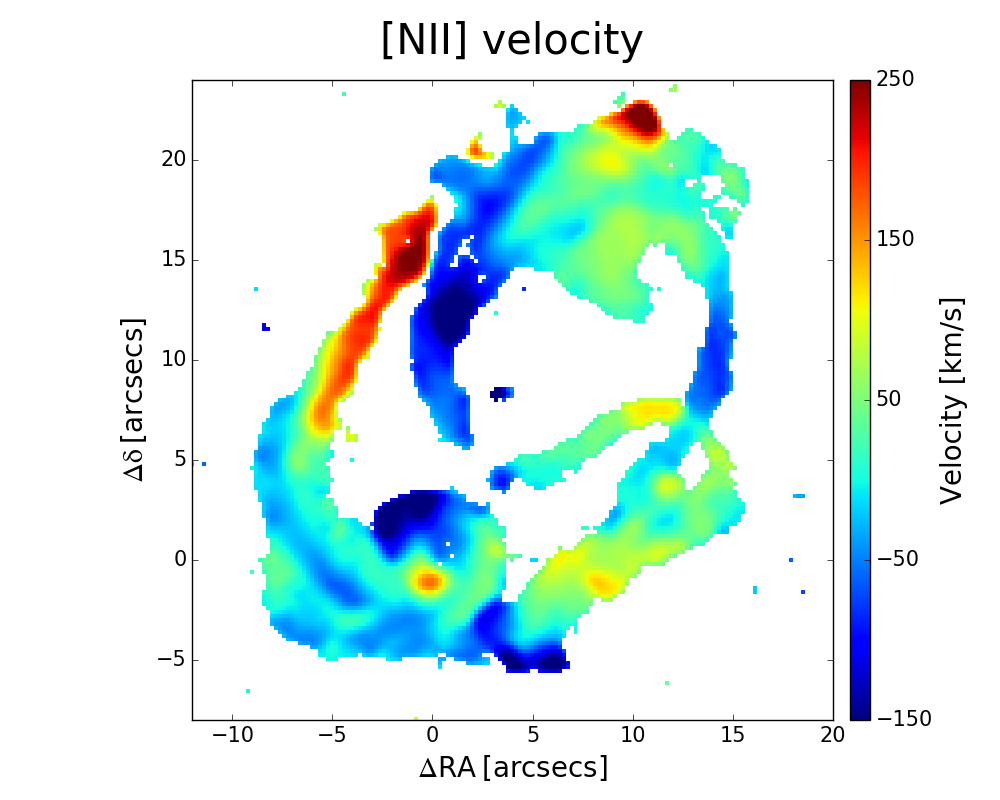
The velocity field of the warm gas mapped by the emission (Fig. 3, left panel) is rather complex, but the hallmarks of the cavity’s expansion are clearly visible. Starting immediately south of the central galaxy, a bright filament (A in Fig. 2) shows a velocity gradient starting from a null velocity and reaching a redshift of (see Fig. 4). This is likely due to the gradual increase in the projected velocity along the line of sight as the filament wraps around the cavity. Filament A intersects another emission line structure (B in Fig. 2) that shows a similar but opposite behavior, reaching a maximum blueshift of . The emission from these two filaments (A behind the cavity, B in front of it) is projected onto the same location in the sky producing a region of split-lines (D in Fig. 2), with a velocity separation of (Fig. 6), an effect that also occurs in other regions of the nebula. This is the characteristic signature of an expanding bubble when both sides are simultaneously visible.
The overall gas kinematics are well reproduced by the toy model of an expanding bubble presented in Fig. 5. The bubble is surrounded by line emitting filaments modeled as parts of thick polar rings with the same radius but different orientations. The model confirms that, in general, we see only one of the two velocity components of an expanding filament (partial ring). In a cartesian coordinate system (x, y, z) we consider spherical coordinates (r, , ). We simulate each filament considering a ring with thickness r, r+dr with null velocity in the galactic nucleus (in x=0, y=0, z=-r). We assume that in each filament the intrinsic expansion velocity is higher toward the pole and decreases at lower latitudes to produce the quasi-spherical shape , with being the angle between the -axis and the direction from the galaxy nucleus (x=0, y=0, z=-r) to the point on the sphere. To project onto the plane of the sky (X,Y) taking into account the orientation with respect to the line of sight, we consider a rotation of the system around the three Euler angles , , obtaining a new system of reference (X,Y, Z) in which the Z-axis is oriented along the line of sight. We locate the origin of the reference frame at the center of the cavity. We obtain a good match to the observation assuming =30∘, =70∘, =35∘ with different ranges for all three filaments. The velocities along the line of sight of the receding and approaching halves are shown in red and blue. Several of the observed features are accounted for: e.g, the increase in velocity along filament A, the highly negative velocity at the pole, the velocity structure of filament B (reaching the maximum speed at the bubble’s center), and the general shallower gradients along the west with respect to the east side.
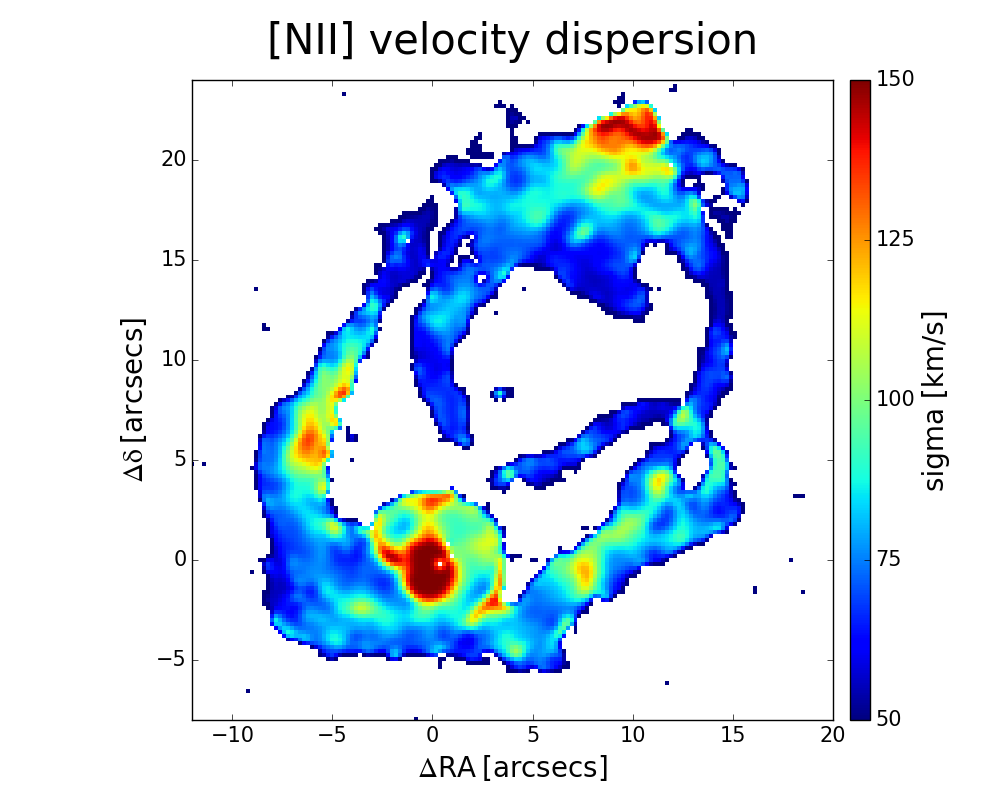
The line widths (Fig. 3, right panel) are generally between 50 and 100 , consistent with MUSE instrumental resolution; higher values are found, besides the central 1 kpc of the host, only over rather small regions and notably at the cavity’s NW tip where line widths up to 150are reached.
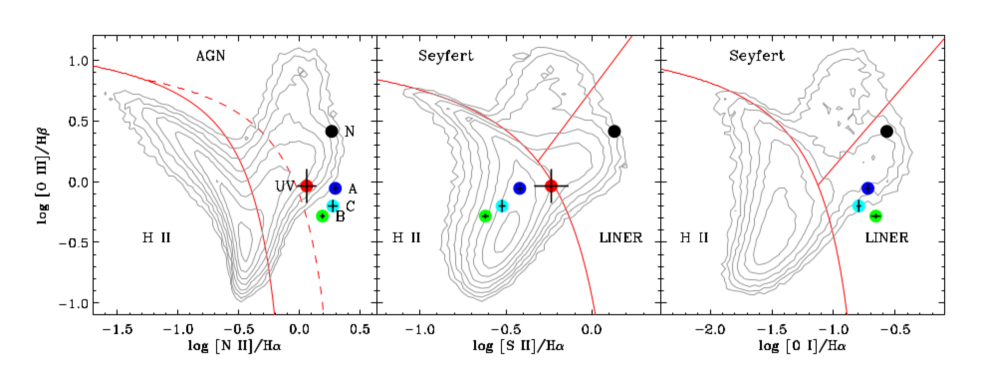
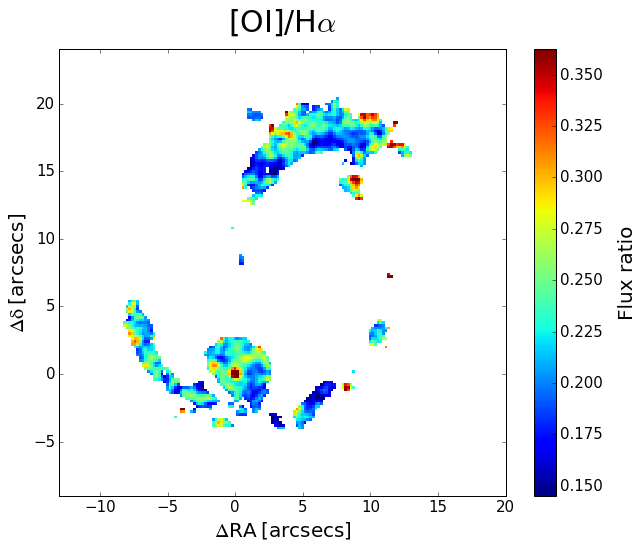
The emission line intensity ratios can be used to distinguish between different ionization mechanism of the nebular gas: H II regions, AGN, or shocks (Baldwin et al. 1981; Dopita & Sutherland 1995). To explore the physical conditions of the WIM, we modeled the other weaker emission lines present in the spectra, i.e., H, H, 5007, 6300, and the doublet at 6716,6731.
In Fig. 7 we show the spectra of regions A, B, and C. In the plane defined by the /H and /H ratio (Fig. 8), their representative points fall into a region not populated by any of the emission line galaxies extracted from the SDSS DR7 data (Kewley et al. 2006; Capetti 2011): in these objects the dominant ionization mechanism is due to the high-energy photon field produced by young stars or by the active nucleus. The inconsistency with the properties of photoionized gas in 3C 317 is confirmed by the other two diagrams where a contradictory classification would be obtained, as star-forming H II regions from the /H ratio and as LINER from /H. This suggests that the gas is ionized by a different mechanism.
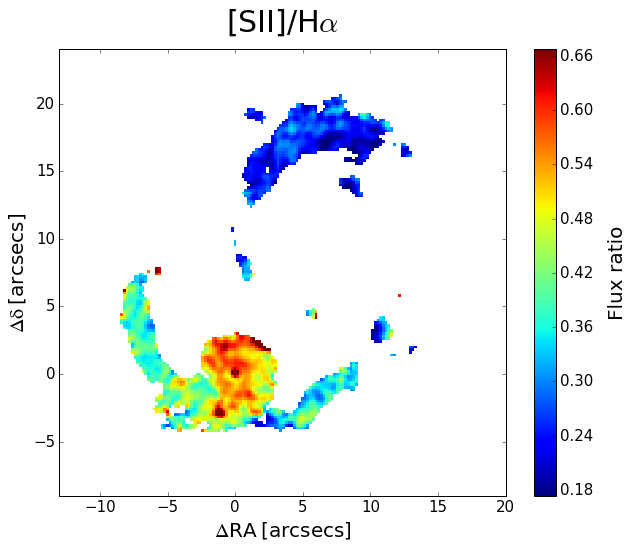
This result is confirmed overall across the nebula because we measured rather constant values (/H, /H, /H, and /H), which again rules out the AGN or young stars as the dominant sources of ionization of the gas. In particular the ratio /H is everywhere higher than 1.2 (see Fig. 9), inconsistently with the values predicted for and observed in star-forming regions (Kewley et al. 2001). The only exception is a small area (located 2 S and 4 W of the host where /H is 0.8), which we discuss in more detail in Sect. 4.
We also estimated the gas density from the ratio of the lines at 6716 and 6731 (Osterbrock 1989) in the same three regions of the nebula considered above, obtaining in region A, in region B, and in region C. By adopting a temperature of 104 K, the corresponding gas densities are and in C and A, respectively, while only an upper limit of can be set on region B.
The total mass of the ionized gas can be estimated as
where is the luminosity of the H emission line (Osterbrock 1989). Adopting a density of we integrated the H emission line map (excluding a circular region of 4 of radius centered on the host galaxy and assuming ), finding a total mass of M⊙. We then estimated the total kinetic energy of the gas as , where is the mass estimated in each spatial bin and is the corresponding observed velocity. Integrating all over the nebula we derive a total kinetic energy in the WIM of erg. In this calculation there are two main sources of uncertainty: 1) the effects of projection on the velocity field and 2) the assumption on the gas density value because in some regions the doublet lines ratio is close to the low-density limit value and only returns to upper limits for the density in region B. The reported gas mass and kinetic energy are likely to be underestimated and should only be considered an order of magnitude estimate. These values indicate that the acceleration of the WIM gas only requires the conversion of a small fraction () of the total energy injected into the ISM by the AGN ( erg, Bîrzan et al. 2004), thus not representing a significant demand for the efficiency of the process of energy exchange. However, the gas in the warm phase represents only a very small fraction of the ISM, which is by far dominated by the hot phase and, in many brightest cluster galaxies (BCGs), also has an important contribution of molecular gas (e.g., Salomé & Combes 2003).
4 Discussion
The expansion rate of the cavities inflated by the radio lobes cannot be measured from X-ray observations: both the age and the power required are derived from indirect and model-dependent methods. MUSE observations instead enable us to directly measure the expansion speed of the cavity in A2052. The line emitting gas is located at the edges of the northern cavity and it moves with an ordered velocity field tracing a quasi-spherical outflow. The maximum observed speed is 265 measured at the location of the A filament, 10 kpc from the nucleus. This value is lower with respect to the estimates obtained from X-ray observations, (Bîrzan et al. 2004). However, since the optical nebula only partly covers the cavity we might still suffer from projection effects. Furthermore, the X-ray data return an average of the expansion speed over its lifetime, while the optical data are instantaneous measurements and the expansion of over-pressured radio lobes slows with time (Begelman & Cioffi 1989). A similar comparison between optical and X-ray observations should be extended to other similar sources to further explore this issue.
We found that while the emission line ratios on the nucleus are typical of a LINER, in the filaments they are inconsistent with ionization from the AGN or young stars. The transition from the nuclear LINER spectrum to that typical of the nebula occurs at the very onset of the filaments, at 3 kpc from the nucleus. This is clearly marked by a decrease in /H from the central value of to and in /H from to 0.3. At this distance the AGN ionization leaves place for a different mechanism. There are two possible alternatives: ionization due to slow shocks (Dopita & Sutherland 1995) or collisional heating from cosmic rays (Ferland et al. 2008, 2009; Fabian et al. 2011). The small width of the emission lines, , argues against the importance of shocks particularly noting that the broader lines are found in regions of large velocity gradients and where different filaments intersect, thus favoring ionization from energetic particles.
Various techniques provide similar indications for a modest level of star formation (yr-1) in the central regions of UGC 9799 (Crawford et al. 1999; Blanton et al. 2003; O’Dea et al. 2008). In addition, a filament of UV emission extending from 4 to 6 kpc SW of the nucleus is interpreted as a star-forming region with a rate of yr-1 (Martel et al. 2002). Based on our results, we can conclude that star formation does not have a significant impact on the line ratios and on the gas physical conditions. Nonetheless, the lowest value of /H over the whole nebula, 0.8, is found at the location of the brightest UV knots. The integrated spectrum of this region is still characteristic of LINERs, but its representative point in the diagnostic diagrams is located close to the boundary of [H II] objects, likely due to the contribution of this star-forming region.
The depth of the MUSE observations of A2052 allowed us to set stringent limits on any line flux from the southern side of the galaxy, with an asymmetry higher than a factor 75 with respect to the northern side. This result has implications on the origin and evolution of the warm and cold phases of its ISM because the extreme differences in line emission contrast with the symmetry of the radio and starlight. In X-rays the morphology is also rather symmetric: within the same regions on which we estimated the line asymmetry, the number counts in the Chandra image returns a ratio of 1.5. The northern cavity also shows a temperature a factor of 2 lower than on the south side, with the lowest temperature found cospatial with the brightest line and X-ray regions (Blanton et al. 2011). Our results represent a significant new ingredient for modeling the interaction between the outflowing plasma and the external medium.
ALMA observations of central cluster galaxies have revealed a close association between the X-ray cavities, H emission, and the molecular gas (McNamara et al. 2014; Russell et al. 2017; McDonald et al. 2012). A large amount of cold molecular gas () is common in BCG galaxies (e.g., Edge 2001; Salome&Combes 2003), but the origin of this gas is uncertain. A possible explanation is that it is produced by the cooling of the hot plasma compressed and uplifted by the expanding bubbles. Alternative scenarios exist, for example the lifting of dense gas out of the galaxy or the deposition of cold gas as a result of a merger or a fly-by encounter. The last possibility seems unlikely because it requires an almost radial orbit at low velocity. The information on the distribution of the cold molecular gas in 3C 317 would be of great importance in this respect, but it is still currently not available.
5 Summary and conclusion
MUSE data have provided new and detailed insights into the physical properties of the WIM of UGC 9799, the central galaxy in the Abell cluster 2052, with full 3D coverage of the X-ray cavities. The ionized gas forms a filamentary structure surrounding the northern radio lobe. No emission is seen instead on the southern side with an asymmetry between the sides higher than a factor 75.
The gas velocity field is indicative of an expanding nebula and we found regions where the emission lines are split, marking the locations where the two sides project onto each other. The maximum observed velocity is 265 . The expansion speed of the nebula derived from these observations is a factor of 2 lower than previous indirect estimates based on X-ray data. However, our measurement represents the instantaneous velocity instead of the value averaged across its whole lifetime.
From optical emission lines we also measured gas density (up to 270 cm-3), estimated its mass (on the order of one million solar masses) across the cavity and kinetic energy (on the order of erg). The emission line ratios reveal that the warm gas is photoionized by the AGN only within the central kpc, while they are inconsistent with AGN or ionization of young stars at greater distances. Because the emission lines are generally quite narrow, 50 – 100 , shock ionization appears unlikely, favoring ionization from cosmic rays instead.
The kinematics of the WIM described above clearly indicates that the radio source has a profound impact on the external medium, confirming that radio mode feedback is operating in A2052. However, the WIM is just the tip of the iceberg of the various ISM phases. The X-ray data indicate that of the tenuous hot gas have been displaced. Furthermore, it is likely that UGC 9799 harbors a large amount of cold and molecular gas (), as commonly observed in the galaxies at the center of cluster. The interplay between all phases of the ISM and the relativistic radio plasma is a very complex phenomenon. The MUSE data provide us with detailed information on the ionized gas. When coupled with those that can be derived in the other observing bands these observations can be used to proceed toward a comprehensive description of the energy exchange between the AGN and the surrounding gas, tackling the issues of the origin, acceleration, and ultimate fate of the cold and warm gas clouds.
Acknowledgements.
We thank the referee for his/her constructive report. Based on observations made with ESO Telescopes at the La Silla Paranal Observatory under program ID 097.B-0766(A). This research has made use of data obtained from the Chandra Data Archive. The National Radio Astronomy Observatory is a facility of the National Science Foundation operated under cooperative agreement by Associated Universities, Inc. Funding for SDSS has been provided by the Alfred P. Sloan Foundation, the Participating Institutions, the National Science Foundation, and the U.S. Department of Energy Office of Science. B.B. acknowledge financial contribution from the agreement ASI-INAF I/037/12/0.References
- Baldwin et al. (1981) Baldwin, J. A., Phillips, M. M., & Terlevich, R. 1981, PASP, 93, 5
- Baum et al. (1988) Baum, S. A., Heckman, T. M., Bridle, A., van Breugel, W. J. M., & Miley, G. K. 1988, ApJS, 68, 643
- Begelman & Cioffi (1989) Begelman, M. C. & Cioffi, D. F. 1989, ApJ, 345, L21
- Bîrzan et al. (2004) Bîrzan, L., Rafferty, D. A., McNamara, B. R., Wise, M. W., & Nulsen, P. E. J. 2004, ApJ, 607, 800
- Bîrzan et al. (2012) Bîrzan, L., Rafferty, D. A., Nulsen, P. E. J., et al. 2012, MNRAS, 427, 3468
- Blanton et al. (2011) Blanton, E. L., Randall, S. W., Clarke, T. E., et al. 2011, ApJ, 737, 99
- Blanton et al. (2003) Blanton, E. L., Sarazin, C. L., & McNamara, B. R. 2003, ApJ, 585, 227
- Blanton et al. (2001) Blanton, E. L., Sarazin, C. L., McNamara, B. R., & Wise, M. W. 2001, ApJ, 558, L15
- Buttiglione et al. (2010) Buttiglione, S., Capetti, A., Celotti, A., et al. 2010, A&A, 509, A6
- Capetti (2011) Capetti, A. 2011, A&A, 535, A28
- Cappellari & Copin (2003) Cappellari, M. & Copin, Y. 2003, MNRAS, 342, 345
- Carniani et al. (2016) Carniani, S., Marconi, A., Maiolino, R., et al. 2016, A&A, 591, A28
- Crawford et al. (1999) Crawford, C. S., Allen, S. W., Ebeling, H., Edge, A. C., & Fabian, A. C. 1999, MNRAS, 306, 857
- Dopita & Sutherland (1995) Dopita, M. A. & Sutherland, R. S. 1995, ApJ, 455, 468
- Fabian (2012) Fabian, A. C. 2012, ARA&A, 50, 455
- Fabian et al. (2011) Fabian, A. C., Sanders, J. S., Williams, R. J. R., et al. 2011, MNRAS, 417, 172
- Falcón-Barroso et al. (2011) Falcón-Barroso, J., Sánchez-Blázquez, P., Vazdekis, A., et al. 2011, A&A, 532, A95
- Ferland et al. (2008) Ferland, G. J., Fabian, A. C., Hatch, N. A., et al. 2008, MNRAS, 386, L72
- Ferland et al. (2009) Ferland, G. J., Fabian, A. C., Hatch, N. A., et al. 2009, MNRAS, 392, 1475
- Heckman (1980) Heckman, T. M. 1980, A&A, 87, 152
- Heckman et al. (1989) Heckman, T. M., Baum, S. A., van Breugel, W. J. M., & McCarthy, P. 1989, ApJ, 338, 48
- Katgert et al. (1998) Katgert, P., Mazure, A., den Hartog, R., et al. 1998, A&AS, 129, 399
- Kewley et al. (2001) Kewley, L. J., Dopita, M. A., Sutherland, R. S., Heisler, C. A., & Trevena, J. 2001, ApJ, 556, 121
- Kewley et al. (2006) Kewley, L. J., Groves, B., Kauffmann, G., & Heckman, T. 2006, MNRAS, 372, 961
- Kormendy & Ho (2013) Kormendy, J. & Ho, L. C. 2013, ARA&A, 51, 511
- Maiolino et al. (2012) Maiolino, R., Gallerani, S., Neri, R., et al. 2012, MNRAS, 425, L66
- Martel et al. (2002) Martel, A. R., Sparks, W. B., Allen, M. G., Koekemoer, A. M., & Baum, S. A. 2002, AJ, 123, 1357
- McDonald et al. (2012) McDonald, M., Veilleux, S., & Rupke, D. S. N. 2012, ApJ, 746, 153
- McDonald et al. (2010) McDonald, M., Veilleux, S., Rupke, D. S. N., & Mushotzky, R. 2010, ApJ, 721, 1262
- McNamara et al. (2014) McNamara, B. R., Russell, H. R., Nulsen, P. E. J., et al. 2014, ApJ, 785, 44
- McNamara et al. (2000) McNamara, B. R., Wise, M., Nulsen, P. E. J., et al. 2000, ApJ, 534, L135
- Morganti et al. (1993) Morganti, R., Killeen, N. E. B., & Tadhunter, C. N. 1993, MNRAS, 263, 1023
- O’Dea et al. (2008) O’Dea, C. P., Baum, S. A., Privon, G., et al. 2008, ApJ, 681, 1035
- Osterbrock (1989) Osterbrock, D. E. 1989, Astrophysics of gaseous nebulae and active galactic nuclei
- Panagoulia et al. (2014) Panagoulia, E. K., Fabian, A. C., Sanders, J. S., & Hlavacek-Larrondo, J. 2014, MNRAS, 444, 1236
- Russell et al. (2017) Russell, H. R., McDonald, M., McNamara, B. R., et al. 2017, ApJ, 836, 130
- Salomé & Combes (2003) Salomé, P. & Combes, F. 2003, A&A, 412, 657
- Smith et al. (2004) Smith, R. J., Hudson, M. J., Nelan, J. E., et al. 2004, AJ, 128, 1558
- Smith et al. (2000) Smith, R. J., Lucey, J. R., Hudson, M. J., Schlegel, D. J., & Davies, R. L. 2000, MNRAS, 313, 469
- Sparks et al. (2000) Sparks, W. B., Baum, S. A., Biretta, J., Macchetto, F. D., & Martel, A. R. 2000, ApJ, 542, 667
- Spinrad et al. (1985) Spinrad, H., Marr, J., Aguilar, L., & Djorgovski, S. 1985, PASP, 97, 932
- Swinbank et al. (2015) Swinbank, A. M., Vernet, J. D. R., Smail, I., et al. 2015, MNRAS, 449, 1298
- Vazdekis et al. (2010) Vazdekis, A., Sánchez-Blázquez, P., Falcón-Barroso, J., et al. 2010, MNRAS, 404, 1639
- Wegner et al. (1999) Wegner, G., Colless, M., Saglia, R. P., et al. 1999, MNRAS, 305, 259