Magnetic braids in eruptions of a spiral structure in the solar atmosphere
Abstract
We report on high-resolution imaging and spectral observations of eruptions of a spiral structure in the transition region, which were taken with the Interface Region Imaging Spectrometer (IRIS), the Atmospheric Imaging Assembly (AIA) and the Helioseismic and Magnetic Imager (HMI). The eruption coincided with the appearance of two series of jets, with velocities comparable to the Alfvén speeds in their footpoints. Several pieces of evidence of magnetic braiding in the eruption are revealed, including localized bright knots, multiple well-separated jet threads, transition region explosive events and the fact that all these three are falling into the same locations within the eruptive structures. Through analysis of the extrapolated three-dimensional magnetic field in the region, we found that the eruptive spiral structure corresponded well to locations of twisted magnetic flux tubes with varying curl values along their lengths. The eruption occurred where strong parallel currents, high squashing factors, and large twist numbers were obtained. The electron number density of the eruptive structure is found to be cm-3, indicating that significant amount of mass could be pumped into the corona by the jets. Following the eruption, the extrapolations revealed a set of seemingly relaxed loops, which were visible in the AIA 94 Å channel indicating temperatures of around 6.3 MK. With these observations, we suggest that magnetic braiding could be part of the mechanisms explaining the formation of solar eruption and the mass and energy supplement to the corona.
1 Introduction
Several major problems remain puzzling in the field of solar physics, including how the solar magnetic field drives large-scale eruptive phenomena, how the solar wind is generated and accelerated, and how the solar corona is heated to millions of degrees of Kelvin (Shibata & Magara, 2011; Klimchuk, 2006; Tu et al., 2005). Magnetic reconnection, the physical process whereby local magnetic fields are rearranged, converting magnetic energy into kinetic and thermal energy, could be one of the keys to understand these problems (e.g. Priest & Forbes, 2000; Chen, 2011; Shibata & Magara, 2011; Li et al., 2016; Sun et al., 2015; Xue et al., 2016; Fisk, 2003; Tu et al., 2005; Antiochos et al., 2011; Crooker et al., 2012; Su et al., 2013; Klimchuk, 2006; Priest et al., 1998; Schrijver et al., 1998). Proposed by Parker (1983b, a), magnetic braids occur whenever twisted magnetic flux tubes wind around one another, and they are one of the preferred topologies that generate the magnetic reconnection required to power the corona (Parker, 1983b, a, 1988; Schrijver et al., 1998; Schrijver, 2007). A few pieces of evidence in favour of magnetic braiding have come from the high resolution intensity maps of the Sun (i.e., Hi-C observations, Cirtain et al., 2013). However, direct observational evidence remains sparse, because the braiding structures are small and quickly untied at their early stage through reconnection and the resulting heat can be quickly spreading along the magnetic strands, thus difficult to resolve in real observations (Wilmot-Smith et al., 2009; Pontin et al., 2017).
Here, we report on high-resolution observations that show evidence of magnetic braids associated with an eruption of a structure in the solar transition region, with the heating of a bundle of loops and a bulk of plasma flow into the upper solar atmosphere. Based on the present observations, we suggest that magnetic braiding could be part of the mechanisms explaining the three major problems in solar physics.
2 Observations of the active event
The data were collected by the Interface Region Imaging Spectrograph (IRIS, De Pontieu et al., 2014b) and both the Atmospheric Imaging Assembly (AIA, Lemen et al., 2012) and Helioseismic and Magnetic Imager (HMI Schou et al., 2012) aboard the Solar Dynamics Observatory (SDO; Pesnell et al., 2012) on 2014 June 11. The IRIS observations include SJ images sampled in four passbands (1330 Å, 1400 Å, 2796 Å and 2832 Å) with a resolution of 0.35 and cadences of 16 s, 16 s, 16 s and 86 s, respectively. In addition to this, a spectral slit scanned the event repeatedly with 96 steps, 0.35 arcsec step size, and 4 second exposure times to provide the spectral data of the region.
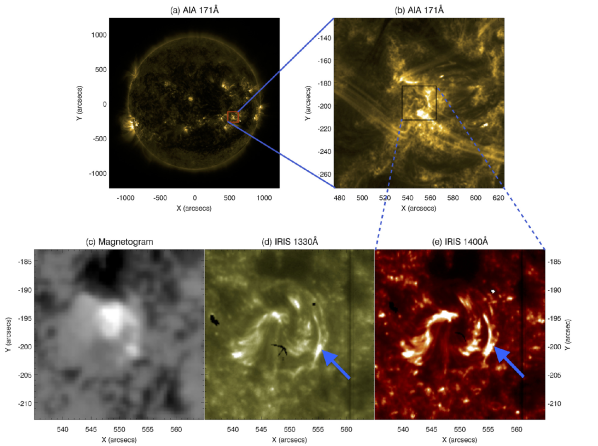
The region of interest was part of an Active Region 12080 as shown in Figure 1. The line-of-sight photospheric magnetogram (Figure 1c) displays some kilo-Gauss positive (white) polarity magnetic fields surrounded by negative (black) polarity. IRIS data show a spiral structure in the 1330 Å (25 000 K, see Figure 1d) and 1400 Å (80 000 K, see Figure 1e) passbands (representative of the transition region). We suspect that such spiral structure could have formed via some swirling motion in the centroid, as similar as that have been observed in such as macrospicules (Kamio et al., 2010), network magnetic fields (Zhang & Liu, 2011), tornados and giant-tonardos (e.g. Li et al., 2012; Su et al., 2012; Wedemeyer-Böhm et al., 2012; Wedemeyer et al., 2013) and swirls (e.g. Wedemeyer-Böhm & Rouppe van der Voort, 2009; De Pontieu et al., 2014a) in the solar atmosphere. To identify such swirling motion (if any), one should require high resolution chromospheric data (such as H) that are not available with the current data. However, its formation mechanism is not the scope of the present study. The spiral structure is connected to a remote region by a large loop system that is clearly seen in the coronal images (see Figure 2). The structure was actively evolving (see the animations 1–3), and one of its eruptions on June 11 2014 was recorded by the instruments above. A timeline of the eruption can be found in Table LABEL:tab_evolution. The eruption occurred at one “spiral arm” of the structure, which manifests as a cluster of magnetic loops that are bundled together (see Figures 1&3 and the online animation). This provides a favorable environment for magnetic braiding
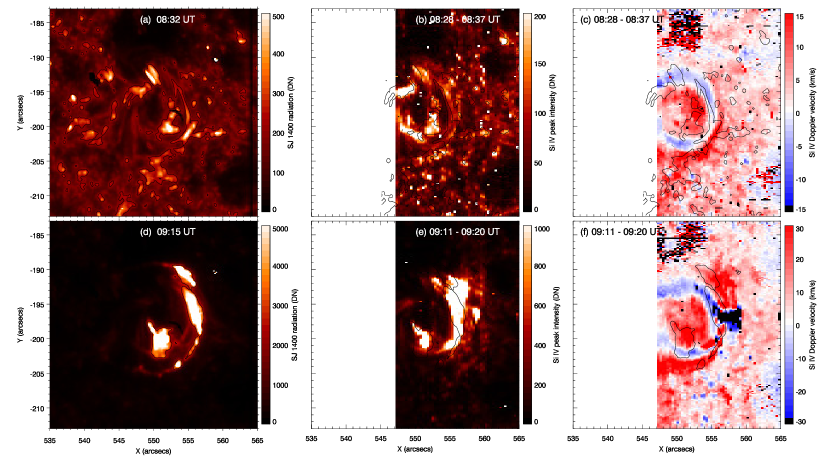
The AIA data reveal that the cluster of eruptive loops also consists of dark filament-like features, possibly containing cool materials (animation 1). The cool filament materials appear to be ejected during the eruption, in a manner similar to many eruptive phenomena on the Sun (Sterling et al., 2015; Hong et al., 2016, 2017; Chen, 2011; Shibata & Magara, 2011). In order to derive the line-of-sight velocity (Doppler velocity) of the region, we fitted Si iv 1403 Å spectral profile with a Gaussian function. The Doppler velocities were obtained by measuring the shift of the fitted profile from the average profile of the whole region (which was assumed to be at rest). The Doppler velocities of the region are shown in Figure 4. The velocity map of the pre-eruption stage indicates at least two intertwined loop systems with flows in opposite directions (Figure 4). As seen from the following analysis, the intersections of these loops correspond to one of the major sites of subsequent magnetic reconnection.
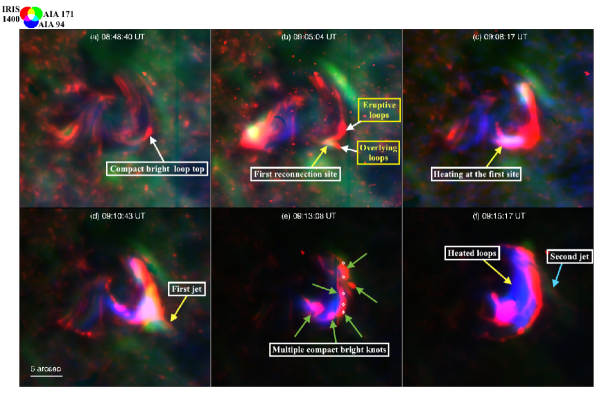
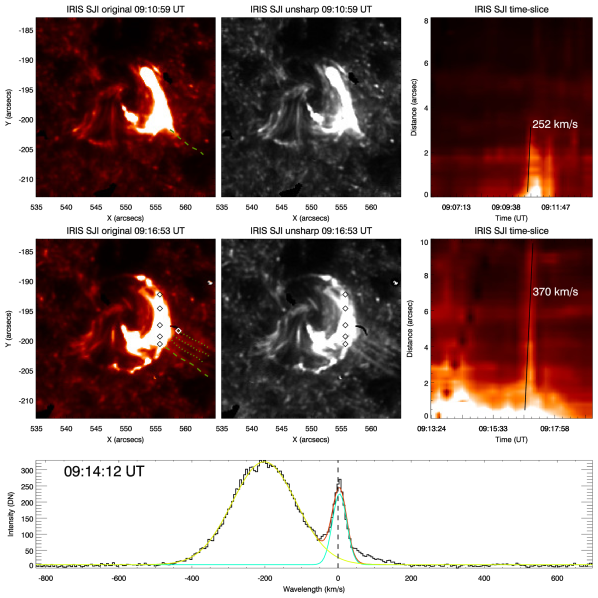
The eruption was initiated by a small brightening occurring at a location where the cluster of bundled loops crosses another smaller loop system (Figure 5b–c). This small activity is very likely a result of magnetic reconnection. This is evidenced by the heating in this region (Figure 5c) as well as a small bright blob moving away from the crossing point toward the loop top (animation 2). The eruption of the event started while the moving blob reached the loop top (Figure 5 and animations 1–2). This eruption generated upflows of a bulk of filament-like cool plasmas, which moved along the large loop at a speed of about 250 km s-1 in the plane-of-sky (Figure 5d and Figure 6). The ejected plasmas (hereafter, the first jet) were seen in IRIS and AIA channels corresponding to temperatures higher than 25 000 K, indicating a multi-thermal nature (see animation 1 around 09:11 UT). We suggest that the reconnection released constraints of some over-lying loops, in agreement with the scenario proposed for coronal jets (Pariat et al., 2009). The IRIS spectra showed clear signatures of rising cool plasmas co-spatial with the cluster of bundled loops. This can be seen from absorption (dark) components embedded in the background spectra (see Figure 7). The absorption components are shifted toward the short wavelength, indicating an upflow of cool plasmas at a velocity as large as 100 km s-1 (Figure 7). This is consistent with the imaging data.
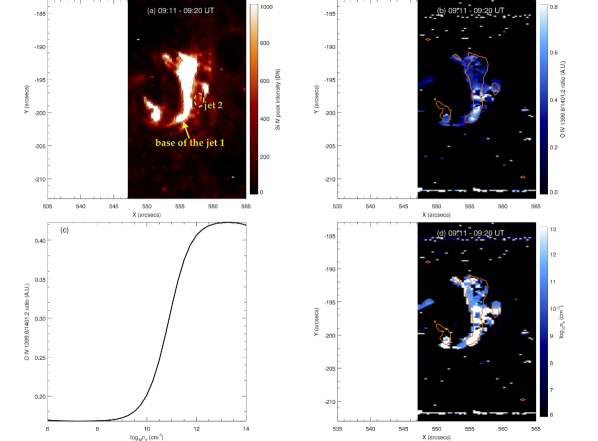
When the spiral structure was erupting, the O iv 1399.8 Å and 1401.2 Å lines were strong enough (with a good signal-to-noise ratio) such that their intensity ratios could be used for electron density () diagnostics. In Figure 8, we present the diagnostics results by using this method. From the model (Figure 8c) given by the CHIANTI atomic database (Dere et al., 1997; Landi et al., 2013), the line ratio is sensitive to the electron density in a density range of to cm-3 when line ratios are from 0.18 to 0.42. While many locations of the event have a line ratio exceeding 0.42 (Figure 8b), the electron density derived from this method gives an estimation at the lower limit (Figure 8d). While the event was eruptive, we find a lower limit of cm-3 for the eruptive loops (Figure 8d).
| 09:03:59 UT | The first reconnection site appears as a small (1) brightening at the cross-section between a small loop system and the main eruptive loops of the event. This brightening can be seen in all the IRIS and AIA passbands (except AIA UV) passbands, but can only be resolved in the AIA 94 Å passband after 09:04:37 UT (i.e. 40 s later than the others). |
| 09:06:03 UT | A bright structure appears at the first reconnection site. It then splits into two blobs that are ejected in opposite directions including one moving toward the top of the main eruptive loops. The blob that moving toward the loop top reaches the original bright loop top around 09:06:35 UT. The moving motion of these two blobs can be clearly seen in IRIS SJ 1330 Å and 1400 Å data. |
| 09:06:40 UT | The brightness of the loop top starts rapidly increasing, initially in the IRIS SJ 1330 Å and 1400 Å images, with no clear response in the AIA EUV channels. |
| 09:07:45 UT | While the brightness of the loop top keeps increasing in the IRIS 1330 Å and 1400 Å passbands, a bright feature appears at the first reconnection site in all AIA EUV passbands. This bright feature shows clear motion moving toward the loop top. |
| 09:10:26 UT | The first plasma ejection that roots at the loop top is present. This ejection can be seen in all the channels including IRIS SJ and AIA UV and EUV passbands without any clear time lag (with the present cadence). |
| 09:12:14 UT | The first plasma ejection and the brightness of the eruptive loops are slightly dimmed. |
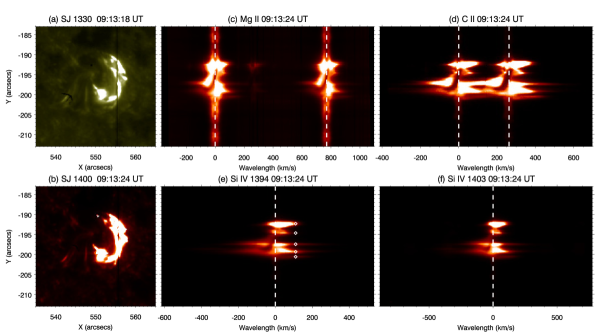
| 09:12:30 UT | The first plasma ejection continues evolving. Dark ejecting features appear at the north of its bright thread, and both dark and bright components of the ejections are rejected in the same direction. The dark component of the ejection is clearly seen in IRIS SJ 1400 Å and AIA 304 Å passbands, and is also captured by the IRIS spectral slit at about 09:13:18 UT. The brightness of the eruptive structure rapidly increases after this ejection. |
| 09:14:28 UT | The eruption of the event reaches its peak intensity, and most AIA EUV channels are saturated. AIA 1700 Å shows two bright features at the footpoints of the eruptive loops. However, there is no sign of plasma ejection at this stage of the eruption. |
| 09:15:33 UT | The second plasma ejection is clearly seen. The initial thread is firstly ejected from a location about 5 north of the loop top (where the first plasma ejection was rooted). |
| 09:16:05 UT | Many other threads of the second plasma ejection are clearly seen, especially in IRIS SJ 1400 Å image. |
| 09:17:58 UT | Down-flowing plasma can be seen in IRIS 1400 Å. While also seen in the AIA 304 Å, 171 Å and 193 Å passbands, the falling back features consist of both bright and dark components. |
| 09:23:53 UT | Viewed in IRIS SJ images, the eruption process ends. The general structure of the feature is similar to its pre-eruption topology, suggesting the event was partially erupted and might only have changed the structure in localised regions. In the AIA 304 Å, 171 Å and 193 Å passbands, we see that the down-falling plasma (with both dark and bright components) is continuing, lasting until 09:30:30 UT. |
| 09:30:30 UT | The end of the eruption. The general structure of the feature is similar to the structure before the eruption. |
3 Signatures of magnetic braids
By following the evolution of the event (Figure 5 and online animations 1–3), we found several pieces of observational evidence of magnetic braids in the cluster of bundled loops. Although other physical processes (e.g. kink instability) might also take place in this transition region loops, we believe magnetic braids are one major cause of the eruption.
The first piece of evidence is that multiple bright knots of a few arcsecs in size spread along the loop during the eruption (Figure 5e). These bright knots occur at the locations where multiple loops are found to be crossing each other (see Figure 3). The localised nature of these bright knots indicates non-uniform heating along the loops. This suggests that the magnetic braiding could be present (Parker, 1988; Schrijver, 2007; Cirtain et al., 2013). The volume of each individual bright knots is estimated to be 1 arcsec cubed according to the high-resolution IRIS SJ images. By applying the value of calculated in Sect. 2 to an electron-proton plasma we find a total mass of g for one knot. Even though the IRIS SJ images have a spatial resolution as high as 0.35, the very compact brightening of the small-scale phenomena (3 times of the resolution) does not allow the instrument to resolve the the fine structuring (including sub-pixel scale) therein due to the point spread function (De Pontieu et al., 2014b). Therefore, the actual volume and mass of the knots maybe much smaller.
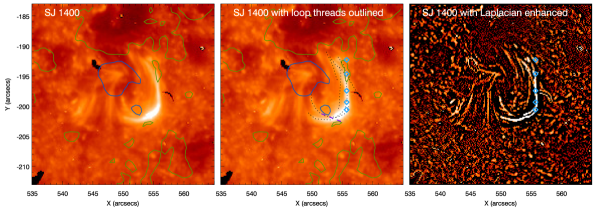
The second piece of evidence in support of the magnetic braiding scenario is the multi-threaded upward flows produced by the eruption. About 5 minutes after the first jet, the second series of jets occurred (Figure 5f and animation 1–2 and Figure 6). These jets consisted of multiple threads of upflows that can be clearly resolved by the high-resolution IRIS slit-jaw (SJ) images (see Figure 6 and animation 1). These multi-threaded loops imply that the cluster of bundled loops is braided with the large loops at several distinct locations. This is also supported by the fact that these jet threads are rooted at the same locations (presumably the braiding positions) where some of the bright knots are found . The speed of one jet is measured as 370 km s-1 in the plane of sky (Figure 6). Even though this value could have errors of 80 km s-1 due to the low temporal resolution of the observations, the speed is consistent with the IRIS spectral observations that reveal an upward velocity of 200 km s-1 along the line-of-sight (see animation 3 around 09:14:12 UT and Figure 6). The high speed of this jet is in line with the magnetic reconnection scenario (Tian et al., 2014), which would suggest outflows at the order of the Alfvén speed (inferred later in next section). Since the plasma ejections are initiated in the transition region, if magnetic braids occur between closed and open field lines, they can supply some mass along open field that may further develop into the solar wind.
The spectroscopic observations provided further evidence of magnetic braiding in the eruption. The transition region spectra of the bright knots displayed very broad profiles with strong intensity enhancements in both wings (animation 3). Such spectra are signatures of bi-directional flows (e.g. Brueckner & Bartoe, 1983; Dere et al., 1989; Innes et al., 1997). They are so-called transition region explosive events. The most plausible scenario explaining the formation of explosive events is magnetic reconnection (e.g. Brueckner & Bartoe, 1983; Dere et al., 1991; Innes et al., 1997; Peter et al., 2014; Huang et al., 2014, 2015; Tian et al., 2016; Huang et al., 2017). The localisation of the explosive events indicates a localised topology of reconnection. This is consistent with the overall picture of magnetic braiding (Parker, 1988). In Figure 7, we present several images of the spectral slit taken for the event. The explosive events are present only in locations of magnetic braids as determined from the imaging data (see Figure 5e). They are also in agreement with the footpoints of the jets (see Figure 6). These observations indicate that the magnetic reconnection occurred at places where the field lines were braided.
4 Three-dimensional field extrapolation
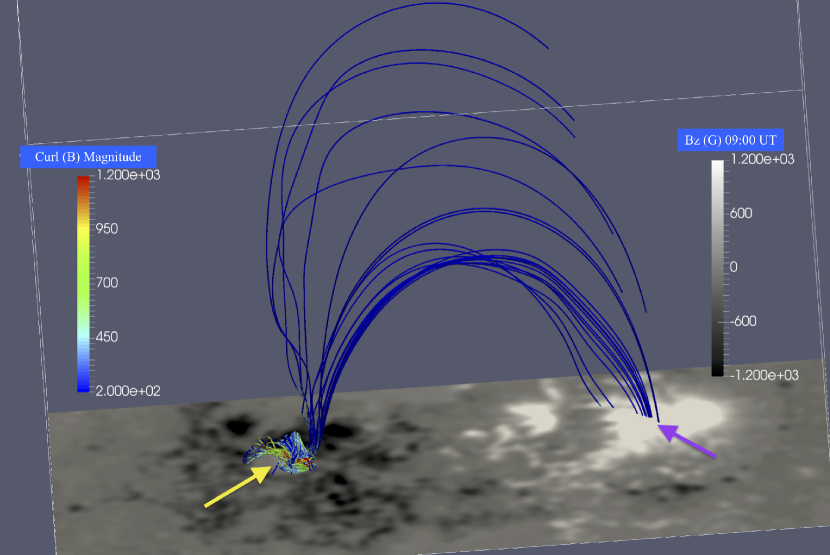
In order to obtain the three-dimensional (3D) magnetic topology of the event, we applied a non-linear force-free field (NLFFF) extrapolation model (Wiegelmann, 2007) on vector magnetic data obtained with HMI and pre-calibrated by the instrument team. The vector magnetic field data use the cylindrical equal area projection (CEA) coordinates (Sun, 2013; Sun et al., 2017). The field-of-view for which the extrapolation was computed includes the whole Active Region (shown in Figure 9). Figure 10 displays a cut-out of the entire extrapolated region, which was selected to highlight the detail of the magnetic field of the eruptive event.
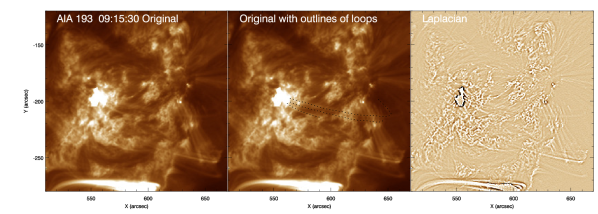
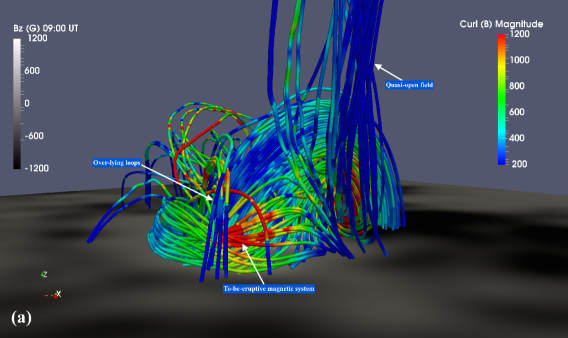
The 3D magnetic field of the region shows that the spiral arms of the spiral structure comprise multiple strands. One of the arms corresponds to the eruptive bundle of loops that was trapped by an over-lying loop system. The 3D magnetic field reveals another loop system that is of a much larger scale (see Figures 9&10). This larger loop system is rooted in the eruptive region and connects to a remote footpoint. It corresponds to the loops that channel the observed jets, and is also seen in AIA 193 Å images in the form of typical coronal loops (Fig. 2). Since the loop system is much larger than the eruptive loops, we consider it as quasi-open.
The curls of the vector magnetic field () along the eruptive loops vary significantly (Figure 10). This implies a complex winding nature of this loop system, because the curl is representative of rotation of the field lines in a local region (determined by the sampling of the data used for the calculus of difference). The curl of the magnetic field is much larger at the loop top, corresponding to a compact bright knot seen in the IRIS SJ observations (see the online animation). Because the curl is proportional to the electric current, a possible interpretation is that the bright knot is representative of a place of strong current, providing an appropriate condition of magnetic reconnection (Priest & Forbes, 2000).
Using the extrapolated data, the Alfvén speed () at the footpoint of the jets can be obtained by in cgs units, where is the magnetic strength and is the density. In our case, is given as 300 G based on the magnetic field extrapolation and is set to be g cm-3 by applying the above value of to an electron-proton plasma. The accuracy of the calculation relies on the measurements of the magnetic strength and the density, which could bring in some uncertainty in our case. Based on our measurements, we obtain an estimate of 380 km s-1 for the Alfvén speed at the footpoint of the jets, comparable to the speed of the jets observed presently. This is consistent with the general picture of magnetic reconnection that suggests an outflow at the oder of the Alfvén speed (Priest & Forbes, 2000).
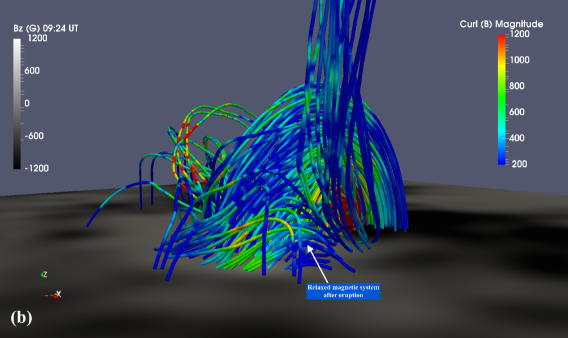
After the reconnection, the loop system is relaxed and the curl values have been reduced (Figure 10 and animation 4). This suggests that the eruption of the twisted flux rope expels the twist from beneath (Wyper et al., 2016; Masson et al., 2017). Current dissipation during this process could heat the local plasmas due to the resistivity therein (Priest & Forbes, 2000). As seen in the AIA 94 Å channel, the plasmas have been heated to at least 6.3 MK (the feature coloured by blue, better viewed in Figure 5f). This agrees with the simulations presented in previous studies (Wilmot-Smith et al., 2010).
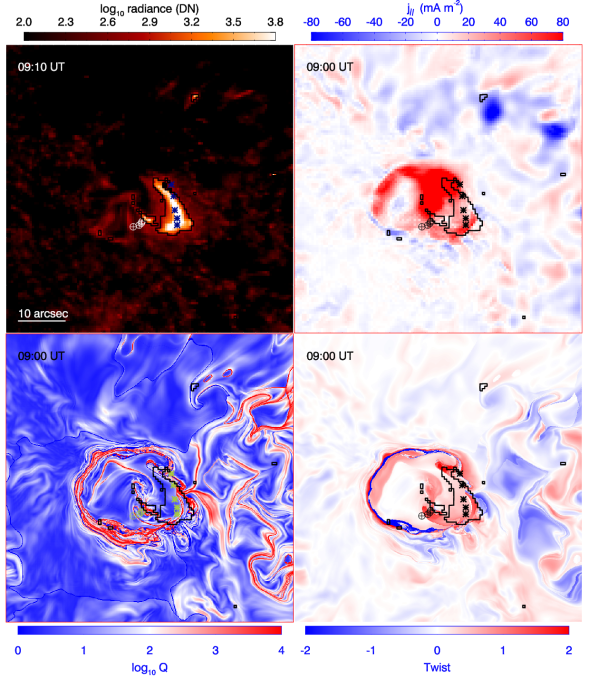
Based on the extrapolated 3D field, we calculate the component of the electric current parallel to the magnetic field () by ignoring the displacement current, i.e.
where is the speed of light, is the vector of the magnetic strength. The squashing factor () and twist number were further derived from the NLFFF results (Liu et al., 2016b). In Figure 11, we display the IRIS SJ 1400 Å image, and the maps of the , and twist number of the region in the CEA coordinates. The high values shown on the map indicate the locations of three-dimensional quasi-separatrix layers (QSLs) at the given height. The twist number measures how many turns two infinitesimally close field lines wind about each other (Liu et al., 2016b). The presence of opposite direction of twists at the same location is a hint of multiple magnetic braids among more than two loop threads. Strong parallel currents are found in this eruption (Figure 11), which are consistent with the simulations of magnetic braids (Wilmot-Smith et al., 2009, 2010). The event is also positioned at regions of large squashing factors and twist number (see Figure 11). This indicates the presence of quasi-separatrix layers (QSLs) and possible braiding of the magnetic field (Liu et al., 2016b). The explosive events identified in the IRIS spectral data are located in regions where the parallel current, value and twist number are relatively high. These analyses are in line with the scenario of magnetic reconnection in magnetic braids (Wilmot-Smith et al., 2009).
The null points were identified by a procedure (Liu et al., 2016a) based on Newton-Raphson method. Five nulls are identified, which are found to group together at a location in the vicinity of the eruptive region and about 2 above the photosphere. Their projections on the photosphere are shown in Figure 11. Considering the overall topology of the Q map showing a circular structure with internal ridge of high Q, this is a classic characteristic associated with the spine and fan structures of a coronal null point (Masson et al., 2009; Pontin et al., 2016). The clustering of null points here could be a result of some instability (Wyper & Pontin, 2014). The first jet observed in the event here could be the result of null point reconnection.
The geometry distribution of the photospheric magnetic flux of this event is similar to some other eruptive phenomena in the solar atmosphere, and most are associated with spine field lines and (quasi-)separatrix dome (e.g. Sun et al., 2013; Masson et al., 2017). In such the magnetic field topologies, plasmoids produced by the magnetic reconnection can introduce a very complex field topology including twisting and braiding, and the localized bright knots in the eruptive phenomena might be associated with unsteady “breakout” reconnection (Sun et al., 2013) of a flux rope from beneath the null point’s separatrix dome (Wyper et al., 2016). Similar processes cannot be ruled out in the event studied here, but the observations do not allow one to judge whether the magnetic braids were the causes or the results of the reconnection.
5 Conclusion and Discussion
In the present study, we report on multi-instrument observations of eruptions that occur in an arm of a spiral structure in the solar atmosphere. The eruptive part of the structure consists of multiple loop threads resolved in the high-resolution IRIS SJ images. The loop threads appear to join in the same location where the most intense eruption occurred, providing a favorable environment for braiding. The eruption produced two series of jets that origin in the transition region, and thus potentially supplies mass to the corona. One ejected cool filament plasma with an apparent speed of 250 km s-1, and the other one consists of well-separated multiple threads with an apparent speed about 370 km s-1, which is comparable to the Alfvén speeds estimated in the footpoint of the jets.
During the eruption, several pieces of evidence of magnetic braiding are revealed, including localized bright knots, multiple jet threads and transition region explosive events. The bright knots, footpoints of the jet threads and transition region explosive events fall into the same locations within the eruptive structures, and this strongly indicates localised magnetic reconnection events in line with the magnetic braiding scenario. This scenario is also supported by the 3D magnetic topology of the event. The 3D extrapolated field reveals a complex twisted magnetic system, in which the curl of the field along the eruptive loops vary significantly. This indicates a complex winding nature of the system. The eruptive event was positioned at a region with strong parallel currents, large squashing factors and twist number, which indicates the presence of quasi-separatrix layers and possible braiding of magnetic field. While these are convincing evidence in favor of magnetic braiding in the eruption, it requires higher-temporal-resolution observation to determine whether the magnetic braids were the causes or the results of the reconnection, and higher-spatial-resolution data to resolve the details in the braiding geometry.
While magnetic-braid-related reconnection is one of the important candidate mechanisms for heating the solar corona (Parker, 1983a, 1988; Klimchuk, 2006; Schrijver, 2007; Cirtain et al., 2013), the observations presented here demonstrate that they might also play a key role in localised energy release during solar eruptions. The magnetic braids, mostly driven by the random motions on the photosphere (Parker, 1983a), could build up magnetic energy stored in magnetic structures of the solar atmosphere (e.g. loops, filaments). This could then be released during an eruption. While it is released via magnetic reconnection, it can provide energy to heat and accelerate plasmas (Parker, 1988). Since the photosphere is constantly buffeted by underlying convections (Parker, 1983a, 1988), magnetic braids should be prevalent throughout the solar atmosphere. Although most magnetic braids may not be resolved by present instruments, their relevant processes could be part of the mechanisms to understand the three major solar physics problems (i.e., the formation of solar eruptions, coronal heating, and the origin of the solar wind).
Acknowledgement: We greatly acknowledge many constructive comments given by the anonymous referees. This research is supported by the National Natural Science Foundation of China (41474150, 41627806, 41574166, 41404135). IRIS is a NASA small explorer mission developed and operated by LMSAL with mission operations executed at NASA Ames Research center and major contributions to downlink communications funded by ESA and the Norwegian Space Center. Courtesy of NASA/SDO, the AIA and HMI science teams and JSOC. ParaView has been used to visualised the magnetic field. Z.H. acknowledges M. Madjarska for encouragement and the Young Scholar program of Shandong University, Weihai (2017WHWLJH07). C.J.N. is thankful to the STFC for the support received to conduct this research. H.T. thanks the Max Planck Partner Group program. T.W. acknowledges DFG-grant WI 3211/4-1.
References
- Antiochos et al. (2011) Antiochos, S. K., Mikić, Z., Titov, V. S., Lionello, R., & Linker, J. A. 2011, ApJ, 731, 112
- Brueckner & Bartoe (1983) Brueckner, G. E., & Bartoe, J.-D. F. 1983, ApJ, 272, 329
- Chen (2011) Chen, P. F. 2011, Living Reviews in Solar Physics, 8, doi:10.1007/lrsp-2011-1
- Cirtain et al. (2013) Cirtain, J. W., Golub, L., Winebarger, A. R., et al. 2013, Nature, 493, 501
- Crooker et al. (2012) Crooker, N. U., Antiochos, S. K., Zhao, X., & Neugebauer, M. 2012, Journal of Geophysical Research (Space Physics), 117, A04104
- De Pontieu et al. (2014a) De Pontieu, B., Rouppe van der Voort, L., McIntosh, S. W., et al. 2014a, Science, 346, 1255732
- De Pontieu et al. (2014b) De Pontieu, B., Title, A. M., Lemen, J. R., et al. 2014b, Sol. Phys., 289, 2733
- Dere et al. (1989) Dere, K. P., Bartoe, J.-D. F., & Brueckner, G. E. 1989, Sol. Phys., 123, 41
- Dere et al. (1991) Dere, K. P., Bartoe, J.-D. F., Brueckner, G. E., Ewing, J., & Lund, P. 1991, J. Geophys. Res., 96, 9399
- Dere et al. (1997) Dere, K. P., Landi, E., Mason, H. E., Monsignori Fossi, B. C., & Young, P. R. 1997, A&AS, 125, doi:10.1051/aas:1997368
- Fisk (2003) Fisk, L. A. 2003, Journal of Geophysical Research (Space Physics), 108, 1157
- Hong et al. (2017) Hong, J., Jiang, Y., Yang, J., Li, H., & Xu, Z. 2017, ApJ, 835, 35
- Hong et al. (2016) Hong, J., Jiang, Y., Yang, J., et al. 2016, ApJ, 830, 60
- Huang et al. (2017) Huang, Z., Madjarska, M. S., Scullion, E. M., et al. 2017, MNRAS, 464, 1753
- Huang et al. (2014) Huang, Z., Madjarska, M. S., Xia, L., et al. 2014, ApJ, 797, 88
- Huang et al. (2015) Huang, Z., Xia, L., Li, B., & Madjarska, M. S. 2015, ApJ, 810, 46
- Innes et al. (1997) Innes, D. E., Inhester, B., Axford, W. I., & Wilhelm, K. 1997, Nature, 386, 811
- Kamio et al. (2010) Kamio, S., Curdt, W., Teriaca, L., Inhester, B., & Solanki, S. K. 2010, A&A, 510, L1
- Klimchuk (2006) Klimchuk, J. A. 2006, Sol. Phys., 234, 41
- Landi et al. (2013) Landi, E., Young, P. R., Dere, K. P., Del Zanna, G., & Mason, H. E. 2013, ApJ, 763, 86
- Lemen et al. (2012) Lemen, J. R., Title, A. M., Akin, D. J., et al. 2012, Sol. Phys., 275, 17
- Li et al. (2016) Li, L., Zhang, J., Peter, H., et al. 2016, Nature Physics, 12, 847
- Li et al. (2012) Li, X., Morgan, H., Leonard, D., & Jeska, L. 2012, ApJ, 752, L22
- Liu et al. (2016a) Liu, R., Chen, J., Wang, Y., & Liu, K. 2016a, Scientific Reports, 6, 34021
- Liu et al. (2016b) Liu, R., Kliem, B., Titov, V. S., et al. 2016b, ApJ, 818, 148
- Masson et al. (2009) Masson, S., Pariat, E., Aulanier, G., & Schrijver, C. J. 2009, ApJ, 700, 559
- Masson et al. (2017) Masson, S., Pariat, É., Valori, G., et al. 2017, A&A, 604, A76
- Pariat et al. (2009) Pariat, E., Antiochos, S. K., & DeVore, C. R. 2009, ApJ, 691, 61
- Parker (1983a) Parker, E. N. 1983a, ApJ, 264, 642
- Parker (1983b) —. 1983b, ApJ, 264, 635
- Parker (1988) —. 1988, ApJ, 330, 474
- Pesnell et al. (2012) Pesnell, W. D., Thompson, B. J., & Chamberlin, P. C. 2012, Sol. Phys., 275, 3
- Peter et al. (2014) Peter, H., Tian, H., Curdt, W., et al. 2014, Science, 346, 1255726
- Pontin et al. (2016) Pontin, D., Galsgaard, K., & Démoulin, P. 2016, Sol. Phys., 291, 1739
- Pontin et al. (2017) Pontin, D. I., Janvier, M., Tiwari, S. K., et al. 2017, ApJ, 837, 108
- Priest & Forbes (2000) Priest, E., & Forbes, T. 2000, Magnetic Reconnection: MHD theory and applications (Cambridge, UK: Cambridge University Press), 612
- Priest et al. (1998) Priest, E. R., Foley, C. R., Heyvaerts, J., et al. 1998, Nature, 393, 545
- Schou et al. (2012) Schou, J., Scherrer, P. H., Bush, R. I., et al. 2012, Sol. Phys., 275, 229
- Schrijver (2007) Schrijver, C. J. 2007, ApJ, 662, L119
- Schrijver et al. (1998) Schrijver, C. J., Title, A. M., Harvey, K. L., et al. 1998, Nature, 394, 152
- Shibata & Magara (2011) Shibata, K., & Magara, T. 2011, Living Reviews in Solar Physics, 8, doi:10.1007/lrsp-2011-6
- Sterling et al. (2015) Sterling, A. C., Moore, R. L., Falconer, D. A., & Adams, M. 2015, Nature, 523, 437
- Su et al. (2013) Su, Y., Veronig, A. M., Holman, G. D., et al. 2013, Nature Physics, 9, 489
- Su et al. (2012) Su, Y., Wang, T., Veronig, A., Temmer, M., & Gan, W. 2012, ApJ, 756, L41
- Sun et al. (2015) Sun, J. Q., Cheng, X., Ding, M. D., et al. 2015, Nature Communications, 6, 7598
- Sun (2013) Sun, X. 2013, ArXiv e-prints, arXiv:1309.2392
- Sun et al. (2013) Sun, X., Hoeksema, J. T., Liu, Y., et al. 2013, ApJ, 778, 139
- Sun et al. (2017) Sun, X., Hoeksema, J. T., Liu, Y., Kazachenko, M., & Chen, R. 2017, ApJ, 839, 67
- Tian et al. (2016) Tian, H., Xu, Z., He, J., & Madsen, C. 2016, ApJ, 824, 96
- Tian et al. (2014) Tian, H., DeLuca, E. E., Cranmer, S. R., et al. 2014, Science, 346, 1255711
- Tu et al. (2005) Tu, C.-Y., Zhou, C., Marsch, E., et al. 2005, Science, 308, 519
- Wedemeyer et al. (2013) Wedemeyer, S., Scullion, E., Rouppe van der Voort, L., Bosnjak, A., & Antolin, P. 2013, ApJ, 774, 123
- Wedemeyer-Böhm & Rouppe van der Voort (2009) Wedemeyer-Böhm, S., & Rouppe van der Voort, L. 2009, A&A, 507, L9
- Wedemeyer-Böhm et al. (2012) Wedemeyer-Böhm, S., Scullion, E., Steiner, O., et al. 2012, Nature, 486, 505
- Wiegelmann (2007) Wiegelmann, T. 2007, Sol. Phys., 240, 227
- Wilmot-Smith et al. (2009) Wilmot-Smith, A. L., Hornig, G., & Pontin, D. I. 2009, ApJ, 696, 1339
- Wilmot-Smith et al. (2010) Wilmot-Smith, A. L., Pontin, D. I., & Hornig, G. 2010, A&A, 516, A5
- Wyper et al. (2016) Wyper, P. F., DeVore, C. R., Karpen, J. T., & Lynch, B. J. 2016, ApJ, 827, 4
- Wyper & Pontin (2014) Wyper, P. F., & Pontin, D. I. 2014, Physics of Plasmas, 21, 102102
- Xue et al. (2016) Xue, Z., Yan, X., Cheng, X., et al. 2016, Nature Communications, 7, 11837
- Zhang & Liu (2011) Zhang, J., & Liu, Y. 2011, ApJ, 741, L7