The origin of multi-TeV flares from the nearest blazar
Markarian 421
Abstract
Markarian 421 is a high-peaked BL Lac object and it has undergone many strong outbursts since its discovery as a TeV source in 1992. Markarian 421 has been stud- ied intensively and was observed by various Cherenkov tele- scope arrays ever since. The outbursts of April 2004 observed by the Whipple telescope and of February 2010 by the HESS telescopes are explained well in this work by using the photohadronic model. To account for the attenuation of these high- energy gamma-rays by the extragalactic background light (EBL), we use template EBL models. The intrinsic spectrum of each epoch is different even though the high-energy protons have almost the same spectral index. We observe that this difference in intrinsic spectra is due to the change in the spectral index of the low-energy tail of the synchrotron self Compton (SSC) photons during different epochs of flaring. Our results show that the contemporaneous multiwavelength observations, particularly in the low-energy tail region of the SSC emission of the source, are important in explaining the flaring phenomenon.
I Introduction
The extragalactic very high energy (VHE, GeV) gamma-rays undergo energy dependent attenuation en route to Earth by the intervening extragalactic background light (EBL) through electron-positron pair productionStecker:1992wi . This interaction process not only attenuates the absolute flux but also significantly changes the VHE emission spectrum. The diffuse EBL contains a record of the star formation history of the Universe. A proper understanding of the EBL spectral energy distribution (SED) is very important for the correct interpretation of the deabsorbed VHE spectrum from the source. The direct measurement of the EBL is very difficult with high uncertainties mainly due to the contribution of zodiacal lightHauser:2001xs ; Chary:2010dc , and galaxy counts result in a lower limit since the number of unresolved sources (faint galaxies) is unknownMadau-Po:2000 . Keeping in mind the observational constraints, several approaches with different degrees of complexity have been developed to calculate the EBL density as a function of energy for different redshiftsDominguez:2010bv ; Inoue:2012bk ; Franceschini:2008tp ; Kneiske:2002wi ; Stecker:2005qs ; Stecker:2016fsg ; Orr:2011ha ; Primack:2005rf . Mainly three types of EBL models exist: backward and forward evolution models and semi-analytical galaxy formation models with a combination of information about galaxy evolution and observed properties of galaxy spectra. In the backward evolution modelsStecker:2005qs , one starts from the observed properties of galaxies in the local universe and evolve them from cosmological initial conditions or extrapolating backward in time using parametric models of the evolution of galaxies. This extrapolation induces uncertainties in the properties of the EBL which increases at high redshifts. On the contrary, the forward evolution modelsFranceschini:2008tp ; Kneiske:2002wi predict the temporal evolution of galaxies forward in time starting from the cosmological initial conditions. Finally, semi-analytical models have been developed which follow the formation of large scale structures driven by cold dark matter in the universe by using the cosmological parameters from observations. This method also accounts for the merging of the dark matter halos and the emergence of galaxies which form as baryonic matter falls into the potential wells of these halos.
Blazars are a subclass of AGN and the dominant extra galactic population in -raysAcciari:2010aa . These objects show rapid variability in the entire electromagnetic spectrum and have non-thermal spectra produced by the relativistic jet of plasma oriented close to the observers line of sightUrry:1995mg . The jets are powered by matter accretion onto supermassive black hole. The spectral energy distribution (SED) of these blazars has a double peak structure in the plane. The low energy peak corresponds to the synchrotron radiation from a population of relativistic electrons in the jet and the high energy peak believed to be due to the synchrotron self Compton (SSC) scattering of the high energy electrons with their self-produced synchrotron photons Dermer:1993cz ; Sikora:1994zb . As leptons () are responsible for the production of the SED, this is called the leptonic model and in general is very successful in explaining the multiwavelength emission from blazars and FR I galaxiesFossati:1998zn ; Ghisellini:1998it ; Abdo:2010fk ; Roustazadeh:2011zz .
Blazars detected in VHE are predominantly high energy peaked blazars (HBLs) whose synchrotron peak lies in the UV to X-ray energy range and the inverse Compton peak is in the GeV-TeV energy rangeFossati:1998zn ; Urry:1995mg . Flaring seems to be a major activity of these blazars which is unpredictable and switches between quiescent and active states involving different time scales and flux variabilitiesAlbert:2007zd ; Aharonian:2007ig ; Ghisellini:2008gn ; Ghisellini:2008us ; Resconi:2009sw . However, broadly speaking the flaring mechanism is unknown.
From the continuous monitoring and dedicated multi-wavelength observations of the nearest HBLs Markarian 421 (Mrk 421, z=0.0308Gorham:1999en ; Ulrich:1975ApJ ), Mrk 501 (z=0.033 Ulrich:1975ApJ ; Stickel:1993aap ) and 1ES 1959+650 (z=0.047Schanchter:1993ApJ ), several major multi-TeV flares have been observedTluczykont:2011gs ; Aharonian:2000nr ; Aliu:2016kzx ; Chandra:2017vkw ; Santander:2017wjl . Strong temporal correlation in different wavebands, particularly in X-rays and VHE -rays has been observed in some flaring events, however, in some other flaring events no such correlation is observed Krawczynski:2003fq ; Blazejowski:2005ih , which seems unusual for a leptonic originKatarzynski:2006db ; Fossati:1998zn ; Ghisellini:1998it ; Roustazadeh:2011zz of the multi-TeV emissions and needs to be addressed through other alternative mechanismsMucke:1998mk ; Mucke:2000rn ; Cao:2014nia ; Zdziarski:2015rsa ; Essey:2010er ; Ghisellini:2004ec ; Tavecchio:2008be .
Mrk 421 is the first extragalactic source detected in the multi-TeV domainPunch:1992xw and it is one of the fastest varying -ray sources. There are other BL Lac objects with lower redshifts than Mrk 421, however, these objects were never reported as TeV emitters and could have been misclassifiedVeronCetty:2006zz . Also, there are many BL Lacs with unknown redshifts.
Several large flares of Mrk 421 were observed in 2000 - 2001Okumura:2002jw ; Amenomori:2003dy ; Fossati:2007sj and 2003 - 2004Cui:2004wi ; Blazejowski:2005ih . During April 2004, large flare took place both in the X-rays and in the TeV energy band. The source was observed simultaneously at TeV energies with the Whipple 10 m telescope and at X-ray energies with the Rossi X-ray Timing Explorer (RXTE)Blazejowski:2005ih . It was also observed simultaneously in radio and optical wavelengths. During the flaring period, the TeV flares had no coincident counterparts at longer wavelengths and it was observed that the X-ray flux reached its peak 1.5 days before the TeV flux did during this outburst. The orphan TeV flare in 1ES 1959+650 of 2002Krawczynski:2003fq had also no simultaneous X-ray counterpart and the variation pattern in X-rays were similar to the one observed in Mrk 421. A strong outburst in multi-TeV energy in Mrk 421 was first detected by VERITAS telescopes on 16th of February 2010 and follow up observations were done by the HESS telescopes during four subsequent nightsTluczykont:2011gs .
In the framework of a six month long multi-instrument campaign, the MAGIC telescopes observed VHE flaring from Mrk 421 on 25th of April 2014 and the flux (above 300 GeV) was about 16 times brighter than the usual one. This triggered a joint ToO program by XMM-Newton, VERITAS, and MAGIC. These three instruments individually observed approximately 3 h each day on April 29, May 1, and May 3 of 2014Abeysekara:2016qwu . The simultaneous VERITAS-XMM-Newton observation is published recently and it is shown that the observed multiwavelength spectra are consistent with one-zone synchrotron self-Compton modelAbeysekara:2016qwu . However, the details of the large flare observed on 25th April by MAGIC are not yet publicly available.
Mrk 421 being the nearest HBL, the VHE gamma-rays can be attenuated the least and in principle presently operating Cherenkov telescopes will be able to observe higher energy photons. At the same time, different EBL models can also be compared. So Mrk 421 can be used as an example to study the intrinsic emission mechanism in the multi-TeV energy range from the nearest blazars and test different EBL models.
From the above various VHE emission epochs, we shall analyze the following events: (1) the flare of April 2004Blazejowski:2005ih and (2) the flare of February 2010Balokovic:2015dnz . Both the experimental data sets are public and have multiwavelength information, which is important to improve the photohadronic fitting of the flare. Also both flares were having high flux which is important for our study. The flare of 2004 was analyzed by Sahu et al.Sahu:2015tua where EBL correction was not considered. In this work we include the EBL correction for the same 2004 data. For our analysis of these flaring events, we will be using the photohadronic model, a detailed account of this model is given in refs. Sahu:2012wv ; Sahu:2013ixa ; Sahu:2013cja ; Sahu:2015tua ; Sahu:2016mww ; Sahu:2016bdu ; Sahu:2018rqs . This model is successfully employed to explain the multi-TeV flaring from many high frequency blazars. A brief account of the model is given in the next section.
II Photohadronic Scenario
In the photohadronic scenario, the Fermi accelerated protons having a power-law spectrum interact with the background photons to produce the -resonance which subsequently decays to gamma-rays via intermediate neutral pion and to neutrinos through charged pionSahu:2012wv . We assume that this interaction occurs within a compact and confined volume of radius inside the blob of radius (), here the ′ notation implies the jet comoving frame. Geometrically this represents a double jet structure, one compact and smaller cone which is enclosed by a bigger one along the same axis, the geometry of this model is discussed in Fig. 1 of ref. Sahu:2015tua . The inner compact region has a photon density much higher than the outer region. Due to the adiabatic expansion of the inner jet, the photon density will decrease when it crosses into the outer region. We assume the scaling behavior of the photon densities in the inner and the outer jet regions which essentially means, the spectra of both the outer and the inner jets have the same slope. Mathematically we can express this as
| (1) |
i.e. the ratio of photon densities at two different background energies and in the flaring () and in the non-flaring () states remains almost the same. The photon density in the outer region can be calculated in the usual way using the observed/fitted SED. Afterwards, by using the above relation in Eq. (1), we can express the unknown inner photon density in terms of the outer known density. Henceforth, for our calculation, we shall use and its corresponding flux rather than the one from the inner jet region.
The observed VHE -ray flux depends on the background seed photon density and the differential power-spectrum of the Fermi accelerated protons given as . It is to be noted that, the photohadronic process in a standard blazar jet environment (quiescent state) is inefficient due to low seed photon density . So to explain the multi-TeV emission from the flaring in the photohadronic scenario, jet kinetic power has to be increased to the super-Eddington limitCao:2014nia ; Zdziarski:2015rsa . However, the inner compact jet scenario evade this problem due to the higher photon densitySahu:2013ixa . So, the assumption here is that the outer jet is always there and is responsible for the quiescent state of the blazar while the inner jet is transient and is responsible for the flare. The photohadronic model provides a simple explanation for the multi-TeV observed events from the HBLs and it depends only on the seed photons from the low-energy tail of the SSC emission. On the other hand, the one zone leptonic model does not fit well to the observed multi-TeV data and the multi-zone leptonic model needs many more free parameters (compared to one zone leptonic model) to fit it.
The observed -ray energy from the decay and the background seed photon energy satisfy the kinematical condition
| (2) |
following the resonance process and the incident proton has the energy . Here is the Doppler factor and the bulk Lorentz factor of the blob is given as . For blazars we have .
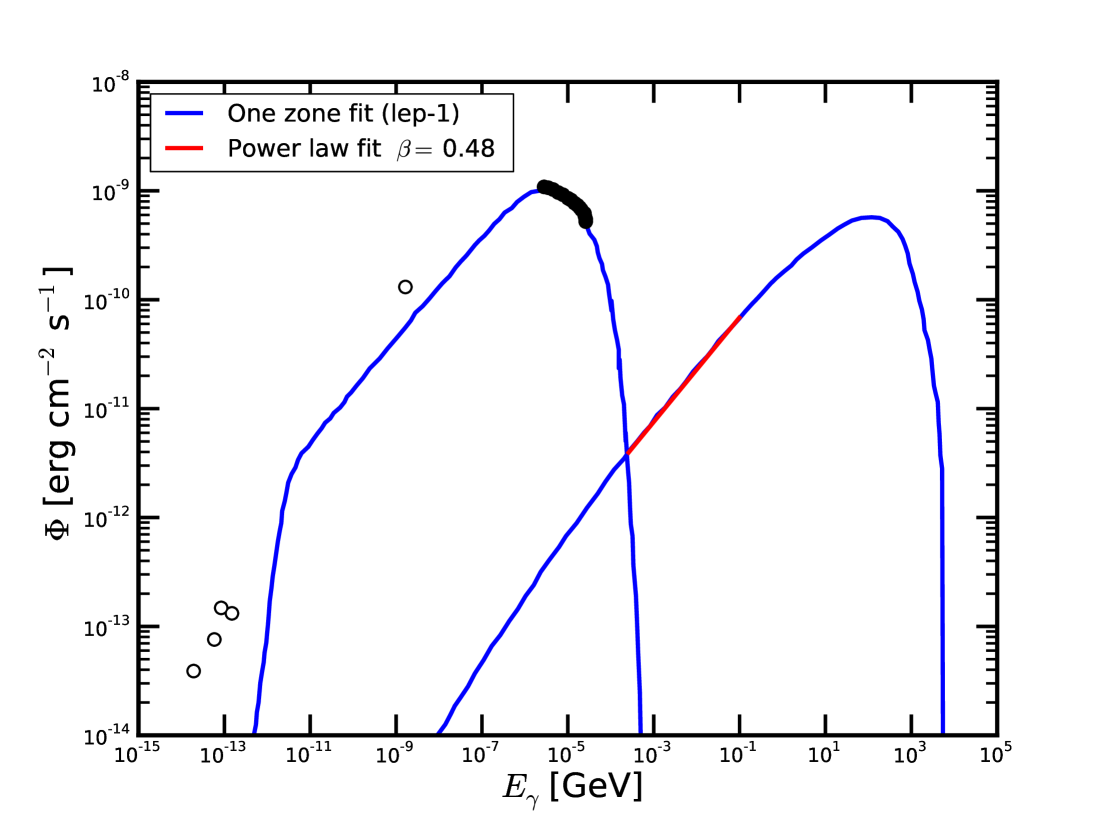
The different epochs of VHE flaring between 2004 to 2014 of Mrk 421 had different ranges of observed -rays which correspond to different ranges of seed photon energies. We observed that, irrespective of the and epoch of flaring, the ranges of are always in the low energy tail region of the SSC emission. This is the region in the valley where the SSC emission begins (see red line in Fig. 2 where ).
The SSC flux in this range of seed photon energy is exactly a power-law given by with . Again, from the kinematical condition to produce -resonance through interaction, can be expressed in terms of and can be written as
| (3) |
From the leptonic model fit to the observed multiwavelength data (up to second peak) during a quiescent/flaring state we can get the SED for the SSC region from which and can be obtained easily. By expressing the observed flux in terms of the intrinsic flux and the EBL correction as
| (4) |
where the intrinsic flux is given in ref. Sahu:2016bdu as,
| (5) |
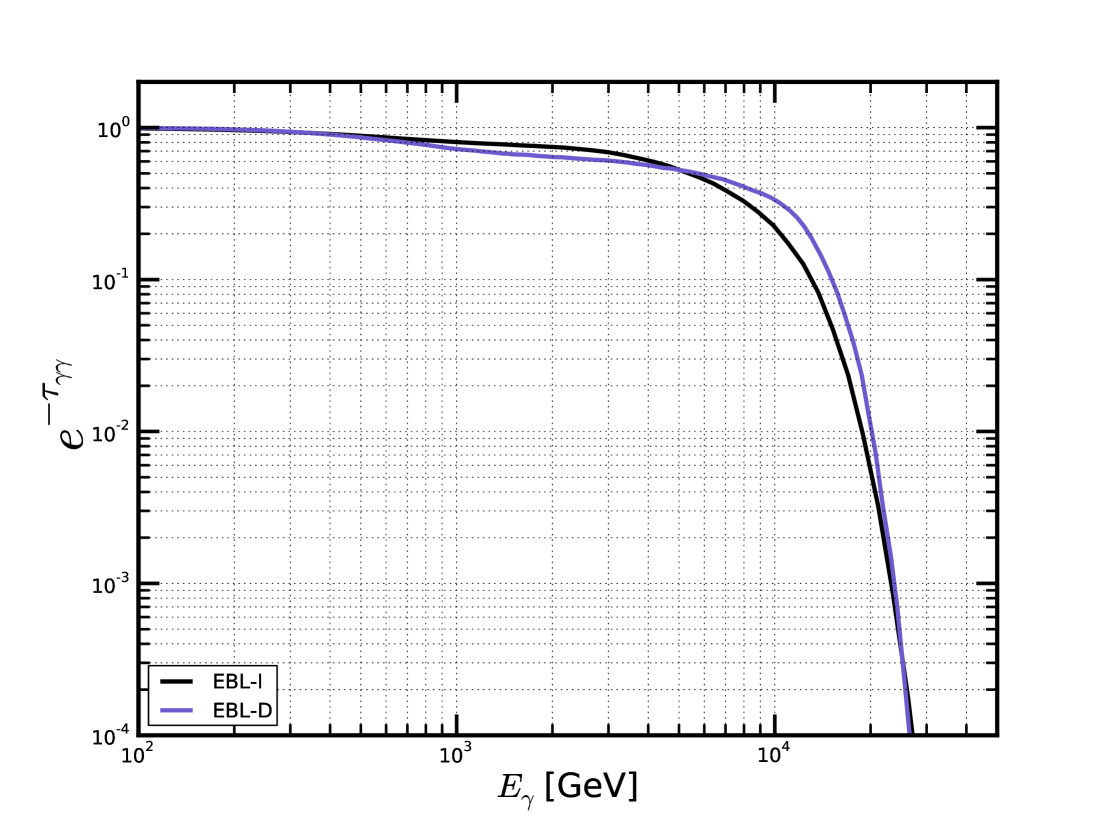
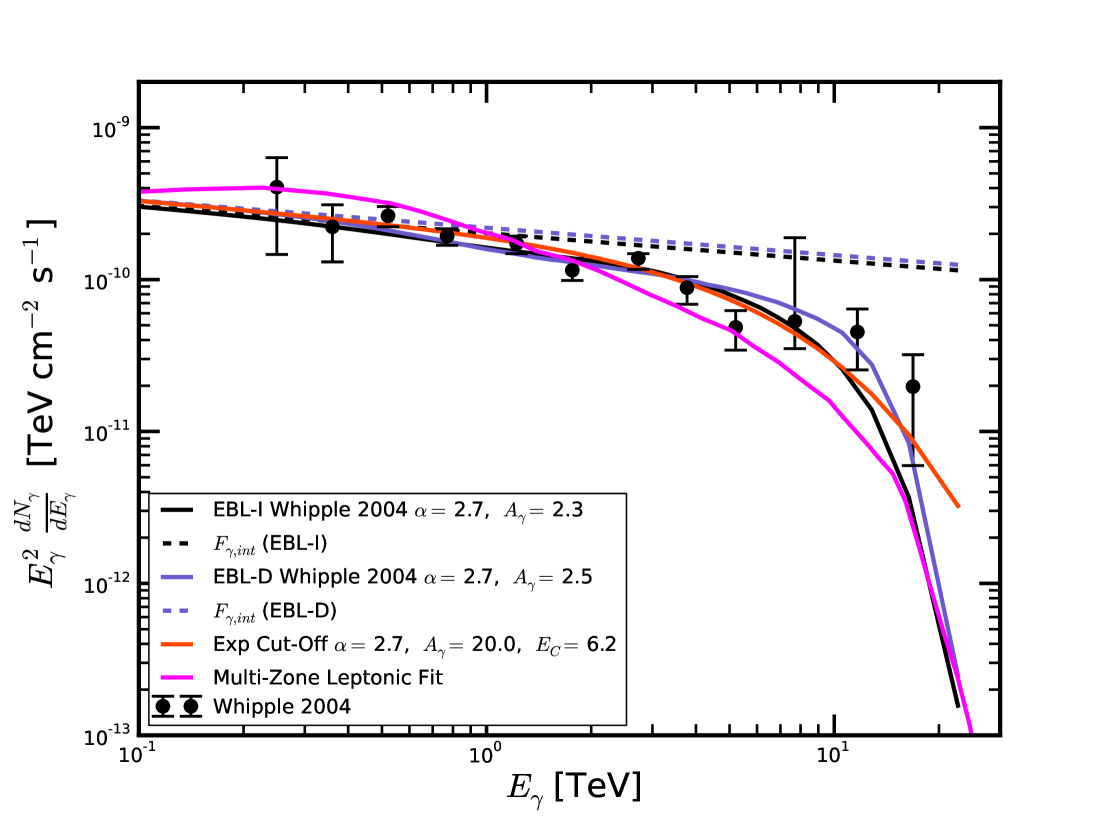
where is a dimensionless normalization constant and can be fixed by fitting the observed VHE data. As discussed above, the power index is fixed from the tail region of the SSC SED for a given leptonic model which fits the low energy data well. So the Fermi accelerated proton spectral index is the only free parameter to fit the intrinsic spectrum. To account for the EBL correction to the observed multi-TeV gamma-rays, here we use the EBL models of Dominguez et al.Dominguez:2010bv (EBL-D) and Inoue et al.Inoue:2012bk (EBL-I) to interpret our results. The Fig. 1 presents the attenuation factor for these two models as functions of observed gamma-ray energy for . The Fig. 1 shows that the difference between the two models becomes apparent at 600 GeV, but continues to increase above 1 TeV, the difference is maximum around 2 TeV than decreases until the models intersect at 6 TeV. At higher energies the models diverge and converge again above 20 TeV with the same attenuation factor.
The Fermi accelerated protons in the jet will emit synchrotron radiation but it will be suppressed by a factor of , where is the proton mass. Also the emission from the ultra high energy protons needs a stronger magnetic field. The same ultra high energy protons can leak out from the jet region and can reach to the Earth as ultra high energy cosmic rays (UHECRs). The charged pions produced from the photohadronic process will decay to neutrinos which can in principle be detected on EarthWinter:2013cla ; Padovani:2014bha ; Krauss:2014tna , however, the flux is too low.
III Two flaring episodes
As discussed in the introduction, several epochs of major multi-TeV emission/flaring are observed from Mrk 421 and below we analyze two of these multi-TeV flares observed by different Cherenkov telescope arrays and use photohadronic model to interpret these flaring events. As input to the photohadronic model we use the leptonic SSC SED fitted to the multiwavelength observations.
III.1 The flare of April 2004
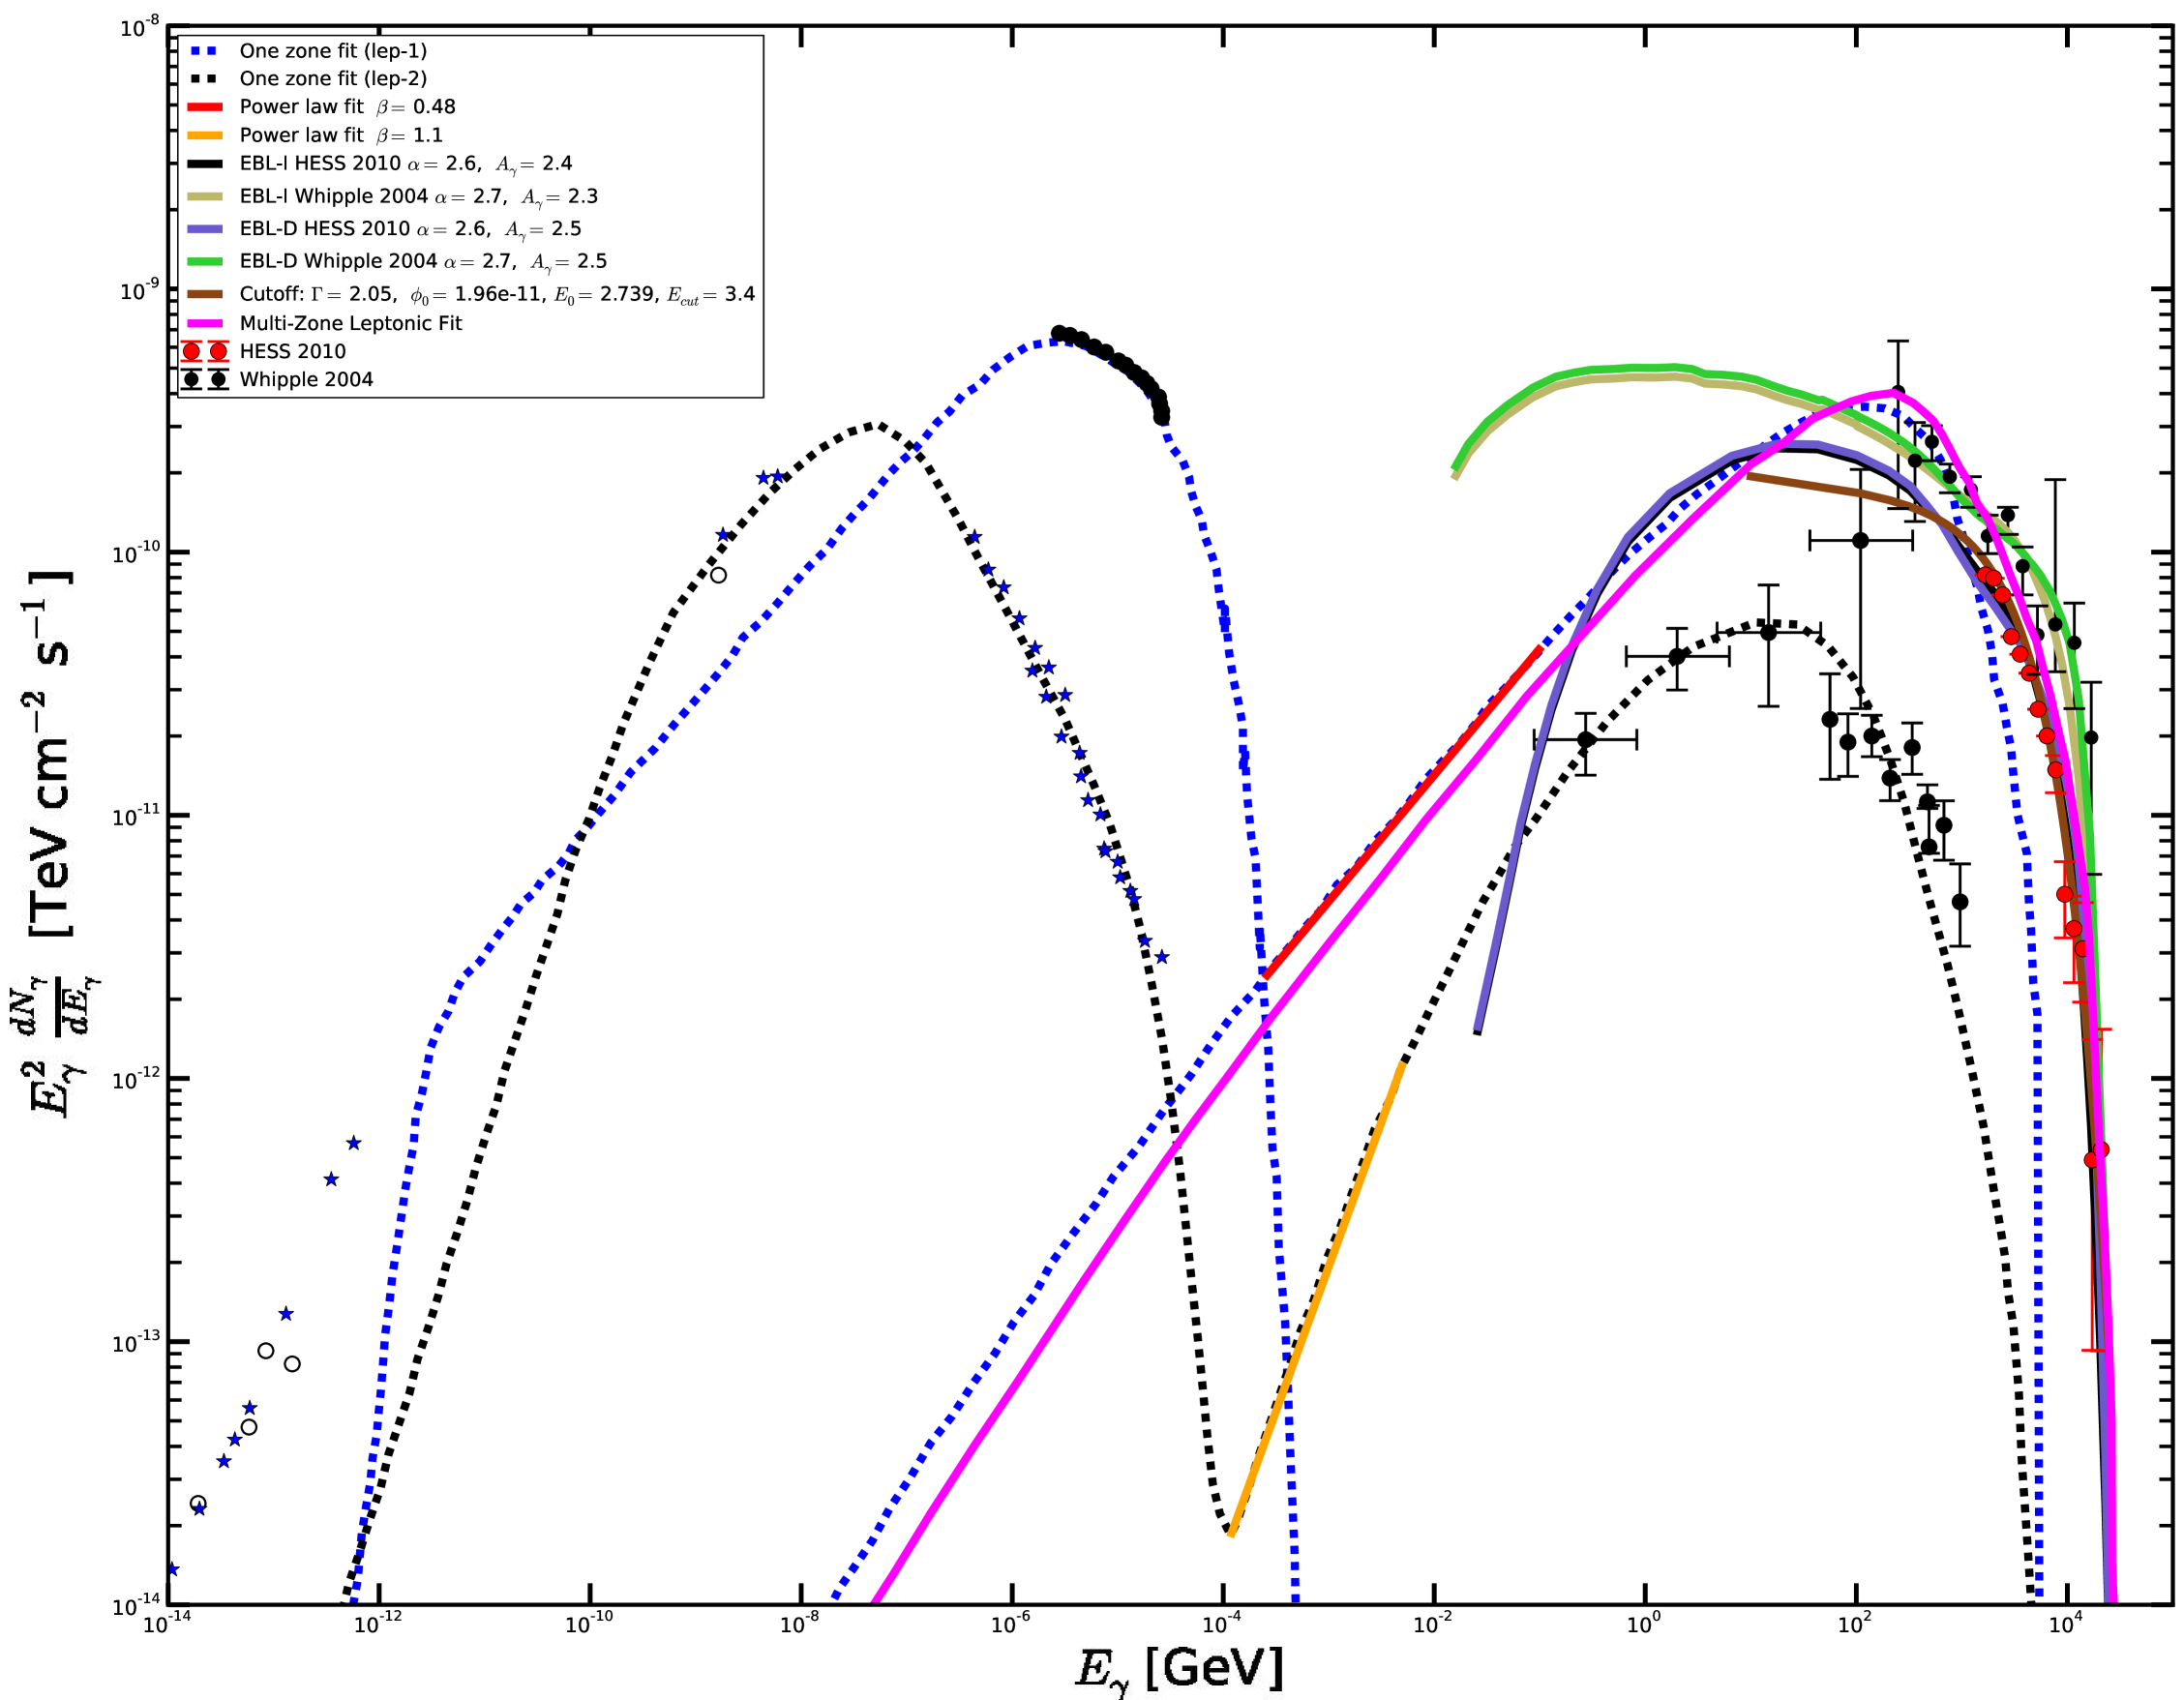
The multi-TeV flare of April 2004 was the first flare observed in multiwavelength and also it was difficult to explain by one-zone leptonic modelBlazejowski:2005ih . The Whipple telescope observed the flare in the energy range . We use the one-zone leptonic model of ref. Blazejowski:2005ih (lep-1) as input for the photohadronic model to explain the observed TeV emission. Here the bulk Lorentz factor associated with the lep-1 model is . The Fermi accelerated proton energy lies in the range and the corresponding background photon energy is in the range . This range of is in the low energy tail region of the SSC SED and the corresponding flux follows an exact power-law given in Eq. (3) with and which is shown in Fig. 2.
For the EBL correction to the observed data, we use EBL-D and EBL-I. The best fit to the observed multi-TeV flare data is obtained for the spectral index , and the normalization constant for EBL-D is 2.3 and for EBL-I is 2.5 respectively which are shown in Fig. 3. For both these EBL models fit the data very well, and, above this energy there is a slight difference due to the change in the attenuation factor. We observe that EBL-D fit is better than the EBL-I. Again above 20 TeV both the EBL models behave the same. For comparison we have also shown in the same figure (red curve) the photohadronic model fit without EBL correction but with an exponential cut-offSahu:2015tua , and the multi-zone leptonic model fit (magenta curve)Blazejowski:2005ih . It can be seen from Fig. 3 that the multi-zone fit is not so good compared to other fits for TeV. However, for higher energy it has the same behavior as EBL-D and EBL-I. With the exponential cut-off scenario, a good fit is obtained for the spectral index and the cut-off energy TeV. Again comparing this with the EBL corrected models, below 4 TeV, all these fits are exactly the same. However, above 4 TeV we observe some discrepancy among these fits and above 10 TeV the fits of EBL-D and EBL-I fall faster than the exponential cut-off scenario. It is clear from the comparison of EBL-I with the exponential cut-off scenario that, for TeV both and are almost the same and above 10 TeV the attenuation factor falls faster than the exponential cut-off for which the EBL-D and EBL-I curves fall fast.
The intrinsic flux in EBL-D and EBL-I are also shown. Both are almost the same and having power-law behavior with . Even though all these models fit quite well to the observed data below 20 TeV energy range, the deviation is appreciable above 20 TeV between the EBL corrected plots and the exponential cut-off. So observation of VHE flux above TeV will be a good test to constrain the EBL effect on the VHE gamma-rays from Mrk 421 and to see whether energy cut-off scenario is necessary or not.
In ref.Sahu:2015tua , by comparing expansion time scale, interaction time scale of interaction and the high energy proton luminosity to be smaller than the Eddington luminosity in the inner jet region (size of the outer jet is ), the range of optical depth for the -resonance production is estimated as . This corresponds to a photon density in the inner jet region as . The TeV photons produced from the neutral pion decay will mostly encounter the SSC photons in the energy range . The pair production cross section for is very small () which corresponds to a mean free path of for the multi-TeV gamma-rays, larger than the outer jet size. So, the TeV photons will not be attenuated much due to the pair production. The parameters used in the photohadronic to fit the 2004 data are summarized in Table 1.
III.2 The flare of February 2010
A strong outburst in multi-TeV gamma-rays from Mrk 421 was observed by VERITAS telescopes on 16th of February 2010 and follow up observations were carried out by HESS telescopes from 17th to 20th of February a total of 6.5 h. These data were taken in 11 runs with each run minutes durationAbeysekara:2016qwu . The HESS telescopes observed this flare in the energy range . As we have no multiwavelength SED obtained around the time of the Feb 2010 TeV flare, we use the models describing the observed SED at an earlier and later epochs. The first one is the same i.e. lep-1, which is used for the interpretation of the April 2004 flare. The second leptonic SED is from the multiwavelength observation of Mrk 421 during January to March 2013, undertaken by GASP-WEBT, Swift, NuSTAR Fermi-LAT, MAGIC, VERITASBalokovic:2015dnz and fitted with one-zone leptonic model where the bulk Lorentz factor is used (lep-2).
| Lep-1 | Lep-2 | ||
| (Doppler factor) | 14 | 25 | |
| (Blob radius) | |||
| (Inner blob radius) | |||
| (Magnetic field) | 0.26 G | 0.17 G | |
| EBL Model | , | , | |
| EBL-I | 2.7, 2.3 | 2.6, 2.4 | |
| EBL-D | 2.7, 2.5 | 2.6, 2.5 |
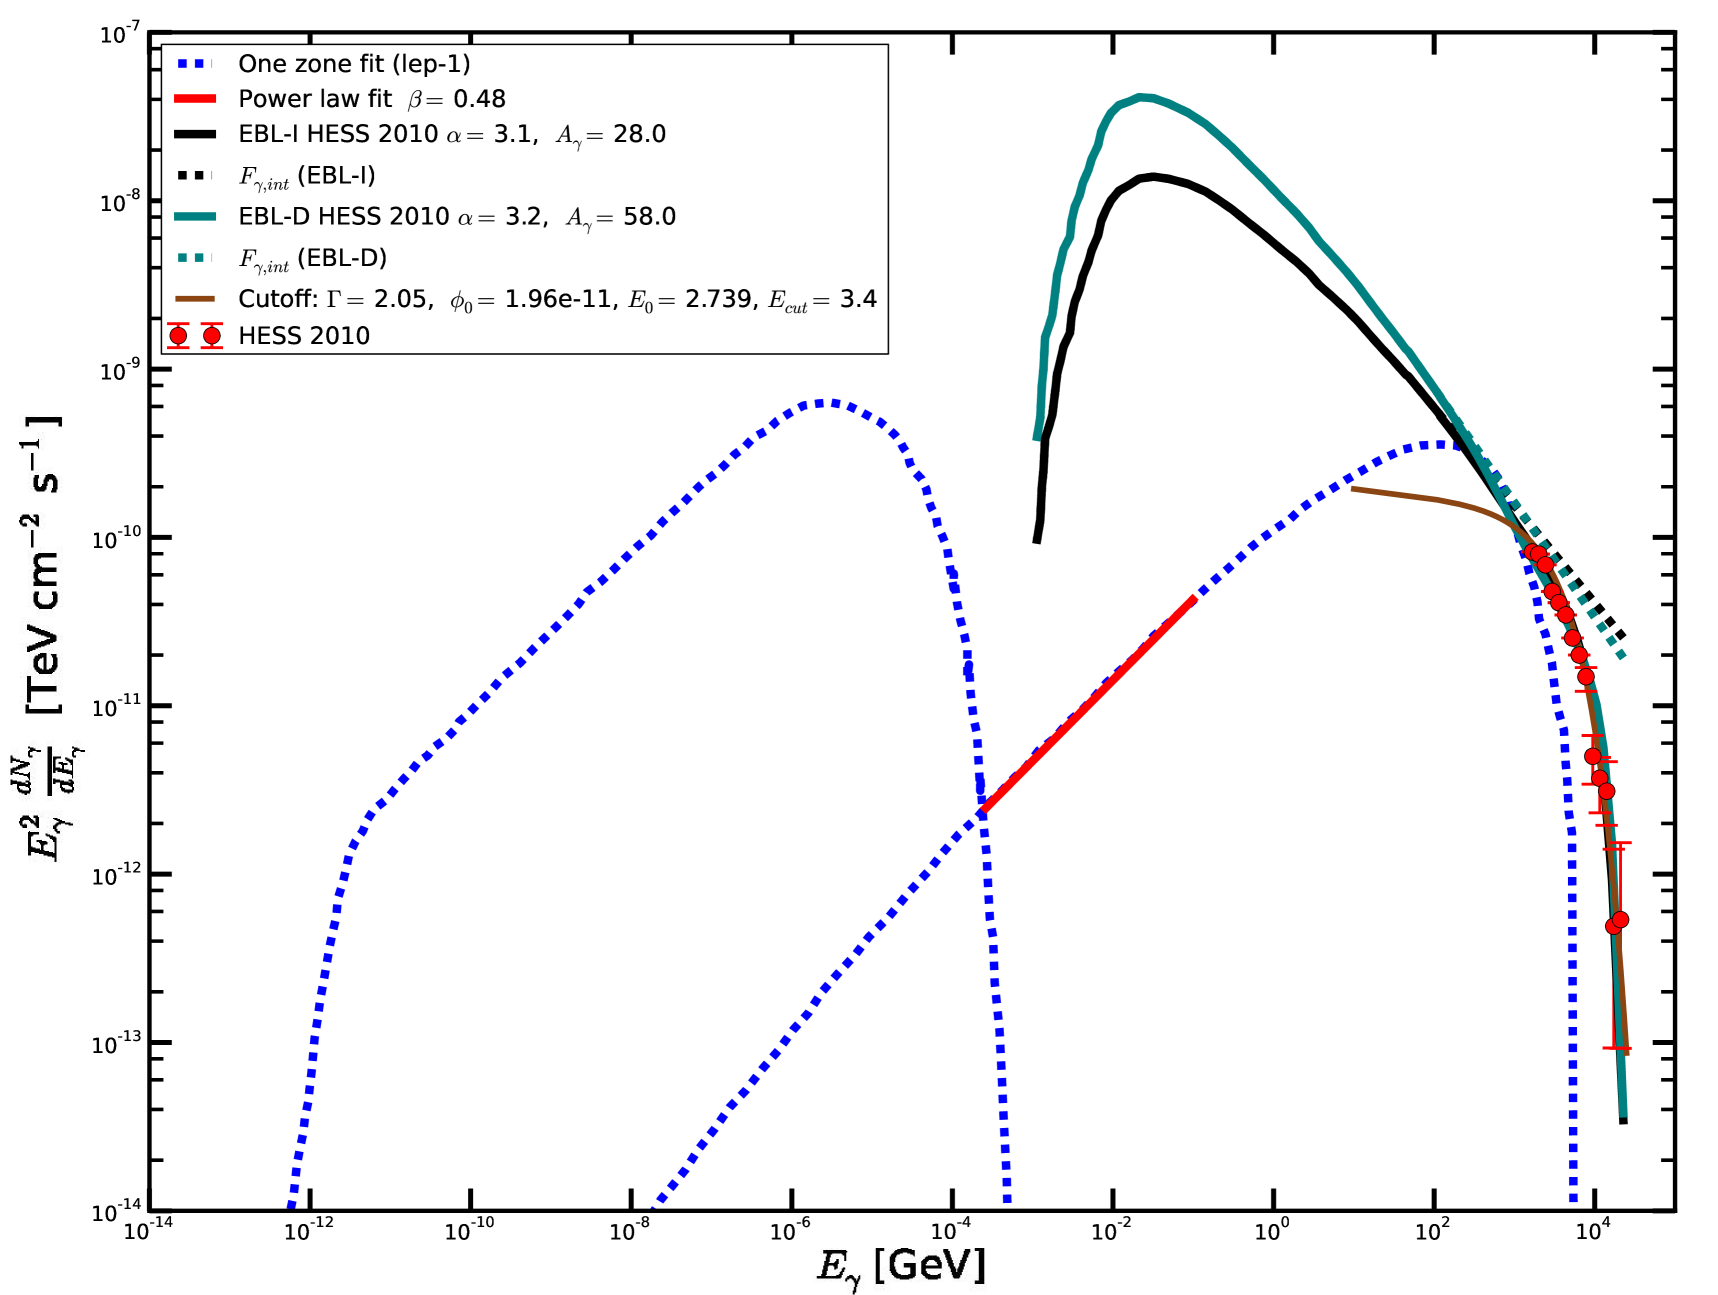
From the kinematical condition given in Eq. (2), the above range of the observed gamma-ray corresponds to the proton energy in the range . Using lep-1, where , the seed photon energy lies in the range which is again in the tail region of the SSC SED as shown in Fig. 2. Very good fit to the multi-TeV spectrum is obtained by using the EBL-D and EBL-I. The best fit parameters are respectively and for EBL-D and and for EBL-I which correspond to very soft spectrum and the intrinsic spectrum is also soft (between -0.68 to -0.58). Even though these parameters fit well to the observed multi-TeV spectrum, in the low energy limit the spectrum shoots up very high as shown in Fig. 4 which is certainly not observed by HESS telescopes. So we can ignore these soft power-law fit to the observed flare data and to look for . This soft power-law problem arises because is small. So we can use the leptonic model which have and will be able to get . The time averaged differential energy spectrum of this observation is also fitted with a power-law with exponential cut-off having four parametersTluczykont:2011gs .
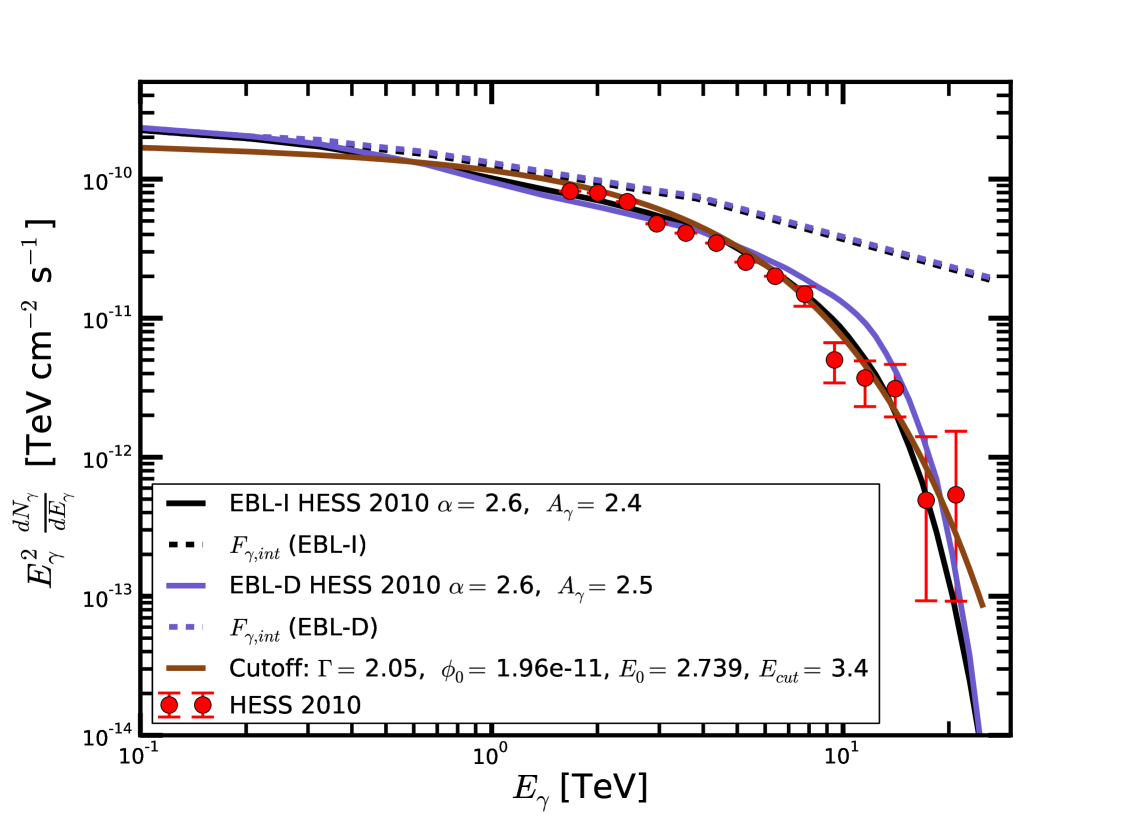
In the context of one-zone leptonic model lep-2 with , the observed flare energy range corresponds to the seed photon energy in the range , which is again in the tail region of the SSC SED as can be seen from Fig. 5. This is fitted with a power-law with and (the pink line). Here again, we have used the EBL-D and EBL-I to fit the 2010 flare data in the photohadronic model which is also shown in Fig. 5. The best fit parameters are and for EBL-D and and for EBL-I respectively. We note that the observed data is fitted well and at the same time, the flux decreases towards low energy regime as expected with a peak flux of at . Both the EBL-D and EBL-I corrections to the photohadronic model give practically the same result. The parameters used in the photohadronic model to fit the 2010 data are summarized in Table 1.
Normally, the leptonic models fit the multiwavelength data well. But as shown in Figs. 2 and 5, the leptonic models lep-1 and lep-2 do not fit to the radio (low energy) data. It is possible that the low energy behavior of these models have to be modified to accommodate these radio data. The SSC photons are produced from the inverse Compton scattering of high energy electrons with the synchrotron photons which obey the relation , where is the SSC photon energy, is the synchrotron photon energy and is the electron Lorentz factor. From the energies of the synchrotron peak and the SSC peak in lep-1, we obtain . This implies that the 0.35 MeV SSC photon can be produced from the boosting of the GeV ( Hz) synchrotron photon which is in the infrared band. This clearly shows that low energy photons in the radio band will not affect the prediction of multi-TeV gamma-rays.
Even though lep-1 fits well to the multi-TeV data, in the low energy regime, the flux increases drastically which is clearly shown in Fig. 4. This behavior is absent with the lep-2 fit. It is to be noted that, lep-1 corresponds to the observation during the year 2003-2004 and lep-2 is the recent one of January 2013. So we believe that during each observation period, the photon density distribution in the jet changes and this change in the seed photon changes the spectral behavior of the observed multi-TeV gamma-rays. This clearly shows that almost simultaneous observation in multiwavelength is essential to fit the observed data.
In Fig. 6 we have plotted only the 2010 flare data along with the EBL-D and EBL-I fits and their corresponding intrinsic fluxes. We can observe a minor difference between EBL-D and EBL-I predictions for . The intrinsic flux is a power law with . Comparison of of both 2004 and 2010 multi-TeV flaring shows that different spectral shape of the observed events are solely due to the diversity in the shape of the seed photon density distribution (particularly in the SSC tail region) even though we have the same acceleration mechanism () of protons in the blazar jet.
IV Summary
We used the photohadronic scenario complemented by two EBL models (EBL-D and EBL-I) to interpret the multi-TeV flares observed in April 2004 and February 2010. These EBL models are equally good to explain the observed data which can also be seen from the comparison of the attenuation factors in Fig. 1. The photohadronic scenario with both the EBL models can fit these multi-TeV spectra very well and it is observed that the intrinsic spectrum of each epoch is different even though the Fermi accelerated high energy protons have almost the same spectral index . This difference in intrinsic spectra attributes to the change in the spectral index of the seed photon in the SSC tail region of the jet in different epochs of flaring. The same photohadronic models were earlier employed to explain the multi-TeV emission from other HBLsSahu:2016mww ; Sahu:2018rqs . We suggest that the same flaring mechanism may be acting in all HBLs. The differences between the flaring behavior of HBL blazars and in one blazar from flare to flare is determined by the changes in flux and spectrum of the seed photons in the SSC region. It is important to note that simultaneous or quasi-simultaneous observation of the tail region of the SSC SED with TeV observation would be most useful to constrain the photohadronic model.
We would like to thank the anonymous referee for valuable comments and suggestions. We thank D. Khangulyan, Yoshiyuki Inoue, Susumu Inoue, Don Warren and Haoning He for many useful discussions. S.S. is a Japan Society for the Promotion of Science (JSPS) invitational fellow. A.R.L. is thankful to iTHEMS for financial support and kind hospitality during his visit to RIKEN. This work is partially supported by RIKEN, iTHEMS & iTHES Program and also by Mitsubishi Foundation. The work of S. S. is partially supported by DGAPA-UNAM (Mexico) Project No. IN110815 and PASPA-DGAPA, UNAM.
References
- (1) F. W. Stecker, O. C. de Jager and M. H. Salamon, Astrophys. J. 390, L49 (1992). doi:10.1086/186369
- (2) M. G. Hauser and E. Dwek, Ann. Rev. Astron. Astrophys. 39, 249 (2001) doi:10.1146/annurev.astro.39.1.249 [astro-ph/0105539].
- (3) R. R. Chary and A. Pope, arXiv:1003.1731 [astro-ph.CO].
- (4) P. Madau and L. Pozzetti, Mon. Not. Roy. Astron. Soc. 312, L9-L15 (2000) doi:10.1046/j.1365-8711.2000.03268.x
- (5) A. Dominguez et al., Mon. Not. Roy. Astron. Soc. 410, 2556 (2011) doi:10.1111/j.1365-2966.2010.17631.x [arXiv:1007.1459 [astro-ph.CO]].
- (6) Y. Inoue, S. Inoue, M. A. R. Kobayashi, R. Makiya, Y. Niino and T. Totani, Astrophys. J. 768, 197 (2013) doi:10.1088/0004-637X/768/2/197 [arXiv:1212.1683 [astro-ph.CO]].
- (7) A. Franceschini, G. and M. Vaccari, Astron. Astrophys. 487, 837 (2008) doi:10.1051/0004-6361:200809691 [arXiv:0805.1841 [astro-ph]].
- (8) F. W. Stecker, M. A. Malkan and S. T. Scully, Astrophys. J. 648, 774 (2006) doi:10.1086/506188 [astro-ph/0510449].
- (9) F. W. Stecker, S. T. Scully and M. A. Malkan, Astrophys. J. 827, no. 1, 6 (2016) doi:10.3847/0004-637X/827/1/6 [arXiv:1605.01382 [astro-ph.HE]].
- (10) T. M. Kneiske, K. Mannheim and D. H. Hartmann, Astron. Astrophys. 386, 1 (2002) doi:10.1051/0004-6361:20020211 [astro-ph/0202104].
- (11) M. Orr, F. Krennrich and E. Dwek, Astrophys. J. 733, 77 (2011) doi:10.1088/0004-637X/733/2/77 [arXiv:1101.3498 [astro-ph.CO]].
- (12) J. R. Primack, J. S. Bullock and R. S. Somerville, AIP Conf. Proc. 745, 23 (2005) doi:10.1063/1.1878394 [astro-ph/0502177].
- (13) V. A. Acciari et al. [VERITAS and MAGIC Collaborations], Astrophys. J. 729, 2 (2011). doi:10.1088/0004-637X/729/1/2 [arXiv:1012.2200 [astro-ph.HE]].
- (14) C. M. Urry and P. Padovani, Publ. Astron. Soc. Pac. 107, 803 (1995) doi:10.1086/133630 [astro-ph/9506063].
- (15) C. D. Dermer and R. Schlickeiser, Astrophys. J. 416, 458 (1993).
- (16) M. Sikora, M. C. Begelman and M. J. Rees, Astrophys. J. 421, 153 (1994).
- (17) P. Roustazadeh and M. Böttcher, Astrophys. J. 728, 134 (2011) doi:10.1088/0004-637X/728/2/134 [arXiv:1012.3923 [astro-ph.HE]].
- (18) G. Fossati, L. Maraschi, A. Celotti, A. Comastri and G. Ghisellini, Mon. Not. Roy. Astron. Soc. 299, 433 (1998) doi:10.1046/j.1365-8711.1998.01828.x [astro-ph/9804103].
- (19) G. Ghisellini, A. Celotti, G. Fossati, L. Maraschi and A. Comastri, Mon. Not. Roy. Astron. Soc. 301, 451 (1998) doi:10.1046/j.1365-8711.1998.02032.x [astro-ph/9807317].
- (20) A. A. Abdo et al. [Fermi Collaboration], Astrophys. J. 719, 1433 (2010) doi:10.1088/0004-637X/719/2/1433 [arXiv:1006.5463 [astro-ph.HE]].
- (21) J. Albert et al., Astrophys. J. 669, 862 (2007) doi:10.1086/521382 [astro-ph/0702008].
- (22) F. Aharonian, Astrophys. J. 664, L71 (2007) doi:10.1086/520635 [arXiv:0706.0797 [astro-ph]].
- (23) G. Ghisellini and F. Tavecchio, Mon. Not. Roy. Astron. Soc. 386, 28 (2008) doi:10.1111/j.1745-3933.2008.00454.x [arXiv:0801.2569 [astro-ph]].
- (24) G. Ghisellini, F. Tavecchio, G. Bodo and A. Celotti, Mon. Not. Roy. Astron. Soc. 393, 16 (2009) doi:10.1111/j.1745-3933.2008.00589.x [arXiv:0810.5555 [astro-ph]].
- (25) E. Resconi, D. Franco, A. Gross, L. Costamante and E. Flaccomio, Astron. Astrophys. 502, 499 (2009) doi:10.1051/0004-6361/200911770 [arXiv:0904.1371 [astro-ph.HE]].
- (26) P. W. Gorham, L. van Zee, S. C. Unwin and C. S. Jacobs, Astron. J. 119, 1677 (2000) doi:10.1086/301289 [astro-ph/9908077].
- (27) M. H. Ulrich, T. D. Kinman, C. R. Lynds, G. H. Rieke, R. D. Ekers, Astrophys. J. 198, 261 (1975) doi:10.1086/153603
- (28) M. Stickel, J. W. Fried, H. Kuehr, Astron. Astrophys. 98, 393 (1993)
- (29) J. F. Schanchter, J. T Stocke, E. Perlman, M. Elvis, R. Remillard, A. Granados, J. Luu, J. P. Huchra, R. Humphreys, C. M. Urry, J. Wallin, Astrophys. J. 412, 541 (1993) doi:10.1086/172942
- (30) M. Tluczykont [H.E.S.S. Collaboration], PoS TEXAS 2010, 197 (2010) [arXiv:1106.1035 [astro-ph.HE]].
- (31) F. Aharonian et al. [HEGRA Collaboration], Astrophys. J. 546, 898 (2001) doi:10.1086/318321 [astro-ph/0008211].
- (32) E. Aliu et al. [VERITAS Collaboration], Astron. Astrophys. 594, A76 (2016) doi:10.1051/0004-6361/201628744 [arXiv:1608.01569 [astro-ph.HE]].
- (33) P. Chandra et al., New Astron. 54, 42 (2017) doi:10.1016/j.newast.2017.01.004 [arXiv:1701.04935 [astro-ph.IM]].
- (34) M. Santander [VERITAS Collaboration], PoS ICRC 2017, 622 (2017) [arXiv:1709.02365 [astro-ph.HE]].
- (35) H. Krawczynski, S. B. Hughes, D. Horan, F. Aharonian, M. F. Aller, H. Aller, P. Boltwood and J. Buckley et al., Astrophys. J. 601, 151 (2004) [astro-ph/0310158].
- (36) M. Blazejowski et al., Astrophys. J. 630, 130 (2005) doi:10.1086/431925 [astro-ph/0505325].
- (37) K. Katarzynski and G. Ghisellini, Astron. Astrophys. 463, 529 (2007) doi:10.1051/0004-6361:20066448 [astro-ph/0610801].
- (38) A. Mucke, J. P. Rachen, R. Engel, R. J. Protheroe and T. Stanev, Publ. Astron. Soc. Austral. 16, 160 (1999) doi:10.1071/AS99160 [astro-ph/9808279].
- (39) A. Mucke and R. J. Protheroe, Astropart. Phys. 15, 121 (2001) doi:10.1016/S0927-6505(00)00141-9 [astro-ph/0004052].
- (40) G. Cao and J. Wang, Astrophys. J. 783, 108 (2014) doi:10.1088/0004-637X/783/2/108 [arXiv:1401.3970 [astro-ph.HE]].
- (41) A. A. Zdziarski and M. Böttcher, Mon. Not. Roy. Astron. Soc. 450, no. 1, L21 (2015) doi:10.1093/mnrasl/slv039 [arXiv:1501.06124 [astro-ph.HE]].
- (42) W. Essey, O. Kalashev, A. Kusenko and J. F. Beacom, Astrophys. J. 731, 51 (2011) doi:10.1088/0004-637X/731/1/51 [arXiv:1011.6340 [astro-ph.HE]].
- (43) G. Ghisellini, F. Tavecchio and M. Chiaberge, Astron. Astrophys. 432, 401 (2005) doi:10.1051/0004-6361:20041404 [astro-ph/0406093].
- (44) F. Tavecchio and G. Ghisellini, Mon. Not. Roy. Astron. Soc. 385, 98 (2008) doi:10.1111/j.1745-3933.2008.00441.x [arXiv:0801.0593 [astro-ph]].
- (45) M. Punch et al., Nature 358, 477 (1992). doi:10.1038/358477a0
- (46) M.-P. Veron-Cetty and P. Veron, Astron. Astrophys. 455, 773 (2006). doi:10.1051/0004-6361:20065177
- (47) K. Okumura et al., Astrophys. J. 579, L9 (2002) doi:10.1086/344831 [astro-ph/0209487].
- (48) M. Amenomori et al. [Tibet AS Gamma Collaboration], Astrophys. J. [Astrophys. J. 598, 242 (2003)] doi:10.1086/378350 [astro-ph/0304241].
- (49) G. Fossati et al., Astrophys. J. 677, 906 (2008) doi:10.1086/527311 [arXiv:0710.4138 [astro-ph]].
- (50) W. Cui et al. [VERITAS Collaboration], AIP Conf. Proc. 745, 455 (2005) doi:10.1063/1.1878445 [astro-ph/0410160].
- (51) A. U. Abeysekara et al. [VERITAS and MAGIC Collaborations], Astrophys. J. 834, no. 1, 2 (2017) doi:10.3847/1538-4357/834/1/2 [arXiv:1611.04626 [astro-ph.HE]].
- (52) M. Baloković et al. [VERITAS and MAGIC Collaborations and NuSTAR Team], Astrophys. J. 819, 156 (2016) doi:10.3847/0004-637X/819/2/156 [arXiv:1512.02235 [astro-ph.HE]].
- (53) S. Sahu, L. S. Miranda and S. Rajpoot, Eur. Phys. J. C 76, no. 3, 127 (2016) doi:10.1140/epjc/s10052-016-3975-2 [arXiv:1501.00973 [astro-ph.HE]].
- (54) S. Sahu, B. Zhang and N. Fraija, Phys. Rev. D 85, 043012 (2012) [arXiv:1201.4191 [astro-ph.HE]].
- (55) S. Sahu, A. F. O. Oliveros and J. C. Sanabria, Phys. Rev. D 87, 103015 (2013). [arXiv:1305.4985 [hep-ph]].
- (56) S. Sahu and E. Palacios, Eur. Phys. J. C 75, no. 2, 52 (2015) doi:10.1140/epjc/s10052-015-3286-z [arXiv:1310.1381 [astro-ph.HE]].
- (57) S. Sahu, M. V. L. Yáñez, L. S. Miranda, A. R. de León and V. Gupta, Eur. Phys. J. C 77, no. 1, 18 (2017) doi:10.1140/epjc/s10052-016-4592-9 [arXiv:1610.07533 [astro-ph.HE]].
- (58) S. Sahu, A. R. de León and L. S. Miranda, Eur. Phys. J. C 77, no. 11, 741 (2017) doi:10.1140/epjc/s10052-017-5335-2 [arXiv:1610.01709 [astro-ph.HE]].
- (59) S. Sahu, A. R. de León and S. Nagataki, arXiv:1801.04423 [astro-ph.HE].
- (60) W. Winter, Phys. Rev. D 88, 083007 (2013) doi:10.1103/PhysRevD.88.083007 [arXiv:1307.2793 [astro-ph.HE]].
- (61) P. Padovani and E. Resconi, Mon. Not. Roy. Astron. Soc. 443, no. 1, 474 (2014) doi:10.1093/mnras/stu1166 [arXiv:1406.0376 [astro-ph.HE]].
- (62) F. Krauß et al., Astron. Astrophys. 566, L7 (2014) doi:10.1051/0004-6361/201424219 [arXiv:1406.0645 [astro-ph.HE]].