A focus on L dwarfs with trigonometric parallaxes
Abstract
We report new parallax measurements for ten L and early T type dwarfs, five of which have no previous published values, using observations over 3 years at the robotic Liverpool Telescope. The resulting parallaxes and proper motions have median errors of 2 mas and 1.5 mas/year respectively. Their space motions indicate they are all Galactic disk members. We combined this sample with other objects with astrometry from the Liverpool Telescope and with published literature astrometry to construct a sample of 260 L and early T type dwarfs with measured parallaxes, designated the Astrometry Sample. We study the kinematics of the Astrometry Sample, and derived a solar motion of km s-1 with respect to the local standard of rest, in agreement with recent literature. We derive a kinematic age of 1.5-1.7 Gyr for the Astrometry Sample assuming the age increases monotonically with the total velocity for a given disk sample. This kinematic age is less than half literature values for other low mass dwarf samples. We believe this difference arises for two reasons (1) the sample is mainly composed of mid to late L dwarfs which are expected to be relatively young and (2) the requirement that objects have a measured parallax biases the sample to the brighter examples which tend to be younger.
1 Introduction
Objects classified as L and T spectral types are predominately brown dwarfs or sub-stellar objects with masses that cover the range from the most massive planets to the least massive stars. Since the discovery of the first examples (Becklin & Zuckerman, 1988; Nakajima et al., 1995) there have been over 2000 identified primarily in the large optical and near-infrared (NIR) sky surveys (e.g. Kirkpatrick et al., 2000; Knapp et al., 2004; Pinfield et al., 2008) and more recently in the mid-infrared (Kirkpatrick et al., 2011). They are an important component of the Galaxy that can be used to study the atmospheres of hot Jupiter-like planets (e.g. Faherty et al., 2013), to explore the low mass end of the initial mass function (e.g. Kirkpatrick et al., 2012; Burningham et al., 2013; Marocco et al., 2015), and, given their long life time and ubiquity, will be excellent for studying the evolution of our galaxy and its components (e.g. Burgasser, 2009).
Distance is a critical parameter in understanding these objects. A distance is required to derive the absolute magnitude and, hence, energy output. A model-independent parallax can be used to constrain radius or temperature, and, aid in the exploration of relations between other parameters such as mass, surface gravity, age, and metallicity. To precisely measure a parallax observational sequences covering several years on stable imaging systems are required and less than two hundred and fifty of the currently known L and T dwarfs have measured parallaxes. In this paper we report new parallaxes of ten L and early T dwarfs and then combine them with all published parallaxes of L0 to T2 dwarfs and examine a number of relations e.g. SpT-absolute magnitude diagrams and space motions.
This paper is divided into five sections. First, in Section 2 we report the parallax measurements for our ten targets and use their parameters to indicate which galactic population they pertain to. In Section 3 we study the spectral type and absolute magnitude relations. In Section 4 we study the kinematic signature of the Astrometry Sample. Finally we summarize the paper in Section 5.
2 Parallax measurements
The parallax measurements in this paper were made as part of the program described in Wang et al. (2014, hereafter WJS14); here we briefly summarize the observations and data reduction procedures, the reader is referred to that paper for more details. The observations were made on the 2 m robotic Liverpool Telescope111http://telescope.livjm.ac.uk/ (hereafter LT). The LT, an Alt-Az mounted telescope with Ritchey-Chrétien Cassegrain optics, is a totally robotic telescope located at the Observatorio del Roque de Los Muchachos on the Canary island of La Palma in Spain and operated by the Liverpool John Moores University in the United Kingdom. We used the SDSS- band filter (hereafter simply ; York et al., 2000) and the RATCam CCD which is an optically sensitive 20482048 pixel CCD camera with a pixel scale of 0.1395 arcsecond/pixel providing a total field of view of 4.6 arcmin.
2.1 Target Selection
The targets were selected from the literature with the following criteria: at a declination visible to the LT, a SDSS magnitude brighter than 18 and no published trigonometric parallax in 2004. From this list of objects those with the smallest photometric distance were preferred. Here we report on ten objects that have enough observations to provide reliable parallaxes.
In Table 1, we list the ten targets presented in this contribution and the five targets from WJS14 with their discovery designation, a short name, SDSS magnitude, NIR spectral type (hereafter SpTNIR), binary separations from the literature if the object is a known binary system, and, any published astrometry. SpTNIR is the near-infrared spectral type found from NIR spectra in the SpeX-Prism spectra library 222http://pono.ucsd.edu/~adam/browndwarfs/spexprism (Burgasser, 2014) comparing standards in the 0.9-1.4 region (Kirkpatrick et al., 2010). The five objects below the solid line in Table 1 are from WJS14, which used the the same methodology as presented here. These five objects combined with the ten targets with homogeneous astrometry we designate the LT Sample.
| 2MASS Designation | Short Name | SpTNIR | vr | Literature , , | ||
| (mag) | (km s-1) | (mas, mas/yr, mas/yr) | ||||
| J04234858-0414035 | 2M0423-0414 | 17.29 | T0 | 0.611 | 28.02.05 | 73.31.4, -325.31.0, 93.10.97 |
| J07171626+5705430 | 2M0717+5705 | 17.23 | L3 | - | -16.30.26 | …, -17.9917.87, 67.1715.138 |
| J07584037+3247245 | 2M0758+3247 | 17.96 | T2 | - | - | …, -204.2318.01, -316.2112.42 8 |
| J08575849+5708514 | 2M0857+5708 | 17.74 | L8 | - | - | …, -413.6120.52, -353.4316.858 |
| J10170754+1308398 | 2M1017+1308 | 16.74 | L2 | 0.102 | - | 30.0 1.6, 44.10.7, -114.30.67 |
| J11040127+1959217 | 2M1104+1959 | 17.21 | L5 | - | - | …, 74.814.7, 138.720.39 |
| J12392727+5515371 | 2M1239+5515 | 17.52 | L6 | 0.213 | - | 42.41.7, 125.21.1, 0.041.17 |
| J13004255+1912354 | 2M1300+1912 | 15.14 | L1 | - | -17.60.26 | 70.42.5, -793.010.0, -1231.010.010 |
| J15150083+4847416 | 2M1515+4847 | 16.74 | L5 | - | -30.00.16 | …, -949.921.3, 1471.521.49 |
| J20282035+0052265 | 2M2028+0052 | 16.98 | L2 | 0.054 | - | 33.251.32, 96.500.93, -6.052.0411 |
| J01410321+1804502 | 2M0141+1804 | 16.34 | L2 | - | 24.70.16 | 44.12.1, 405.21.1, -48.70.912 |
| J17171408+6526221 | SD1717+6526 | 17.79 | L7 | - | - | 57.13.5, 105.21.0, -109.30.612 |
| J18071593+5015316 | 2M1807+5015 | 15.43 | L1 | - | -0.40.56 | 77.31.5, 27.21.0, -130.21.512 |
| J22380742+4353179 | 2M2238+4353 | 16.42 | L1 | - | - | 54.11.6, 324.30.5, -121.00.412 |
| J22425317+2542573 | 2M2242+2542 | 17.49 | L2 | - | - | 48.02.8, 382.00.9, -64.60.712 |
Note: All magnitudes are measured SDSS DR10 magnitudes except the
three objects in italics which are estimated from their and magnitudes.
The SpTNIR is estimated in this work following the
Kirkpatrick et al. (2010) method using SpeX-Prism spectra. The
indicates the angular separation in arcsecond for known binary systems. The
last column listed literature absolute parallax and proper motions when
available. The five objects below the line are from WJS14.
References:
1Burgasser et al. (2006), 22003AJ....126.1526B,
3Gizis et al. (2003), 4Pope et al. (2013), 5Prato et al. (2015),
6Blake et al. (2010), 7Dupuy & Liu (2012),
8Casewell et al. (2008), 9Jameson et al. (2008),
10Faherty et al. (2016), 11Weinberger et al. (2016),
12Wang et al. (2014).
2.2 Observations
All observations were obtained within 30 minutes of the meridian to minimize Differential Color Refraction (Monet et al., 1992; Stone, 2002). This is the small varying positional displacement of objects due to their different colors and the variation of the atmosphere refractive index with wavelength. Observing at small hour angles minimizes the part of the refraction that varies as a function of the amount of atmosphere traversed. In each observation we took three exposures of 160 s to allow for robust removal of cosmic rays and to minimize random errors. This combination of exposures nominally provides a signal-to-noise of better than 50 on these targets.
2.3 Data reduction
The bias subtraction, trimming of the over-scan regions, dark subtraction and flat fielding are carried out via the standard LT pipeline (Steele et al., 2004). Images in the z band display prominent fringes caused by thin-film interference (Berta et al., 2008). These fringes can have a significant impact on the astrometry of our targets since the targets are relatively faint. The LT web site provides biannual fringe maps which we used to remove the fringes using IRAF’s rmfringe. We derived the x and y positions using a maximum likelihood barycenter centroid as implemented in the imcore software of the Cambridge Astronomy Survey Unit (hereafter CASU333http://casu.ast.cam.ac.uk/surveys-projects). We compared successive observations of the same field and find the centroid precision is approximately 11 mas for bright objects in both x and y coordinates (WJS14).
2.4 Parallax determination and comparison
We derived the parallaxes and proper motions using the methods adopted in the Torino Observatory Parallax Program (Smart et al., 2003, 2007), using the x,y coordinates determined from the CASU imcore software. The Torino pipeline selects the frames and reference stars in an unsupervised fashion with user supplied parameters to vary the minimum number of common reference stars and the outlier rejection criteria. A base frame is selected in the middle of the sequence with a high number of stars. This base frame is transferred to a standard coordinate system using the Sloan Digital Sky Survey (York et al., 2000) as a reference catalog except for 2M0717+5705 where we used the Two Micron Sky Survey (Skrutskie et al., 2006).
The other observations of each target are translated to the base frame standard coordinate system using all common stars via a linear transformation. Once we have all observations in the base frame system we fit the observations of the target with a position offset, parallax and proper motion in each coordinate. The best relative parallax is found from a weighted mean of the estimates in each coordinate. The correction from relative to absolute parallax is calculated using the Galaxy model of 1998A&A...330..910M as described in Smart et al. (2003). We estimate the error on this correction to be around 30% or 0.4-0.6 mas for these fields which is negligible compared to the formal error of the parallaxes.
In Table 2 we list the parallax and proper motions of ten L/T dwarfs. The motion and corresponding fit over the observed period for all targets are shown in the appendix Fig. 4. In the last column of Table 1, published parallax and proper motion results are shown. We found that five of our targets have literature parallaxes for which our values are all consistent to within two except for the target 2M2028+0052 which differs by three times the combined from the value in Weinberger et al. (2016). 2M2028+0052 is a known binary with almost equal mass and magnitude components (Pope et al., 2013) while both the Weinberger and the LT solutions assume it is single. The LT solution has more epochs, 17 vs 4, and a longer baseline, 3.74 vs 2.0 yrs, so we expect the results presented here to be more robust.
| Short Name | , | t | COR | vtan | |||
|---|---|---|---|---|---|---|---|
| (yr) | (mas) | (mas) | (mas) | (mas) | (mas) | ||
| 2M0423-0414 | 50,13 | 4.33 | 66.33.7 | 1.5 | -325.61.8 | 83.11.5 | 24.01.3 |
| 2M0717+5705 | 48,27 | 4.22 | 46.42.3 | 1.4 | -18.01.6 | 54.31.3 | 5.90.3 |
| 2M0758+3247 | 62,16 | 4.18 | 106.94.6 | 1.5 | -230.71.7 | -327.72.1 | 17.90.8 |
| 2M0857+5708 | 71,9 | 4.15 | 98.02.6 | 2.0 | -400.01.7 | -374.91.7 | 26.50.8 |
| 2M1017+1308 | 55,5 | 4.10 | 32.32.8 | 2.5 | 61.01.4 | -116.31.5 | 19.31.7 |
| 2M1104+1959 | 66,5 | 4.08 | 66.21.9 | 2.2 | 55.90.7 | 126.60.7 | 9.90.3 |
| 2M1239+5515 | 43,6 | 4.04 | 45.02.1 | 2.0 | 131.72.0 | -2.61.4 | 13.90.7 |
| 2M1300+1912 | 42,10 | 3.48 | 76.41.8 | 2.0 | -789.01.1 | -1237.21.0 | 91.12.1 |
| 2M1515+4847 | 43,6 | 3.46 | 123.85.0 | 1.7 | -930.44.1 | 1469.32.2 | 66.82.5 |
| 2M2028+0052 | 54,79 | 3.74 | 39.11.6 | 1.2 | 96.90.8 | -9.0 0.8 | 11.80.5 |
Note: The columns denote the object name, number of observations and number of reference objects (,), total time span for observations (t), absolute parallax ( ), correction from relative to absolute parallax (COR), proper motions ( & ) and tangential velocity().
2.5 Galactic population membership
Kinematic information can be used as an indication of Galactic population membership. Eight of our ten targets have low tangential velocities of 25 km s-1 while 2M1515+4847 has vtan=662.5 km s-1 and 2M1300+1912 has vtan=91.12.1 km s-1. The galaxy model of vtan shown in Fig. 31 of Dupuy & Liu (2012) implies that all these targets are thin disk, although 2M1300+1912 may be thick disk.
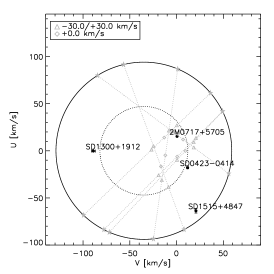
UVW space velocities can also be used to indicate Galaxy population. Determination of U and V requires a measurement of parallax, proper motion and radial velocity. Four of our ten targets have radial velocity measurements and these are given in Table 1. For the remaining targets we calculate their U and V velocities assuming a Gaussian distribution of radial velocities centered on zero with a 30 km s-1, as seen for M dwarfs radial velocity (WSJ14). Fig. 1 shows the UV velocities for our ten targets, as well as the one and two sigma disk stars’ velocity ellipsoids (Reid et al., 2001; Oppenheimer et al., 2001). Targets beyond the two sigma ellipsoid with km s-1 are likely to be halo members (Oppenheimer et al., 2001). In this view all the targets appear to be likely thin disk members although SDSS 1515+4847 lies near the two sigma ellipsoid and may be a thick disk object.
We can also calculate a probability of these objects being Galactic disk members. Adopting a Gaussian distribution for radial velocity, these objects have U and V velocities that trace a straight line on a U-V plot as shown in Fig. 1. Integrating within the 2 circle, we derived the probability of them being Galactic disk members. The probability is very high 100% for all of our targets indicating that they are Galactic disk members.
3 Study of Spectral type versus absolute magnitude diagrams
We now examine the Spectral Type versus absolute Magnitude relations (hereafter SpT-Mag) in the 2MASS and WISE magnitude systems.
3.1 The Astrometry Sample and the LT Sample
To obtain a larger, statistically significant, sample we combine all brown dwarfs with spectral types between L0 to T2 and published trigonometric parallax measurements. This sample is a combination of the Dupuy & Liu (2012) online compendium, 5 targets from WJS14 and the 10 targets presented in this contribution resulting in 260 objects (239 L and 21 T dwarfs), designated the Astrometry Sample. In the online table we list object name, position, optical and NIR spectral types, 2MASS magnitudes, object flag, WISE magnitudes, trigonometric distance, tangential velocity, radial velocity, space motions and trim status in Section 5 for our Astrometry Sample. We will use the Astrometry Sample when plotting the SpT-Mag diagrams in the next subsection and in the Section 4.
The LT Sample (Table 1) is a sub sample of the Astrometry Sample that contains the ten targets with new astrometry presented here and the five targets presented in WJS14. This LT sample is considered separately because it has homogeneous photometry, spectroscopy and astrometry.
3.2 SpT-Mag diagrams
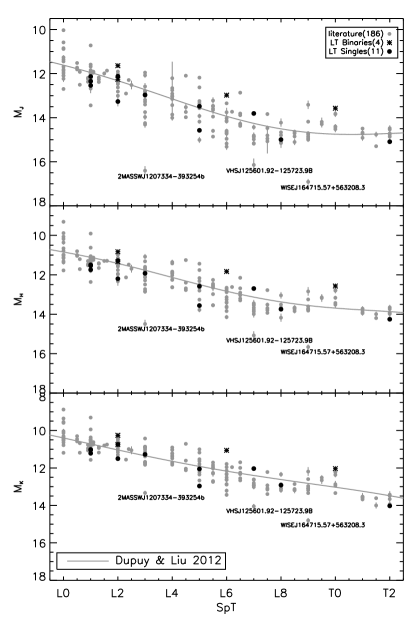
In Fig. 2, we plot the SpT-Mag diagrams in the 2MASS and WISE systems respectively. The grey solid circles indicate the objects from Astrometry Sample, the black symbols indicate the LT Sample. The small black asterisks indicate four LT sample targets that are known binaries. The solid grey line is the relation from Dupuy & Liu (2012) using a sixth order polynomial fit.
There are 200 objects with valid magnitudes plotted in the left panel of Fig. 2. We have labeled three under-luminous outliers in each 2MASS band. Both 2MASSWJ1207334-393254B (Allers & Liu, 2013) and VHSJ125601.92-125723.9B (Gauza et al., 2015) have low surface gravity and young age. While WISEJ164715.57+563208.3 has a very red near-infrared color which cannot be attributed to low gravity (Kirkpatrick et al., 2011).
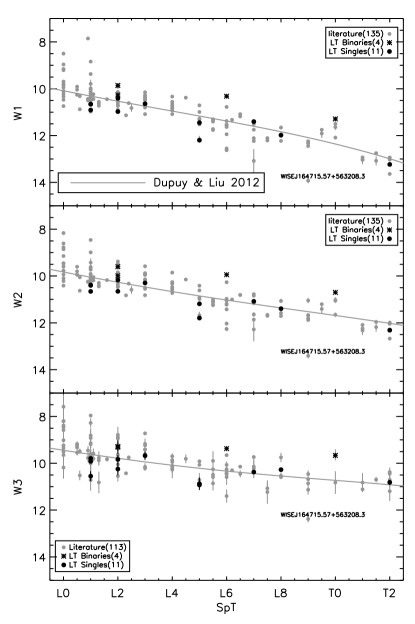
For the plots in WISE absolute magnitudes to maximize the numbers of objects we selected on W1 and W2 separately from W3, all objects with values were considered valid regardless of the flags and error estimates. This resulted in 151 objects in the W1 and W2 bands and 129 objects in the W3 band plotted in the right panel of Fig. 2. The grey solid line shows the polynomial fit presented in Dupuy & Liu (2012).
The outliers 2MASSWJ1207334-393254B and VHSJ12
5601.92-125723.9B do not have
valid WISE magnitudes as they are both blended with bright
stars. WISEJ164715.57+563208.3 remains an outlier in the WISE
bands.
The consistency of our data with the published data in the SpT-Mag diagrams is a confirmation that our parallax measurements are reasonable. In the SpT-Mag diagram the unresolved binaries stand out as over-luminous objects, up to 0.75 magnitudes for equal mass binaries. There are four of our ten targets located above the fitting line in both panels of Fig. 2 that are the known binaries 2M0423-0414 (Burgasser et al., 2006), 2M1017+1308 (2003AJ....126.1526B), 2M1239+5515 (Gizis et al., 2003) and 2M2028+0052 (Pope et al., 2013) with separations listed in Table 1.
4 Kinematic analysis
In our Astrometry Sample we have 260 objects consisting of 239 L and 21 T dwarfs. There are 22 known binary systems in our sample each of which we treat as just one tracer for our kinematical analysis, hence we have 238 tracers for consideration. These tracers are distributed within 100 pc in distance with a median value of 21 pc and represent the very close Solar neighborhood. In this sample, 70 objects have radial velocity () measurements: 41 from Blake et al. (2010) with uncertainties usually less than 0.2 km s-1, and 29 are gathered from various sources (Burgasser et al., 2015; Seifahrt et al., 2010; Prato et al., 2015; Basri et al., 2000; Reiners & Basri, 2009) with typical uncertainties of 2 km s-1.
4.1 Galactic motions
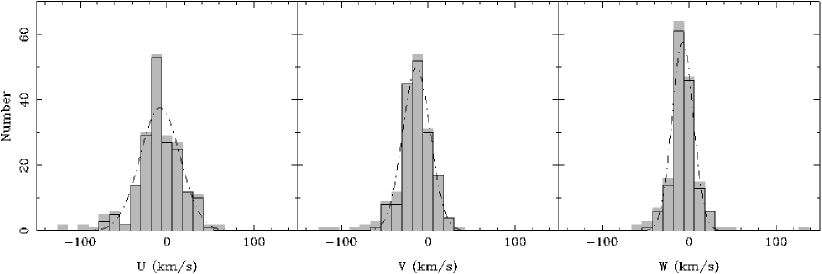
The majority of the dwarfs in our sample do not have radial velocities. However we can estimate two out of the three UVW velocities by determining which motion is most dependent on the unknown radial motion from the target location and calculating the other two velocities assuming a radial velocity of zero (Lépine et al., 2013). We tested this procedure with simulations and comparing the global parameters of the sub-sample with known radial velocities and found no evidence for biases. Together with the 70 objects with measured radial velocities, we find 200, 182 and 164 measurements of U, V and W velocities respectively. The distributions of these three velocity components are shown as histograms in Fig. 3.
4.2 Velocity distributions
We first examine the velocity distribution properties in the Galactic reference frame, i.e. the average values and the dispersions of all , and components. To exclude high velocity objects we use clipping in all of the , and distributions. If an object is rejected from one of these velocity components, it will also not be used in the other two components. An iterative process was employed to produce a clean final sample yielding 21 outliers and 217 tracers. The trimmed tracer numbers () for , and components are 181, 167 and 145. Their average velocities () and dispersions () are listed in Table 3. In Fig. 3 we see the trimmed sample dwarfs are well matched to Gaussian distributions. A Kolmogorov–Smirnov test of the distributions indicates the untrimmed data is not Gaussian at the 95% level while the trimmed samples are, from which we conclude the cleaning process is required.
| , , | ||||
|---|---|---|---|---|
| (km s-1) | (km s-1) | (km s-1) | ||
| 200, 181, 111 | ||||
| 182, 165, 95 | ||||
| 164, 147, 147 | ||||
Columns 1 to 6: (1) the space velocity components; (2) the derived number of tracers for each space velocity component, the number after 3 trimming and number of tracers with velocity of W; (3) mean velocity; (4) dispersion;(5) W-weighted velocity dispersion.
Our velocity data are all heliocentric, so the average value of the sample reflects the anti-motion of the solar system relative to these dwarfs. Using our dwarfs for reference we find km s-1. These average values agree within 2 of recent literature results for the solar motion, e.g., Schönrich et al. (2010) re-examine the HIPPARCOS data and conclude that km s-1, with additional systematic uncertainties (1, 2, 0.5) km s-1, and Huang et al. (2015) derive km s-1, based on radial velocities from the LAMOST results (2015arXiv150501570L). These agreements, especially in the Galactic rotation direction (), indicate that our dwarf sample is not much different from the motion of the local standard of rest.
The velocity dispersions of our sample are km s-1. We compare our values to other velocity dispersions that focus on late M, L and T dwarfs, e.g., (30.2, 16.5, 15.8) km s-1 from Zapatero Osorio et al. (2007), (22, 28, 17) km s-1 from Faherty et al. (2009), (25, 23, 20) km s-1 from Schmidt et al. (2010) and (33.8, 28.0, 16.3) km s-1 from Seifahrt et al. (2010). Our results are consistent but systematically smaller than these literature values. These differences might be due to small sample sizes, incomplete outlier exclusion or, as we require there to be a parallax determination, our sample will be biased to brighter, hence younger, examples.
4.3 Kinematical age estimation
Since there are various heating process in the dynamic evolution of the disk, it was found that there is a monotonic increase of the velocity dispersion with the mean age of a given stellar population (Wielen, 1977).
We use two methods to find ages from this empirical relation. Firstly, we employ the velocity-dependent diffusion relationship of Wielen (1977), equation 13 for age Gyr:
| (1) |
where is the statistical age measured in Gyr, km s-1 and (km s-1)3 Gyr-1 and is the total velocity dispersion measured by -weighted velocity dispersion of all three components. The dispersion results, together with the number of dwarfs with -velocity (), are listed in Table 3. For km s-1, we obtain the age of our sample as Gyr.
Secondly we follow the development in Binney & Tremaine (2008) via the power-law relation:
| (2) |
where is the unweighted total velocity dispersion, and we used all six best-fit parameter sets of , and in Table 2 of Aumer & Binney (2009) to provide an average age in (). With km s-1, we find Gyr. The results of both above methods are consistent. This time scale is roughly 8 times longer than the orbital period of the Galactic rotation at the solar position, so our sample dwarfs should be kinematically mixed with the disk, which is also expressed by the velocity dispersion ratios.
| Ref. | Sample | Method | Age (Gyr) |
|---|---|---|---|
| R1 | 63 M7-M9.5 pc dwarfs | 1 | 3.1 |
| R2 | 43 L dwarfs | 1 | |
| R3 | 16 normal colour late-L dwarfs | 1,2 | |
| R3 | 28 unusually blue L dwarfs | 1,2 |
In Table 4 we list age estimations from literature which use the same methods as here but with different samples. The estimated kinematic ages for nearby low mass star and brown dwarfs have a large spread, however, our sample is found to be significantly younger. We note that our kinematic age estimation is directly related to the total velocity dispersion. Velocity dispersion can be affected by the sample size, sample population, and, peculiar objects with large velocity etc. In Table 4 each sample - late M dwarfs, small samples, color selected objects - have characteristics that could produce larger velocity dispersions. Our sample is significantly bigger than those in Table 4 and the outlier rejection is crucial to remove contamination by thick disk or halo objects. With this in mind we review the 21 rejected outliers.
Comparing the colors of the selected and rejected samples we find the median value of the 21 outliers is 0.2 mag bluer than that of the normal dwarfs, though both outliers and the normal dwarf sample have large dispersions in color. This finding is consistent with the result of Burgasser et al. (2015) that unusually blue L-dwarfs have a large velocity dispersion. Since our goal is to have a tracer sample and not a volume-complete sample we believe a rejection of 10% should not form a significant bias and hence we are confident of our rejection criteria.
Fig. 8 of Burgasser (2004) shows that the median age of late M and very early L dwarfs, where you still have main sequence objects, is 4 Gyr, while mid- to late-Ls have a median age of below 2 Gyr and T dwarfs have a median age of 5 Gyr. As our sample is predominantly mid- to late-L dwarfs an age of about 2 Gyr is therefore not unexpected. Also considering our selection criteria that required the targets to have a measured parallax which combined with the normal procedures in building parallax target lists means that our sample will be biased to brighter candidates, which tend to be younger.
5 Conclusion
In this paper we report new parallax measurements for ten L and early T type dwarfs using the robotic LT telescope, of these, five had no previous distance determinations. We used the same method as WJS14 adopted for five L dwarfs using the LT SDSS band data. We study their motions and conclude that they are probably members of the galactic disk.
The location of our ten targets in the SpT-Mag diagrams have shown the reliability of our trigonometric parallax measurements. In the 2MASS and WISE absolute magnitude versus spectral type diagrams we find four LT targets are over-luminous which are the known binaries 2M0423-0414, 2M1017+1308, 2M1239+5515 and 2M2028+0052.
We have combined our sample with literature L and T dwarfs compiling a list of 260 objects with measured parallaxes, proper motions, radial velocities (for 70 objects) as well as 2MASS and WISE magnitudes which are listed in the online table. We study the velocity distribution and the kinematic age of this sample. We derive the solar motion km s-1, which is consistent with recent literature. The velocity dispersion of our sample is km s-1. The kinematical age of our sample is 1.5-1.7 Gyr, significantly younger than other estimates for the ages of other samples of late M and L dwarfs. We believe that this arises because our sample is dominated by mid to late L dwarfs, and, biased to intrinsically brighter, therefore younger, examples.
Appendix A Figures
References
- Allers & Liu (2013) Allers, K. N., & Liu, M. C. 2013, ApJ, 772, 79
- Aumer & Binney (2009) Aumer, M., & Binney, J. J. 2009, MNRAS, 397, 1286
- Basri et al. (2000) Basri, G., Mohanty, S., Allard, F., et al. 2000, ApJ, 538, 363
- Becklin & Zuckerman (1988) Becklin, E. E., & Zuckerman, B. 1988, Nature, 336, 656
- Berta et al. (2008) Berta, S., Rubele, S., Franceschini, A., et al. 2008, A&A, 488, 533
- Binney & Tremaine (2008) Binney, J., & Tremaine, S. 2008, Galactic Dynamics: Second Edition, by James Binney and Scott Tremaine. ISBN 978-0-691-13026-2 (HB). Published by Princeton University Press, Princeton, NJ USA, 2008.,
- Blake et al. (2010) Blake, C. H., Charbonneau, D., & White, R. J. 2010, ApJ, 723, 684
- Burgasser (2004) Burgasser, A. J. 2004, ApJS, 155, 191
- Burgasser (2009) Burgasser, A. J. 2009, The Ages of Stars, 258, 317
- Burgasser (2014) Burgasser, A. J. 2014, Astronomical Society of India Conference Series, 11,
- Burgasser et al. (2006) Burgasser, A. J., Geballe, T. R., Leggett, S. K., Kirkpatrick, J. D., & Golimowski, D. A. 2006, ApJ, 637, 1067
- Burgasser et al. (2006) Burgasser, A. J., Kirkpatrick, J. D., Cruz, K. L., et al. 2006, ApJS, 166, 585
- Burgasser et al. (2015) Burgasser, A. J., Logsdon, S. E., Gagné, J., et al. 2015, ApJS, 220, 18
- Burningham et al. (2013) Burningham, B., Cardoso, C. V., Smith, L., et al. 2013, MNRAS, 433, 457
- Casewell et al. (2008) Casewell, S. L., Jameson, R. F., & Burleigh, M. R. 2008, MNRAS, 390, 1517
- Dupuy & Liu (2012) Dupuy, T. J., & Liu, M. C. 2012, ApJS, 201, 19
- Faherty et al. (2009) Faherty, J. K., Burgasser, A. J., Cruz, K. L., et al. 2009, AJ, 137, 1
- Faherty et al. (2013) Faherty, J. K., Cruz, K. L., Rice, E. L., & Riedel, A. 2013, Mem. Soc. Astron. Italiana, 84, 955
- Faherty et al. (2016) Faherty, J. K., Riedel, A. R., Cruz, K. L., et al. 2016, ApJS, 225, 10
- Gauza et al. (2015) Gauza, B., Béjar, V. J. S., Pérez-Garrido, A., et al. 2015, ApJ, 804, 96
- Gizis et al. (2003) Gizis, J. E., Reid, I. N., Knapp, G. R., et al. 2003, AJ, 125, 3302
- Huang et al. (2015) Huang, Y., Liu, X.-W., Yuan, H.-B., et al. 2015, MNRAS, 449, 162
- Jameson et al. (2008) Jameson, R. F., Casewell, S. L., Bannister, N. P., et al. 2008, MNRAS, 384, 1399
- Kirkpatrick et al. (2000) Kirkpatrick, J. D., Reid, I. N., Liebert, J., et al. 2000, AJ, 120, 447
- Kirkpatrick et al. (2010) Kirkpatrick, J. D., Looper, D. L., Burgasser, A. J., et al. 2010, ApJS, 190, 100
- Kirkpatrick et al. (2011) Kirkpatrick, J. D., Cushing, M. C., Gelino, C. R., et al. 2011, ApJS, 197, 19
- Kirkpatrick et al. (2012) Kirkpatrick, J. D., Gelino, C. R., Cushing, M. C., et al. 2012, ApJ, 753, 156
- Knapp et al. (2004) Knapp, G. R., Leggett, S. K., Fan, X., et al. 2004, AJ, 127, 3553
- Lépine et al. (2013) Lépine, S., Hilton, E. J., Mann, A. W., et al. 2013, AJ, 145, 102
- Luo et al. (2015) Luo, A.-L., Zhao, Y.-H., Zhao, G., et al. 2015, Research in Astronomy and Astrophysics, 15, 1095
- Marocco et al. (2015) Marocco, F., Jones, H. R. A., Day-Jones, A. C., et al. 2015, MNRAS, 449, 3651
- Monet et al. (1992) Monet, D. G., Dahn, C. C., Vrba, F. J., et al. 1992, AJ, 103, 638
- Nakajima et al. (1995) Nakajima, T., Oppenheimer, B. R., Kulkarni, S. R., et al. 1995, Nature, 378, 463
- Oppenheimer et al. (2001) Oppenheimer, B. R., Hambly, N. C., Digby, A. P., Hodgkin, S. T., & Saumon, D. 2001, Science, 292, 698
- Pinfield et al. (2008) Pinfield, D. J., Burningham, B., Tamura, M., et al. 2008, MNRAS, 390, 304
- Pope et al. (2013) Pope, B., Martinache, F., & Tuthill, P. 2013, ApJ, 767, 110
- Prato et al. (2015) Prato, L., Mace, G. N., Rice, E. L., et al. 2015, ApJ, 808, 12
- Reid et al. (2001) Reid, I. N., Sahu, K. C., & Hawley, S. L. 2001, ApJ, 559, 942
- Reiners & Basri (2009) Reiners, A., & Basri, G. 2009, ApJ, 705, 1416
- Schmidt et al. (2010) Schmidt, S. J., West, A. A., Hawley, S. L., & Pineda, J. S. 2010, AJ, 139, 1808
- Schönrich et al. (2010) Schönrich, R., Binney, J., & Dehnen, W. 2010, MNRAS, 403, 1829
- Seifahrt et al. (2010) Seifahrt, A., Reiners, A., Almaghrbi, K. A. M., & Basri, G. 2010, A&A, 512, A37
- Skrutskie et al. (2006) Skrutskie, M. F., Cutri, R. M., Stiening, R., et al. 2006, AJ, 131, 1163
- Smart et al. (2007) Smart, R. L., Lattanzi, M. G., Jahreiß, H., Bucciarelli, B., & Massone, G. 2007, A&A, 464, 787
- Smart et al. (2003) Smart, R. L., Lattanzi, M. G., Bucciarelli, B., et al. 2003, A&A, 404, 317
- Steele et al. (2004) Steele, I. A., Smith, R. J., Rees, P. C., et al. 2004, Proc. SPIE, 5489, 679
- Stone (2002) Stone, R. C. 2002, PASP, 114, 1070
- Wang et al. (2014) Wang, Y., Jones, H. R. A., Smart, R. L., et al. 2014, PASP, 126, 15
- Weinberger et al. (2016) Weinberger, A. J., Boss, A. P., Keiser, S. A., et al. 2016, AJ, 152, 24
- Wielen (1977) Wielen, R. 1977, A&A, 60, 263
- York et al. (2000) York, D. G., Adelman, J., Anderson, J. E., Jr., et al. 2000, AJ, 120, 1579
- Zapatero Osorio et al. (2007) Zapatero Osorio, M. R., Martín, E. L., Béjar, V. J. S., et al. 2007, ApJ, 666, 1205