A Longitudinal Study of Google Play
Abstract
The difficulty of large scale monitoring of app markets affects our understanding of their dynamics. This is particularly true for dimensions such as app update frequency, control and pricing, the impact of developer actions on app popularity, as well as coveted membership in top app lists. In this paper we perform a detailed temporal analysis on two datasets we have collected from the Google Play Store, one consisting of 160,000 apps and the other of 87,223 newly released apps. We have monitored and collected data about these apps over more than 6 months. Our results show that a high number of these apps have not been updated over the monitoring interval. Moreover, these apps are controlled by a few developers that dominate the total number of app downloads. We observe that infrequently updated apps significantly impact the median app price. However, a changing app price does not correlate with the download count. Furthermore, we show that apps that attain higher ranks have better stability in top app lists. We show that app market analytics can help detect emerging threat vectors, and identify search rank fraud and even malware. Further, we discuss the research implications of app market analytics on improving developer and user experiences.
I Introduction
The revolution in mobile device technology and the emergence of “app markets”, have empowered regular users to evolve from technology consumers to enablers of novel mobile experiences. App markets such as Google Play provide new mechanisms for software distribution, collecting software written by developers and making it available to smartphone users. This centralized approach to software distribution contrasts the desktop paradigm, where users obtain their software directly from developers.
Developers and users play key roles in determining the impact that market interactions have on future technology. However, the lack of a clear understanding of the inner workings and dynamics of popular app markets, impacts both developers and users. For instance, app markets provide no information on the impact that developer actions will likely have on the success of their apps, or guidance to users when choosing apps, e.g., among apps claiming similar functionality.
This situation is exploited however by fraudulent and malicious developers. The success of Google Play and the incentive model it offers to popular apps 111 Google offers financial incentives for contribution to app development, by making revenue sharing transparent for developers (70-to-30 cut, where developers get 70% of the revenue)., make it an appealing target for fraudulent and malicious behaviors. Fraudulent developers have been shown to attempt to engineer the search rank of their apps [34], while malicious developers have been shown to use app markets as a launch pad for their malware [26, 28, 33, 20].
Contributions. In this article we seek to shed light on the dynamics of Google Play, the most popular Android app market. We report results from one of the first characteristic studies on Google Play, using real-world time series data. To this end, we have developed iMarket, a prototype app market crawling system. We have used iMarket to collect data from more than 470,000 Google Play apps, and daily monitor more than 160,000 apps, over more than 6 months.
We use this data to study two key aspects of Google Play. First, we seek to understand the dynamics of the market in general, from an application and developer perspective. For this, we evaluate the frequency and characteristics of app updates (e.g., their effects on bandwidth consumption), and use the results to determine if developers price their apps appropriately. We show that only 24% of the 160,000 app that we monitored have received an update within 6 months, and at most 50% of the apps in any category have received an update within a year from our observation period. We conclude that market inactivity has a significant impact on the price distribution. Therefore, while pricing is an important and complex task, relying on statistics computed on the entire population (as opposed to only active apps) may mislead developers, e.g., to undersell their apps (VI-A). Also, we show that typical app update cycles are bi-weekly or monthly. More frequently updated apps (under beta-testing or unstable) can impose substantial bandwidth overhead and expose themselves to negative reviews (VI-C).
To evaluate the developer impact, we first seek to verify our hypothesis that a few developers control the app market supply. Our analysis reveals however that developers that create many applications are not creating many popular applications. Instead, we discovered that a few elite developers are responsible for applications that dominate the total number of downloads (VII). Second, we evaluate the impact of developer actions on the popularity of their apps. We show that few apps frequently change prices, and with every subsequent software update, a developer is more likely to decrease the price. However, changing the price does not show an observable association with the app’s download count(VII).
A second key aspect of Google Play that we study is the temporal evolution of top-k ranked lists maintained by the market. Top-k lists reveal the most popular applications in various categories. We show that a majority of apps in top-k app lists follow a “birth-growth-decline-death” process: they enter and exit from the bottom part of a list. Apps that attain higher ranks have better stability in top-k lists than apps that are at lower ranks (VIII).
Impact of the study. A longitudinal study of Google Play app metadata can provide unique information that is not available through the standard approach of capturing a single app snapshot. Features extracted from a longitudinal app analysis (e.g., permission, price, update, download count changes) can provide insights into fraudulent app promotion and malware indicator behaviors. For instance, spikes in the number of positive or negative reviews and the number of downloads received by an app can indicate app search optimization campaigns launched by fraudsters recruited through crowdsourcing sites. Frequent, substantial app updates may indicate Denial of Service (DoS) attacks, while permission changes can indicate benign apps turning malicious see IX-A. Features extracted from a longitudinal app monitoring can be used to train supervised learning algorithms to detect such behaviors.
In addition, a detailed longitudinal study of Google Play apps can improve developer and user experiences. For instance, app development tools can help developers optimize the success of their apps. Such tools can integrate predictions of the impact that price, permissions and code changes will have on the app’s popularity, as well as insights extracted from user reviews. In addition, visualizations of conclusions, and analytics similar to the ones we perform in this paper, can help users choose among apps with similar claimed functionality.
We include a detailed discussion of the applicability and future research directions in app market analytics in IX.
II Related Work
This article extends our preliminary work [10] with iMarket, the market crawler we developed and used to collect the data, new scores to evaluate the evolution and variability of top-k lists and new experiments and evaluations.
Viennot et al. [35] developed PlayDrone, a crawler to collect Google Play data. Their main finding is that Google Play developers often include secret key information in the released apps, making them vulnerable to attacks. They further analyze the data and show that Google Play content evolves quickly in time, that 25% of apps are clones, and that native experience correlates strongly to popularity. The analysis is performed over data collected for 3 non-contiguous months (May/June 2013 and November 2013). In contrast, our analysis is performed over apps monitored daily over more than 6 months. Furthermore, our analysis includes orthogonal app market dynamics dimensions, that include the frequency and cycles of app updates, the developer impact and control on the app market, and the dynamics of top-k lists.
Zhong and Michahelles [40] analyze a dataset of Google Play transactions, and suggest that Google Play is more of a “Superstar” market (i.e., dominated by popular hit products) than a “Long-tail” market (i.e., where unpopular niche products contribute to a substantial portion of popularity). In addition, Zhong and Michahelles [40] show that certain expensive professional apps attract disproportionately large sales. This is consistent with our finding that a few developers are responsible for the most popular apps.
Möller et al. [29] use an app they posted on Google Play to study the correlation between published updates and their actual installations. They show that 7 days after a security update is published, almost half of the app’s users still use an older, vulnerable version. Liu et al. [25] use a dataset of 1,597 ranked mobile apps to conclude that the “freemium” strategy is positively associated with increased sales volume and revenue of the paid apps. Moreover, they show that free apps that rate higher contribute to higher revenue for the paid version. We note that our work studies a multitude of previously unanswered questions about Google Play, regarding app update frequency and pricing appropriateness, and the evolution of top-k lists.
Petsas et al. [30] explored mobile app markets in the context of 4 providers, that do not include Google Play. They show that the distribution of app popularity deviates from Zipf, due in part to a strong temporal affinity of user downloads to app categories. They show that on the markets they studied, paid apps follow a different popularity distribution than free apps. In contrast, our work exclusively analyzes Google Play, the most popular Android app market. In addition, we focus on different dimensions: (i) app update frequency and its effect on app pricing and resource consumption, (ii) the control of the market and the effect of developer actions on the popularity of their apps and (iii) the evolution in time of top apps and top-k app lists.
Xu et al. [39] use IP-level traces from a tier-1 cellular network provider to understand the behavior of mobile apps. They provide an orthogonal analysis of spatial and temporal locality, geographic coverage, and daily usage patterns.
Security has been a theme in the large scale collection of mobile apps. Previous work includes malware detection [42], malware analysis [41], malicious ad libraries [19], vulnerability assessment [15], overprivilege identification [16] and detection of privacy leaks [14]. While in this paper we focus on the different problem of understanding the dynamics of Google Play, we also introduce novel mobile app attacks.
III Google Play Overview
App Distribution Channel: Google Play is the app distribution channel hosted by Google. Each app submitted by a developer gets an entry on the market in the form of a webpage, accessible to users through either the Google Play homepage or the search interface. This webpage contains meta-information that keeps track of information pertaining to the application (e.g., name, category, version, size, prices). In addition, Google Play lists apps according to several categories, ranging from “Arcarde & Action” to “Weather”. Users download and install apps of interest, which they can then review. A review has a rating ranging from 1 to 5. Each app has an aggregate rating, an average over all the user ratings received. The app’s webpage also includes its usage statistics (e.g., rating, number of installs, user reviews). This information is used by users when they are deciding to install a new application.
App Development: In order to submit apps to Google Play, an Android developer first needs to obtain a publisher account for a one-time fee of $25. The fee encourages higher quality products and reduces spam [18]. Google does not limit the number of apps that can be submitted by developers. As a measure to reduce spam, Google recently started the Bouncer [3] service, which provides automated scanning of applications on Google Play for potential malware. Developers can sell their apps for a price of their choice, or distribute them for free.
Permission Model: Android follows the Capability-based [24] security model. Each app must declare the list of capabilities (permissions) it requires in a manifest file called Android-Manifest.xml. When a user downloads an app through the Google Play website, the user is shown a screen that displays the permissions requested by the application. Installing the application means granting the application all the requested permissions i.e. an all-or-none approach.
IV Data Collection
We use snapshot to refer to the entire state of the market i.e., it contains meta information of all apps. We first describe iMarket, our app market crawler, then describe the datasets that we collected from Google Play.
IV-A The iMarket Crawler
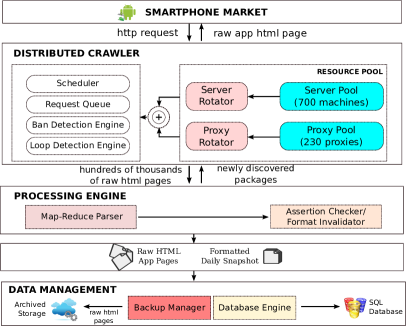
iMarket, our prototype market crawling system (see Figure 1 for an overview) consists of three main components. First, the Distributed Crawler component, which is responsible for crawling the target market and collecting information on various apps that are accessible from the current geographical location. We initially leveraged hundreds of foreign proxies to address challenge 3 above. However, we later decided to rely only on local US-based proxies for stability reasons. While this trades-off completeness for consistency, having continuous information about a few apps improves the accuracy of most statistical inference tasks compared to having discrete information about hundreds of thousands of apps.
To seed our distributed crawler, we initially ran it using a list consisting of about 200 randomly hand-picked apps from different categories. To address Challenge 1, our app discovery process is designed as follows: After retrieving each page, the “Similar Apps” portion of the raw HTML page is parsed to obtain a new list of packages. These packages are queued for crawling and simultaneously appended to the previous day’s package list. We have also detected a ban detection engine in place that deactivates servers once it observes a threshold number of “404 Not Found” messages (Challenge 2) from the market provider.
The second component, the “Processing Engine” contains a Map-Reduce Parser component that uses the map-reduce paradigm [13] to handle parsing of hundreds of thousands of raw HTML app pages. In the “map” stage, a chunk of files (10K) are mapped onto each of the 700 machines and a parser (written in Python) parses these HTML and extracts the meta information. In the “reduce” stage, these individual files are combined into a single file and de-duplicated to maintain data integrity. This stage takes 1-1.5 hours. After constructing the aggregate file, we address Challenge 3 using the assertion checker that takes a best-effort approach to ensure that all the information has been correctly parsed from the raw files. Note that despite our best-effort approach, our dataset still contained some missing information due to temporary unavailability/maintenance of servers.
The third, “Data Management” component, archives the raw HTML pages (14 GB compressed/day) in a cloud storage to support any ad hoc processing for other tasks (e.g., analyzing HTML source code complexity) and subsequently removed from the main servers. To address Challenge 4, the formatted daily snapshot (200 MB/day) is then inserted into a database to support data analytics. We setup the relevant SQL Jobs to ensure that indexes are re-built every two days — this step significantly speeds up SQL queries. Our six months of archived raw files consume 7 TB of storage and the database consumes 400 GB including index files.
V Data
We used iMarket to collect two Google Play datasets, which we call dataset.2012 and dataset.14-15.
V-A Dataset.2012
We have used a total of 700 machines 222We have used 700 machines, each with a different IP address and from a different subnet, in order to avoid getting banned during the crawling process. for a period of 7.5 months (February 2012 - November 2012) to collect data from 470,000 apps. The first 1.5 months are the “warm up” interval. We do not consider data collected during this period for subsequent analysis. Instead, we focus on a subset of 160K apps for which we have collected the following data:
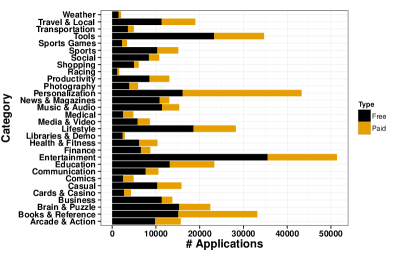
GOOGPLAY-FULL: We used iMarket to take daily snapshots of Google Play store from April - November, 2012. For each app, we have daily snapshots of application meta-information consisting of the developer name, category, downloads (as a range i.e., 10-100, 1K-5K etc.), ratings (on a 0-5 scale), ratings count (absolute number of user ratings), last updated timestamp, software version, OS supported, file size, price, url and the set of permissions that the app requests. Figure 2 shows the distribution of apps by category. While overall, the number of free apps exceed the number of paid apps, several popular categories such as “Personalization” and “Books & References” are dominated by paid apps.
GOOGPLAY-TOPK: Google publishes several lists, e.g., Free (most popular apps), Paid (most popular paid), New (Free) (newly released free apps), New (Paid) (newly released paid) and Gross (highly grossing apps). Each list is divided into 20 pages, each page consisting of 24 apps. These lists are typically updated based on application arrival and the schedule of Google’s ranking algorithms. Since we cannot be notified when the list changes, we took hourly snapshots of the lists. Our GOOGPLAY-TOPK consists of hourly snapshots of five top-k lists ( 3000 apps) from Jul-Nov, 2012 (2880 hours worth of data).
V-B Dataset.14-15
Further, we have used a dataset of more than 87,000 newly released apps that we have monitored over more than 6 months [32]. Specifically, we have collected newly released apps once a week, from Google Play’s “New Release” links, to both free and paid apps. We have validated each app based on the date of the app’s first review: we have discarded apps whose first review was more than 40 days ago. We have collected 87,223 new releases between July and October 2014, all having less than 100 reviews.
We have then monitored and collected data from these 87,223 apps between October 24, 2014 and May 5, 2015. Specifically, for each app we captured “snapshots” of its Google Play metadata, twice a week. An app snapshot consists of values for all its time varying variables, e.g., the reviews, the rating and install counts, and the set of requested permissions. For each of the reviews we have collected from the apps, we recorded the reviewer’s name and id, date of review, review title, text, and rating.
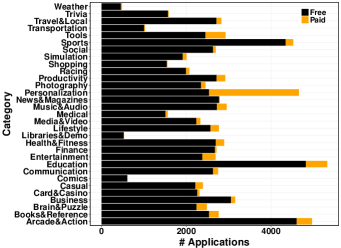
Figure 2 shows the distribution of apps by category. With the exception of the “Personalization” category, the number of free apps significantly exceeds the number of paid apps. We have observed that consistently through our collection effort, we identified fewer top paid than free new releases. One reason for this may be that users tend to install more free apps than paid apps. Thus, not only developers may develop fewer paid apps, but paid apps may find it hard to compete against free versions. We note that free apps bring revenue through ads.
VI Popularity and Staleness
We first evaluate the fraction of apps that are active, and discuss the implications this can have on app pricing. We then classify apps based on their popularity, and study the distribution of per-app rating counts. Finally, we study the frequency of app updates for apps from various classes and the implications they can have on end-users. All the analysis presented in this section is performed using GOOGPLAY-FULL.
VI-A Market Staleness
An important property of a market is its “activity”, or how frequently are apps being maintained. We say that an app is stale if it has not been updated within the last year from the observation period, and active otherwise.
The task of setting the app price is complex. However, relying on statistics computed on the entire population, as opposed to only active apps, may mislead developers. For instance, given that the listing price of apps forms a key component of its valuation and sale, this becomes an important factor for fresh developers trying to enter the market. Specifically, the median price in our dataset is $0.99 when all apps are considered and $1.31 when considering only active apps. This confirm our intuition that developers that set their price based on the former value are likely to sell their apps at lower profits.
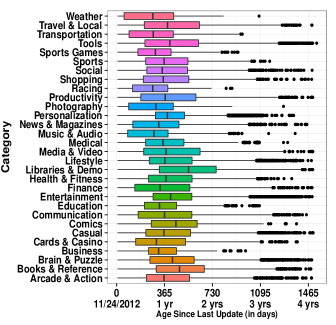
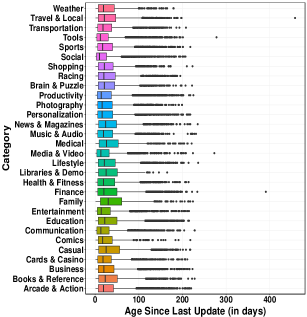
Figure 3 shows the box and whiskers plot [8] of the per-app time since the last update, by app category, for dataset.2012. At most 50% of the apps in each category have received an update within a year from our observation period. For instance, most apps in Libraries & Demo have not been updated within the last 1.5 years. Some categories such as Arcade & Action, Casual, Entertainment, Books & Reference, Tools contain apps that are older than three years.
Figure 3 plots this data for dataset.14-15. Many freshly uploaded apps were uploaded more recently: 50% apps in each category receive an update within 35 days, while apps in the “Social” and “Tools” categories received updates even within 15 days. This is natural, as new apps may have more bugs and receive more developer attention.
Several reasons may explain the lack of updates received by many of the apps we monitored. First, some apps are either stable or classic (time-insensitive apps, not expected to change) and do not require an update. Other apps, e.g., e-books, wallpapers, libraries, do not require an update. Finally, many of the apps we monitored seemed to have been abandoned.
VI-B App Popularity
| Class | # download | % Dataset.2012 | % Dataset.14-15 |
|---|---|---|---|
| Unpopular | – | 74.14 | 77.55 |
| Popular | – | 24.1 | 18.43 |
| Most-Popular | 0.7 | 4.00 |
We propose to use the download count to determine app popularity. Higher rating counts mean higher popularity but not necessarily higher quality (e.g., an app could attract many negative ratings). Including unpopular apps will likely affect statistics such as update frequencies: including unpopular apps will lead to a seemingly counter-intuitive finding, indicating that most apps do not receive any updates. Therefore, we classify apps according to their popularity into three classes, “unpopular”, “popular” and “most-popular”.
Table I shows the criteria for the 3 classes and the distribution of the apps in dataset.2012 and dataset.14-15 in these classes. The newly released apps have a higher percentage of unpopular apps, however, surprisingly, they also have a higher percentage of “most-popular” apps. This may be due to the fact that the newly released apps are more recent, coming at a time of higher popularity of mobile app markets, and maturity of search rank fraud markets (see IX-A).
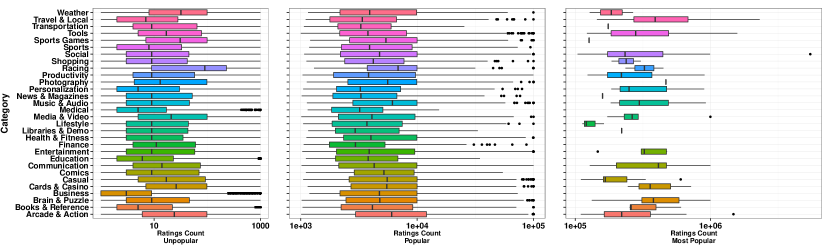
Figure 4 (top) depicts the distribution of rating counts of apps from dataset.2012, split by categories. We observe that the Business and Comics categories do not have any apps in the Most-Popular class, likely because of narrow audiences. From our data, we observed that the median price of apps ($1.99) in these categories is significantly higher than the population ($1.31) indicating lower competition. The population in other categories is quite diverse with a number of outliers. For instance, as expected, “Angry Birds” and “Facebook” are most popular among the Most-Popular class for Arcade & Action and Social categories, respectively. On the other hand, the distribution is almost symmetric in case of Unpopular except Business and Medical categories where there are a number of outliers that are significantly different from the rest of the population. We found that these are trending apps — apps that are gaining popularity. For instance, the free app “Lync 2010” from “Microsoft Corporation” in Business has 997 ratings. In case of Popular, the distributions for most of the categories are symmetric and span roughly from to ratings where 75% of apps have less than rating counts except Arcade & Action category.
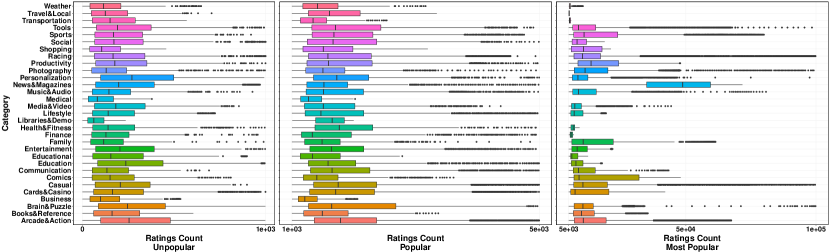
Figure 4 (bottom) shows the same distribution for the apps in dataset.14-15. We emphasize that the distribution is plotted over the ratings counts at the end of the observation interval. Since these are newer apps than those in dataset.2012, it is natural that they receive fewer ratings. We also observe that several categories do not have apps that are in the “most popular” category, including the “Business”, “Libraries & Demo” and “Medical” categories.
VI-C App Updates
Updates form a critical and often the last part of the software lifecycle [17]. We are interested in determining if mobile app developers prefer seamless updating i.e., if they push out releases within short time periods.
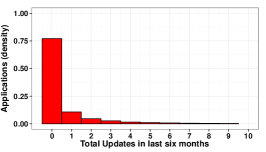
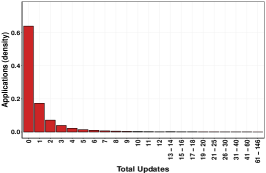
Fig. 5 shows the distribution of the number of updates received by the apps in dataset.2012. Only 24% apps have received at least one update within our observation period — nearly 76% have never been updated. In contrast, Fig. 5 shows that 35% of the “fresh” apps in dataset.14-15 have received at least one update within our observation period. Several apps received more than 100 updates, with one app receiving 146 updates in a 6 months interval. We conjecture that this occurs because these are newly released apps, thus more likely to have bugs, and to receive attention from their developers.
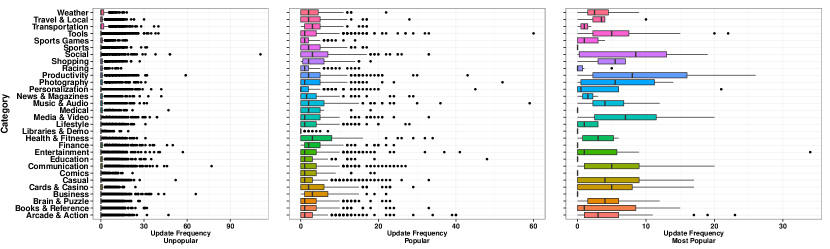
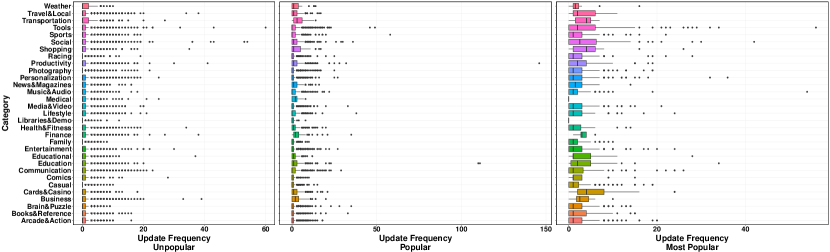
Figure 6 (top) plots the distribution of the update frequency of the apps from dataset.2012, across categories based on their popularity. As expected, Unpopular apps receive few or no updates. We observed that this is due to the app being new or abandoned by its developer. For instance, “RoboShock” from “DevWilliams” in Arcade & Action with good reviews from 4 users has received only one update on September 28, 2012 since its release in August 2011 (inferred from its first comment). Another app “Shanju” from “sunjian” in Social has not been updated since May 27, 2012 even though it received negative reviews.
Outliers (e.g., “Ctalk” in the Social category) push out large number of updates (). Popular apps are updated more frequently: 75% in each category receive 10 or fewer updates, while some apps average around 10-60 updates during our observation period. User comments associated with these apps indicate that the developer pushes out an update when the app attracts a negative review (e.g., “not working on my device!”). In the Most-Popular category, the population differs significantly. While some apps seldom push any updates, apps like “Facebook” (Social) have been updated 17 times. The lower number of updates of most popular apps may be due to testing: Companies that create very popular apps are more likely to enforce strict testing and hence may not need as many updates as other apps.
To identify how frequently developers push these updates, we computed the average update interval (AUI) per app measured in days (figure not shown). In Popular and Unpopular classes, 50% of apps receive at least one update within 100 days. The most interesting set is a class of Unpopular apps that receive an update in less than a week. For instance, the developer of “Ctalk” pushed, on average, one update per day totaling 111 updates in six months indicating development stage (it had only 50-100 downloads) or instability of the app. On the other hand, Most-Popular apps receive an update within 20 to 60 days.
Figure 6 (bottom) shows the update frequency for the newly released apps of dataset.14-15. Compared to the apps in dataset.2012, new releases exhibit a similar update frequency distribution, with slightly lower third quartiles. However, a few newly released popular apps receive significantly more updates, some more than 100 updates.
Updates, bandwidth and reputation. A high update frequency is a likely indicator of an on-going beta test of a feature or an unstable application. Such apps have the potential to consume large amounts of bandwidth. For instance, a music player “Player Dreams”, with 500K-1M downloads, pushed out 91 updates in the last six months as part of its beta testing phase (inferred from app description). With the application size being around 1.8 MB, this app has pushed out 164 MB to each of its users. Given its download count of 500K-1M, each update utilizes 0.87-1.71 TB of bandwidth. We have observed that frequent updates, especially when the app is unstable, may attract negative reviews. For instance, “Terremoti Italia” that pushed out 34 updates in the observation interval, often received negative reviews of updates disrupting the workflow.
Furthermore, app market providers can use these indicators to inform users about seemingly unstable applications and also as part of the decision to garbage collect abandoned apps.
VI-D App Category Changes
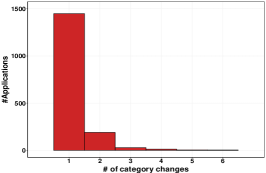
In the fresh app dataset.14-15 we found app category change events, e.g., “Social” to “Communication”, “Photography” to “Entertainment”, between different game subcategories. Such category changes may enable developers to better position their apps and improve on their install and download count, as categories may overlap, and apps may stretch over multiple categories. Fig. 5 shows the distribution of the number of app category changes recorded over the 6 months in dataset.14-15. Only 1.9% of apps have received at least one category change.
VII Developer Impact
In this section, we are interested in understanding what fraction of popular apps are being controlled by an elite set of developers and if there is a power-law effect in-place. Next, we analyze the impact that developer actions (e.g., changing the price, permissions etc.) can have on the app popularity. We use dataset.2012 for this analysis.
VII-A Market Control
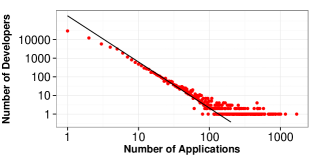
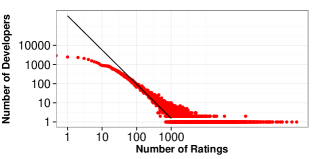
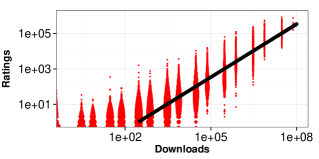
To understand the impact that developers have on the market, we observe their number of apps, downloads, and review count. Figure 7 plots these distributions, all showing behavior consistent with a power-law distribution [27]. We display the maximum likelihood fit of a power-law distribution for each scatter plot as well [22, 11]. Figure 7(a) shows that a few developers have a large number of apps while many developers have few apps. However, the developers that post the most apps do not have the most popular apps in terms of reviews and download counts. Instead, Figure 7(b) shows that a few developers control apps that attract most of the reviews. Since Figure 7(c) shows an almost linear relation between review and download counts (1 review for each 300 downloads), we conclude that the apps developed by the controlling developers are popular.
VII-B Price Dispersion
Menu costs (incurred by sellers when making price changes) are lower in electronic markets as physical markets incur product re-labeling costs [23]. In app markets menu costs are zero. We now investigate if developers leverage this advantage i.e., if they adjust their prices more finely or frequently.
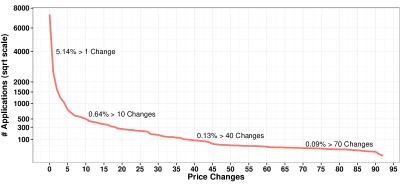
Figure 8 shows a variation of the complementary cumulative distribution frequency (CCDF) of the number of price changes an app developer made during our observation period. Instead of probabilities, the axis shows the square root of the number of apps with a number of price changes exceeding the value shown on the axis. We observe that 5.14% of the apps (4000) have changed their price at least once. The tail ( 70 changes) is interesting — about 23 apps are frequently changing their prices. From our data, we observed that they are distributed as follows: Travel & Local (11), Sports (5), Business (2), Brain & Puzzle (2) and one in each of Education, Finance, and Medical. In this sample, “LogMeIn Ignition”, developed by LogMeIn, has 10K-50K downloads and underwent 83 price changes (Min:$18.44, Max:$27.80, Avg:$26.01, Stdev:$2.01). The rest were either recently removed or are unpopular.
Price dispersion is the spread between the highest and lowest prices in the market. In our dataset, we used the coefficient of variation (COV) [38], the ratio of standard deviation to the mean, to measure price dispersion. COV indicates a dispersal consistent with a Poisson process i.e., uniformly at random; COV indicates greater variability than would be expected with a Poisson process; and COV indicates less variation. In our dataset, we observed an average COV (computed for all apps) to be 2.45 indicating a non-negligible price dispersion, in agreement with results in the context of other electronic markets [9].
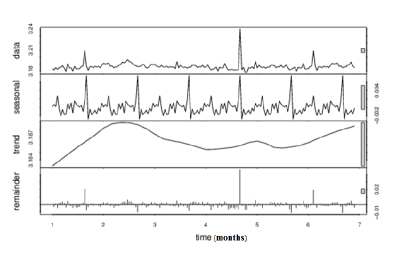
Figure 9 shows the STL decomposition [12] of the average price time series in the observation interval, for a periodicity of one month. The gray-bar on the “monthly panel” (see Figure 9) is only slightly larger than that on the “data” panel indicating that the monthly signal is large relative to the variation in the data. In the “trend” panel, the gray box is much larger than either of the ones on the “data”/“monthly” panels, indicating the variation attributed to the trend is much smaller than the monthly component and consequently only a small part of the variation in the data series. The variation attributed to the trend is considerably smaller than the stochastic component (the remainders). We deduce that in our six month observation period this data does not exhibit a trend.
VII-C Impact of Developer Actions
Developers have control over several attributes they can leverage to increase the popularity of their apps, e.g., pricing, the number of permissions requested from users and the frequency of updates. In this section we investigate the relation between such levers and their impact on app popularity. For instance, common-sense dictates that a price reduction should increase the number of downloads an app receives.
| D | P | P | RC | SV | TP | TP | |
|---|---|---|---|---|---|---|---|
| D | 0.18 | -0.02 | 0.13 | 0.34 | 0.09 | 0.21 | |
| P | 0.18 | -1.00 | 0.09 | 0.89 | 0.89 | 0.93 | |
| P | -0.02 | -1.00 | -0.23 | 0.72 | 0.51 | 0.76 | |
| RC | 0.13 | 0.09 | -0.23 | 0.73 | 0.65 | 0.70 | |
| SV | 0.34 | 0.89 | 0.72 | 0.73 | 0.99 | 1.00 | |
| TP | 0.09 | 0.89 | 0.51 | 0.65 | 0.99 | -1.00 | |
| TP | 0.21 | 0.94 | 0.76 | 0.70 | 1.00 | -1.00 |
We study the association between app attribute changes. We define a random variable for increase or decrease of each attribute, and measure the association among pairs of variables. For example, let be a variable for price increase. For each day, app tuple, we let be a set of all of the app and day tuples where the app increased its price that day (relative to the previous day’s value). For this analysis we consider 160K apps that have changed throughout our observation period, and we discard the remaining apps. We use the Yule measure of association[37] to quantify the association between two attributes, and : .
is the complement of , i.e., each day, app tuple where the attribute does not occur, and denote the cardinality of a set (in this case ). This association measure captures the association between the two attributes: zero indicates independence, +1 indicates perfectly positive association, and -1 perfectly negative association. Table II shows the measure values for all pairs of download count (D), price (P), review count (RC) and total number of permission (TP) attributes.
Table II shows that a price decrease has a high association with changes in software version and permissions. However, similarly high associations are not observed with a price increase. Thus, when a developer is updating software or permissions they are more likely to decrease the price than increase the price of an app.
We observed that changing the price does not show significant association with the download or review counts. We randomly sampled 50 apps where this is happening and observe the following to be the main reasons. First, apps are initially promoted as free and a paid version is released if they ever become popular. However, in some cases, the feature additions are not significant (e.g., ads vs. no ads) and hence do not cause enough motivation for users to switch to the paid version. Second, with app markets offering paid apps for free as part of special offers (e.g., Thanksgiving deals), users may expect the app to be given out for free rather than take a discount of a few cents.
VIII Top-K Dynamics
A higher position in Google’s top-k lists (see V) is desirable and often attracts significant media attention [1] which in turn increases the app popularity. To analyze the dynamics of app in top-k lists, we have used the GOOGPLAY-TOPK dataset (see V). Google keeps the ranking algorithms for the top-k lists secret. In this section we seek answers to several fundamental questions: How long will an app remain on a top-k list? Will an app’s rank increase any further than its current rank? How long will it take for an app’s rank to stabilize?
VIII-A Top-K App Evolution
| Metric | Description |
|---|---|
| DEBUT | Debut rank (rank when it first gets onto the list) |
| HRS2PEAK | Hours elapsed from debut until peak rank |
| PEAK | Highest rank attained during its lifetime on the list |
| TOTHRS | Total number of hours spent on the list |
| EXIT | Exit rank (rank during the last hour on the list) |
| RANKDYN | Total ranks occupied during its lifetime on the list |
We investigate first whether apps follow the “birth-growth-decline-death” process (inverted bathtub curve [21]). Although every app’s path may be unique, we can summarize its life on a top-k list using the metrics defined in Table III.
This six-tuple captures a suite of interesting information contained in each app’s list trajectory. To make these summaries comparable, we remove all applications for which we are unable to compute the DEBUT information. For instance, the set of applications obtained during the first hour of the crawl process are removed.
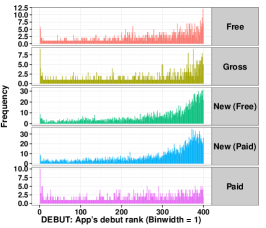
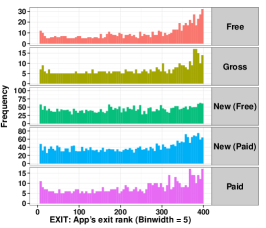
Figures 10 and 10 show the histograms for the DEBUT and EXIT ranks, both indicating list positions, for the 3000 apps we monitored. Smaller numbers indicate better performance. The plots show that most apps entered and exited from the bottom part of the list (indicated by the high debut and exit ranks). This is consistent with the lifetime metaphor discussed earlier. However, a small number of apps entered the list highly ranked. For instance, in the Paid category, the best DEBUT was attained by “ROM Manager”, by “Koushik Datta” that entered at #1 on August 14, 2012, and exited at rank #20 on October 6, 2012, occupying seven different ranks during its lifetime on the list. Another noteworthy DEBUT was attained by “Draw Something”, by “OMGPOP” that entered at #2 on October 1, 2012, peaked to #1 on Oct 25, 2012 and exited at Nov 6, 2012 at #4. During its lifetime, the worst rank it achieved was #38.
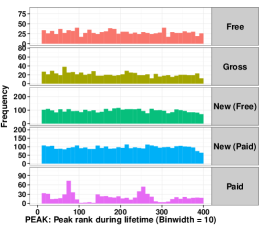
Figure 10 shows the distribution of the peak rank achieved in top-k lists (PEAK) and Figure 11 shows the distribution of the number of hours required for apps to reach the peak (HRS2PEAK).
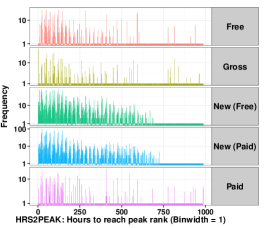
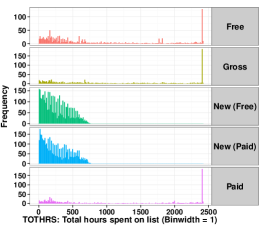
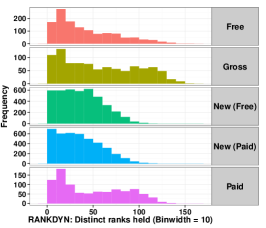
Figure 11 shows the total number of hours spent by apps in the top-k lists (TOTHRS). Figure 11 shows the number of ranks achieved in a top-k list (RANKDYN): very few New (Free) and New (Paid) apps achieve more than 100 different ranks, with most apps achieving 50 or fewer. This differs significantly in the other top-k lists.
Among the many apps with poor DEBUT and EXIT positions, most had a short, uneventful life (i.e., low TOTHRS, poor PEAK, low HRS2PEAK), but several were able to reach a high peak position and/or remain for a long time. One entry, “PS Touch”, by “Adobe”, entered at #413 and has been on the “Gross” list for 2,403 hours ( months, although it peaked only at #206. This app also took a remarkably slow journey (more than two months) to reach that peak and has occupied 137 distinct ranks. Also note that 67 apps attained their top rankings in their debut hour (i.e., HRS2PEAK = 1). Many of these apps stayed on the list for a very short time, but there are 6 apps that stayed for 100 - 1000 hours, 31 stayed for more than 1000 hours.
Figure 11 shows that New (Free) and New (Paid) apps do not stay on the list for more than 500 hours ( days) indicating that these lists may be taking into account all those applications which were last updated in the last 20 days. We have confirmed this hypothesis also by verifying that indeed the “last updated” field of these apps is within the last 20 days. From the same figure, for other lists, we also emphasize the presence of a long tail of apps that have been present for thousands of hours. We conclude that: (1) a majority of apps follows a “birth-growth-decline-death” process, as they enter/exit from the bottom part of a list, (2) most of the apps with modest DEBUT and EXIT values have a short, eventful life occupying many ranks quickly, and (3) the New (Free) and New (Paid) lists choose among apps that were updated within the last 20 days.
VIII-B Top-K List Variation
We now characterize the changes in the rankings of the top-k items from the five lists over time.
We use the Inverse Rank Measure to assess the changes over time in each of the rankings. This measure gives more weight to identical or near identical rankings among the top ranking items. This measure tries to capture the intuition that identical or near identical rankings among the top items indicate greater similarity between the rankings. Let us assume the following: is the list of top-k apps at time , is the rank of app in , is the set of items common to and , is the set of items in but not in , is the set of items in but not in . Then, the inverse rank measure is [7] defined as , where , and .
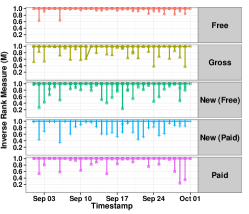
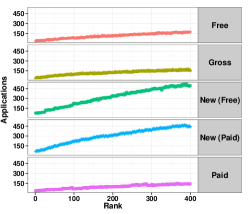
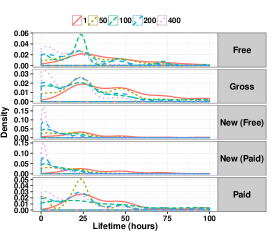
Figure 12 shows the variation of for consecutive days in the month of September. Note that values above 0.7 indicate high similarity [7]. We observe that the lists are similar from day to day for Free list but this is not the case for Paid and Gross. Intuitively, this indicates that the effort to displace a free app seems to be higher than that of a paid app or the frequency with which the ranking algorithm is run on Free list is less than that of the Paid list.
This intuition is difficult to verify without access to Google’s ranking function. To compare the dynamics between the top-24 positions and bottom 25, we computed , the amount of overlap between two subsequent lists for the two cases (see Table IV). In addition, we also computed the overlap between the first and the last lists obtained over the observation period. The overlap between the first and the last observed lists is zero in the case of the New(Free) and New(Paid) lists, due to the higher in-flow of apps in these lists.
| Pages | List-Type | #items | |||||
|---|---|---|---|---|---|---|---|
| Top 24 | Gross | 57 | 23.8953 | 18 | 0.9893 | 0.0617 | 12 |
| Free | 44 | 23.9539 | 21 | 0.9970 | 0.0238 | 16 | |
| Paid | 74 | 23.8840 | 11 | 0.9932 | 0.0537 | 4 | |
| New (Free) | 128 | 23.7974 | 15 | 0.9867 | 0.0742 | 0 | |
| New (Paid) | 125 | 23.8226 | 13 | 0.9889 | 0.0641 | 0 | |
| Last 25 | Gross | 205 | 25.3765 | 1 | 0.9692 | 0.1299 | 0 |
| Free | 186 | 25.6145 | 10 | 0.9785 | 0.1030 | 4 | |
| Paid | 150 | 24.9245 | 12 | 0.9780 | 0.1029 | 4 | |
| New (Free) | 449 | 25.1159 | 5 | 0.9571 | 0.1502 | 0 | |
| New (Paid) | 485 | 24.9245 | 2 | 0.9780 | 0.1687 | 0 |
In all other cases (except Paid top-24 and last-25 cases), there is an overlap of at least 50%: apps continue to be popular for longer periods. In each list-type of last-25 cases, the low overlap values indicate that the list is highly dynamic and variable. Also, notice that for the top-24 is higher than that of the last-25 indicating that the top-24 is less dynamic in all cases expect New(Free) and New(Paid).
Figure 12 shows the number of apps that occupy a rank position in 5 different list-types over our observation period. Note that a lower rank is preferred. For example, the rank position in the New (Free) list is occupied by 441 applications. With the increase in rank, the rate of applications being swapped is increasing for each category indicating an increased churn – it is easier for apps to occupy as well as get displaced on high ranks. For Paid, Gross, and Free, the number of apps varies from 34 to 142, 30 to 173, and 43 to 163, respectively, from the to the rank.
However, in the case of New (Free) and New(Paid) lists, the number of apps being swapped for a position is almost linearly increasing with the increase in rank. This is because all the applications in these two categories are new and the competition is higher compared to other list-types.
Figure 12 shows the distribution of the lifetime of applications that occupy a specific rank position. To evaluate the variation in the distributions we choose the , , , , and rank positions. For each category, the average lifetime is longer for higher ranking apps then for lower ranking apps. We can clearly observe this phenomenon in the case of New (Free) and New (Paid). In both the cases, the lifetime of the apps at the lowest rank (i.e., ) is the lowest, i.e., 6 hours and it starts increasing with the increase in the ranks. We can attribute this effect to the frequently changing list of new apps and the relatively easier competitions to be on the top-400 lists. However, in case of Free apps, the average lifetime of apps on the rank is hours and decreases to hours for the rank. For Paid and Gross categories, the lifetime changes from to hours and to hours, respectively, for the rank . We attribute these effects to the stability of the apps in these lists.
IX Research Implications
We now discuss the implications of longitudinal monitoring on security and systems research in Android app markets.
IX-A Fraud and Malware Detection
App markets play an essential role in the profitability of apps. Apps ranked higher in the app market become more popular, thus make more money, either through direct payments for paid apps, or through ads for free apps. This pressure to succeed leads some app developers to tinker with app market statistics known to influence the app ranking, e.g., reviews, average rating, installs [5]. Further, malicious developers also attempt to use app markets as tools to widely distribute their malware apps. We conjecture that a longitudinal analysis of apps can reveal both fraudulent and malicious apps. In the following we provide supporting evidence.
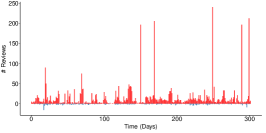
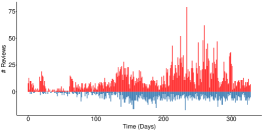
Search rank fraud. We have contacted Freelancer workers specializing in Google Play fraud, and have obtained the ids of 2,600 Google Play accounts that were used to write fraudulent reviews for 201 unique apps. We have analyzed these apps and found that fraudulent app search optimization attempts often produce suspicious review patterns. A longitudinal analysis of an app’s reviews, which we call timeline, can reveal such patterns. For instance, Figure 13 shows the review timeline of “Daily Yoga- Yoga Fitness Plans”, one of the 201 apps targeted by the 15 fraudster-controlled accounts. We observe several suspicious positive reviews spikes, some at over 200 reviews per day, in contrast with long intervals of under 50 daily positive reviews.
We have observed that Google Play apps can also be the target of negative review campaigns, receiving negative reviews from multiple fraudster-controlled accounts. Figure 13 shows the timeline of such an app, “Real Caller”, where we observe days with up to 25 negative reviews, but few positive reviews. While negative reviews are often associated with poor quality apps, these particular spikes are generated from the fraudster-controlled accounts mentioned above. We conjecture that negative review campaigns are sponsored by competitors. Further, we identified apps that are the target of both positive and negative reviews. Figure 13 shows the timeline of such an app, “Crownit - Cashback & Prizes”. While the app has received more positive reviews with higher spikes, its negative reviews and spikes thereof are also significant.
App markets can monitor timelines and notify developers and their users when such suspicious spikes occur.
In addition, our analysis has shown that several developers upload many unpopular apps (see ), while others tend to push frequent updates (VI). We describe here vulnerabilities related to such behaviors.
Scam Apps. We have identified several “productive” developers, that upload many similar apps. Among them, we have observed several thousands of premium applications (priced around $1.99) that are slight variations of each other and have almost no observable functionality. Such apps rely on their names and description to scam users into paying for them, then fail to deliver. Each such app receives 500-1000 downloads, bringing its developer a profit of $1000-2000.
Malware. While updates enable developers to fix bugs and push new functionality in a seamless manner, attack vectors can also leverage them. Such attack vectors can be exploited both by malicious developers and by attackers that infiltrate developer accounts. We posit that a motivated attacker can develop and upload a benign app, and once it gains popularity, push malware as an update. For instance, Table II shows that as expected, software version and total permissions are highly correlated. However, we found that in 5% of cases where permissions change, the software version does not change.
On the iOS platform, Wang et al. [36] proposed to make the app remotely exploitable, then introduce malicious control flows by rearranging already signed code. We propose an Android variant where the attacker ramps up the permissions required by the app, exploiting the observation that a user is more likely to accept them, then to uninstall the app.
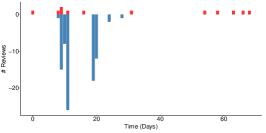
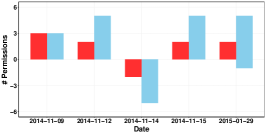
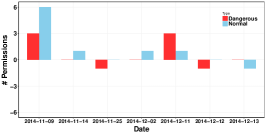
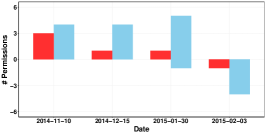
To provide an intuition behind our conjecture, we introduce the concept of app permission timeline, the evolution in time of an app’s requests for new permissions, or decisions to remove permissions. We have used VirusTotal [6] to test the apks of 7,756 randomly selected apps from the dataset.14-15. We have selected apps for which VirusTotal raised at least 3 flags and that have at least 10 reviews. Figure 14 shows the permission timeline of 3 of these apps, for both dangerous (red bars) and regular permissions (blue bars).
For instance, the “Hidden Object Blackstone” app (Figure 14) has a quick succession of permission requests and releases at only a few days apart. While the app releases 2 dangerous permissions on November 14, 2014, it requests them again 1 day later, and requests 2 more a month and a half later. Similarly, the “Top Race Manager” app (Figure 14) has very frequent permission changes, daily for the last 3. The “Cash Yourself” app (Figure 14) requests 3 dangerous permissions on November 10 2014, followed by 1 dangerous permission in both December and January, then releases 1 dangerous permission 4 days later.
Permission changes imply significant app changes. Frequent and significant permission changes, especially the dangerous ones may signal malware, or unstable apps. Market owners can decide to carefully scan the updates of such apps for malware, and notify developers that something went wrong with their updates, indicating potential account infiltration.
IX-B App Market Ecosystem
Analytics-driven Application Development. We envision a development model where insights derived from raw market-level data is integrated into the application development. Such a model is already adopted by websites such as Priceline [4] through their “Name Your Own Price” scheme where the interface provides users with hints on setting an optimal price towards a successful bid. We propose the extension of development tools like Google’s Android Studio [2] with market-level analytics, including:
-
•
Median price: In VI-A, we showed that developers may be settling down for lower profits. The development tools could provide developers them with hints on the optimal price for their app based on, e.g., the number of features, the price of active apps in the same category etc.
-
•
Application risk: Provide predictions on the impact of permissions and updates on reviews and download count.
-
•
App insights: Present actionable insights extracted from user reviews (e.g., using solutions like NetSieve [31]), including most requested feature, list of buggy features, features that crash the app.
Enriching User Experience. We believe data-driven insights will be indispensable to enhance the end user experience:
-
•
Analytics based app choice: Visualize app price, update overhead, required permissions, reviewer sentiment to enhance the user experience when choosing among apps with similar claimed functionality. For instance, develop scores for individual features, and even an overall “sorting” score based on user preferences. Scam apps (see IX-A) should appear at the bottom of the score based sorted app list.
-
•
Analytics based app quarantine: We envision a quarantine based approach to defend against “update” attacks. An update installation is postponed until analytics of variation in app features indicates the update is stable and benign. To avoid a situation where all users defer installation, we propose a probabilistic quarantine. Each user can update the app after a personalized random interval after its release.
X Limitations
This paper seeks to shed light on the dynamics of the Google app market and also provide evidence that a longitudinal monitoring of apps is beneficial for users, app developers and the market owners. However, our datasets were collected in 2012 and 2014-2015, and may not reflect the current trends of Google Play.
In addition, while we believe that the Google Play market, the applications it hosts and developers we examined represent a large body of other third-party markets and their environments, we do not intend to generalize our results to all the smartphone markets. The characteristics and findings obtained in this study are associated with the Google Play market and its developers. Therefore, the results should be taken with the market and our data collection methodology in mind.
The goal of our discussion of permission and review timelines was to provide early evidence that a longitudinal monitoring and analysis of apps in app markets can be used to identify suspicious apps. We leave for future work a detailed study of permission changes to confirm their statistical significance in detecting search rank fraud and malware.
XI Conclusion
This article studies temporal patterns in Google Play, an influential app market. We use data we collected from more than 160,000 apps daily over a six month period, to examine market trends, application characteristics and developer behavior in real-world market settings. Our work provides insights into the impact of developer levers (e.g., price, permissions requested, update frequency) on app popularity. We proposed future directions for integrating analytics insights into developer and user experiences. We introduced novel attack vectors on app markets and discussed future detection directions.
XII Acknowledgments
This research was supported in part by NSF grants CNS-1527153, CNS-1526494 and CNS-1450619.
References
- [1] Angry Birds Star Wars tops App Store Chart in 2.5 hours. http://goo.gl/ioJWq.
- [2] Getting started with Android Studio. http://goo.gl/wgeUok.
- [3] Google Bouncer. http://goo.gl/QnC6G.
- [4] Priceline. http://priceline.com.
- [5] Google I/O 2013 - Getting Discovered on Google Play. www.youtube.com/watch?v=5Od2SuL2igA, 2013.
- [6] VirusTotal - Free Online Virus, Malware and URL Scanner. https://www.virustotal.com/, Last accessed on May 2015.
- [7] J. Bar-Ilan, M. Levene, and A. Lin. Some measures for comparing citation databases. Journal of Informetrics, 1(1):26–34, 2007.
- [8] Y. Benjamini. Opening the box of a boxplot. The American Statistician, 42(4):257–262, 1988.
- [9] E. Brynjolfsson and M. Smith. Frictionless commerce? a comparison of internet and conventional retailers. Management Science, 2000.
- [10] B. Carbunar and R. Potharaju. A longitudinal study of the google app market. In Proceedings of the IEEE/ACM ASONAM, 2015.
- [11] A. Clauset, C. Shalizi, and M. Newman. Power-law distributions in empirical data. Arxiv preprint arxiv:0706.1062, 2007.
- [12] R. Cleveland, W. Cleveland, J. McRae, and I. Terpenning. Stl: A seasonal-trend decomposition procedure based on loess. Journal of Official Statistics, 6(1):3–73, 1990.
- [13] J. Dean and S. Ghemawat. Mapreduce: simplified data processing on large clusters. Communications of the ACM, 51(1):107–113, 2008.
- [14] W. Enck, P. Gilbert, B.-G. Chun, L. P. Cox, J. Jung, P. McDaniel, and A. N. Sheth. Taintdroid: An information-flow tracking system for realtime privacy monitoring on smartphones. In Proceedings of OSDI, 2010.
- [15] W. Enck, D. Octeau, P. McDaniel, and S. Chaudhuri. A study of android application security. In Proceedings of the 20th USENIX Conference on Security, 2011.
- [16] A. P. Felt, E. Chin, S. Hanna, D. Song, and D. Wagner. Android permissions demystified. In Proceedings of the ACM CCS, 2011.
- [17] C. Ghezzi, M. Jazayeri, and D. Mandrioli. Fundamentals of software engineering. Prentice Hall PTR, 2002.
- [18] Google. Developer Registration. http://goo.gl/wIwpa, 2012.
- [19] M. C. Grace, W. Zhou, X. Jiang, and A.-R. Sadeghi. Unsafe exposure analysis of mobile in-app advertisements. In Proceedings of the ACM WiSec, 2012.
- [20] A. Greenberg. Malware Apps Spoof Android Market To Infect Phones. Forbes Security, 2014.
- [21] R. Jiang, P. Ji, and X. Xiao. Aging property of unimodal failure rate models. Reliability Engineering & System Safety, 79(1):113–116, 2003.
- [22] R. Johnson and D. Wichern. Applied multivariate statistical analysis. Prentice hall, 2002.
- [23] D. Levy, M. Bergen, S. Dutta, and R. Venable. The magnitude of menu costs: direct evidence from large us supermarket chains. The Quarterly Journal of Economics, 112(3):791–824, 1997.
- [24] H. M. Levy. Capability-Based Computer Systems. Butterworth-Heinemann, Newton, MA, USA, 1984.
- [25] C. Z. Liu, Y. A. Au, and H. S. Choi. An Empirical Study of the Freemium Strategy for Mobile Apps: Evidence from the Google Play Market. In Proceedings of ICICS, 2012.
- [26] Z. Miners. Report: Malware-infected Android apps spike in the Google Play store. PCWorld, 2014.
- [27] M. Mitzenmacher. A brief history of generative models for power law and lognormal distributions. Internet mathematics, 2004.
- [28] S. Mlot. Top Android App a Scam, Pulled From Google Play. PCMag, 2014.
- [29] A. Möller, F. Michahelles, S. Diewald, L. Roalter, and M. Kranz. Update behavior in app markets and security implications: A case study in google play. In Proceedings of the Intl. Workshop on Research in the Large, 2012.
- [30] T. Petsas, A. Papadogiannakis, M. Polychronakis, E. P. Markatos, and T. Karagiannis. Rise of the planet of the apps: A systematic study of the mobile app ecosystem. In Proceedings of the 2013 Conference on Internet Measurement Conference, IMC ’13, pages 277–290, New York, NY, USA, 2013. ACM.
- [31] R. Potharaju, N. Jain, and C. Nita-Rotaru. Juggling the jigsaw: Towards automated problem inference from network trouble tickets. In Proceedings of USENIX NSDI, 2013.
- [32] M. Rahman, M. Rahman, B. Carbunar, and D. H. Chau. FairPlay: Fraud and Malware Detection in Google Play. In Proceedings of the SIAM International Conference on Data Mining (SDM), 2016.
- [33] D. Roberts. How to spot fake apps on the Google Play store. Fortune, 2015.
- [34] E. Siegel. Fake Reviews in Google Play and Apple App Store. Appentive, 2014.
- [35] N. Viennot, E. Garcia, and J. Nieh. A measurement study of google play. In ACM SIGMETRICS Performance Evaluation Review, volume 42, pages 221–233. ACM, 2014.
- [36] T. Wang, K. Lu, L. Lu, S. Chung, and W. Lee. Jekyll on ios: When benign apps become evil. In Proceedings of USENIX Security, 2013.
- [37] M. J. Warrens. On association coefficients for 2x2 tables and properties that do not depend on the marginal distributions. volume 73, 2008.
- [38] E. Weber, S. Shafir, and A. Blais. Predicting risk sensitivity in humans and lower animals: risk as variance or coefficient of variation. Psychological Review; Psychological Review, 111(2):430, 2004.
- [39] Q. Xu, J. Erman, A. Gerber, Z. Mao, J. Pang, and S. Venkataraman. Identifying diverse usage behaviors of smartphone apps. In Proceedings of ACM IMC, 2011.
- [40] N. Zhong and F. Michahelles. Google play is not a long tail market: An empirical analysis of app adoption on the google play app market. In Proceedings of the ACM SAC, 2013.
- [41] Y. Zhou and X. Jiang. Dissecting android malware: Characterization and evolution. In Proceedings of the IEEE S&P, 2012.
- [42] Y. Zhou, Z. Wang, W. Zhou, and X. Jiang. Hey, you, get off of my market: Detecting malicious apps in official and alternative android markets. In Proceedings of NDSS, 2012.
| Rahul Potharaju is a researcher at Microsoft. He focuses on building interactive query engines for big data. He earned his CS Ph.D. degree from Purdue University and CS Master’s degree from Northwestern University. He is a recipient of the Motorola Engineering Excellence award in 2009, the Purdue Diamond Award in 2014, and the Microsoft Trustworthy Reliability Computing Award in 2013. |
| Mizanur Rahman is a Ph.D. candidate at FIU. He has previously held various positions in KAZ Software, iAppDragon and Prolog Inc. His research interests include fraud detection in social networks and user experience. |
| Bogdan Carbunar is an assistant professor in SCIS at FIU. He has held research positions within Motorola Labs. His interests include security and privacy for mobile and social networks. He holds a Ph.D. in CS from Purdue. |