2D nanoporous membrane for cation removal from water: effects of ionic valence, membrane hydrophobicity and pore size
Abstract
Using molecular dynamic simulations we show that single-layers of molybdenum disulfide (MoS2) and graphene can effectively reject ions and allow high water permeability. Solutions of water and three cations with different valence (Na+, Zn2+ and Fe3+) were investigated in the presence of the two types of membranes and the results indicate a high dependence of the ion rejection on the cation charge. The associative characteristic of ferric chloride leads to a high rate of ion rejection by both nanopores, while the monovalent sodium chloride induces lower rejection rates. Particularly, MoS2 shows 100% of Fe3+ rejection for all pore sizes and applied pressures. On the other hand, the water permeation did not varies with the cation valence, having dependence only with the nanopore geometric and chemical characteristic. This study helps to understand the fluid transport through nanoporous membrane, essential for the development of new technologies for pollutants removal from water.
I Introduction
Centuries of misuse of natural resources has stressed available freshwater supplies throughout the world. With the rapid development of industries, chemical waste has been thrown deliberately in water to the point of making it difficult to clean. Particularly, direct or indirect discharge of heavy metals into the environment has increased recently, especially in developing countries ko-jhm2017 . Unlike organic contaminants, heavy metals are not biodegradable and tend to accumulate in living organisms. Many heavy metal ions are known also to be toxic or carcinogenic gumpu-sab2015 . Toxic heavy metals of particular concern in treatment of industrial waste-water include zinc, copper, iron, mercury, cadmium, lead and chromium.
As a result, filtration process that can acquire freshwater from contaminated, brackish water or seawater is an effective method to also increase the potable water supply. Modern desalination is mainly based on reverse osmosis (RO) performed through membranes, due to their low energy consumption and easy operation. Current RO plants have already operated near the thermodynamic limit, with the applied pressure being only 10 to 20% higher than the osmotic pressure of the concentrate li-des2017 . Meanwhile, advances in nanotechnology have inspired the design of novel membranes based on two-dimensional (2D) nanomaterials. Nanopores with diameters ranging from a few Angstroms to several nanometers can be drilled in membranes to fabricate molecular sieves wang-nn2017 . As the diameter of the pore approaches the size of the hydrated ions, various types of ions can be rejected by nanoporous membranes leading to efficient water desalination. Graphene, a single-atom-thick carbon membrane was demonstrated to have several orders of magnitude higher flux rates when compared with conventional zeolite membranes celebi-science2014 . In this way, graphene and graphene oxided are one of the most prominent materials for high-efficient membranes Xu15 ; Kemp13 ; huang-jpcl2015 . More recently, others 2D materials have also been investigated for water filtration. A nanoporous single-layer of molybdenum disulfide (MoS2) has shown great desalination capacity kou-pccp2016 ; weifeng-acsnano2016 ; aluru-nc2015 . The possibility to craft the pore edge with Mo, S or both provides flexibility to design the nanopore with desired functionality. In the same way, boron nitride nanosheets also has been investigated for water purification from distinct pollutants Lei13 ; Azamat15 . Therefore, not only the nanopore size matters for cleaning of water purposes but also the hydrophobicity and geometry of the porous.
For instance, the performance of commercial RO membrane is usually on the order of 0.1 L/cmdayMPa (1.18 g/msatm) pendergast-ees2011 . With the aid of zeolite nanosheets, permeability high as 1.3 L/cmdayMPa can be obtained jamali-jpcc2017 . Recent studies has show that MoS2 nanopore filters have potential to achieve a water permeability of roughly 100 g/msatm weifeng-acsnano2016 – 2 orders of magnitude higher than the commercial RO. This is comparable with that measured experimentally for the graphene filter (70 g/msatm) under similar conditions surwade-nn2015 . These results have shown that the water permeability scales linearly with the pore density. Therefore, the water filtering performance of 2D nanopores can be even higher.
Controlling the size and shape of the pores created in these membranes, however, represents a huge experimental challenge. Inspired by a number of molecular dynamics studies predicting ultrahigh water permeability across graphene and others 2D nanoporous membranes tanugi-nl2012 ; aluru-nc2015 , technologies have been developed to either create and control the nanopore size and distribution. Methods including electron beam garaj-nature2010 , ion irradiation yoon-acsnano2016 and chemical etching ohern-nl2015 have been reported to introduce pores in graphene. J. Feng et al. feng-nl2015 have also developed a scalable method to controllably make nanopores in single-layer MoS2 with subnanometer precision using electrochemical reaction (ECR). Recently, K. Liu and colleagues liu-nl2017 investigated the geometrical effect of the nanopore shape on ionic blockage induced by DNA translocation through h-BN and MoS2 nanopores. They observed a geometry-dependent ion scattering effect, and further proposed a modified ionic blockage model which is highly related to the ionic profile caused by geometrical variations. Additionally, recent experimental efforts have been devoted to amplify the filtering efficiency of the nanoporous membranes. Z. Wang and colleagues wang-nl2017 mechanistically related the performance of MoS2 membranes to the size of their nanochannels in different hydration states. They attributed the high water flux (30-250 L/mhbar) of MoS2 membranes to the low hydraulic resistance of the smooth, rigid MoS2 nanochannels. The membrane compaction with high pressure have also been found to create a neatly stacked nanostructure with minimum voids, leading to stable water flux and enhanced separation performance. By tuning the pore creation process, D. Jang et al. jang-acsnano2017 have demonstrated nanofiltration membranes that reject small molecules but offer high permeance to water or monovalent ions. Also, studies have shown how defects, oxidation and functionalization can affect the ionic blockage Achtyl15 ; Levita16 ; Jijo17 All of these studies point to a near future where 2D membranes will have a major impact on desalination processes.
In this work, we address the issue of the selectivity of the porous. In order to do that, we compare the water filtration capacity of MoS2 and graphene through molecular dynamics simulations. While graphene is a purely hydrophobic material, MoS2 sheets have both hydrophobic (S) and hydrophilic (Mo) sites. Recent studies have shown that the water dynamics and structure inside hydrophobic or hydrophilic pores can be quite distinct regarding the pore size Mosko14 ; kohler-pccp2017 ; bordin-PhysA17 and even near hydrophobic or hydrophilic protein sites mateus_protein . Three cations are considered: the standard monovalent sodium (Na+), the divalent zinc (Zn2+) and trivalent iron (Fe3+). The study of sodium removal is relevant due to it applications for water desalination Corry08 ; Das14 ; Mah15 . Zinc is a trace element that is essential for human health. It is important for the physiological functions of living tissue and regulates many biochemical processes. However, excess of zinc can cause eminent health problems fu-jem2011 . The cation Zn2+ is ranked 75th in the Comprehensive Environmental Response, Compensation and Liability Act (CERCLA) 2017 priority list of hazardous substances. In its trivalent form, ferric chloride Fe3+Cl is a natural flocculant, with high power of aggregation. It is also on the CERCLA list with recommended limit concentration of 0.3 mg/l. In this way, we explore the water permeation and cations rejection by nanopore with distinct radii. Our results shows that the hydrophilic/hydrophobic MoS2 nanopore have a higher salt rejection in all scenarios, while the purely hydrophobic graphene have a higher water permeation. Specially, MoS2 membranes shows the impressive capacity of block all the trivalent iron cations regardless the nanopore size.
Our paper is organized as follow. In the Section II we introduce our model and the details about the simulation method. On Section III we show and discuss our results for the water permeation in the distinct membranes, while in the Section IV we show the ion rejection properties for each case. Finally, a summary of our results and the conclusions are shown in Section V.
II Computational Details and Methods
Molecular dynamics (MD) simulations were performed using the LAMMPS package plimpton1995 . A typical simulation box consists of a graphene sheet acting as a rigid piston in order to apply an external force (pressure) over the ionic solution. The pressure gradient forces the solution against the 2D nanopore: a single-layer of molybdenum disulfide or graphene. Figure 1 shows the schematic representation of the simulation framework.
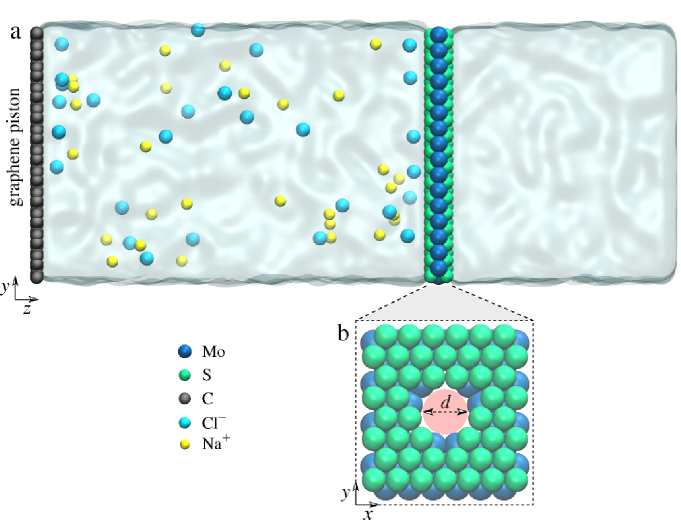
A nanopore was drilled in both MoS2 and graphene sheets by removing the desired atoms, as shown in Figure 1. The accessible pore diameters considered in this work range from 0.26 - 0.95 nm for the MoS2 (which means a pore area ranging from 5.5 - 71 Å2) and 0.17 - 0.92 nm for the graphene (with area ranging from 2.5 - 67 Å2). M. Heiranian et al. aluru-nc2015 have studied different MoS2 nanopore’s composition for water filtration: with only Mo, only S and a mix of the two atoms at the pore’s edge. They found similar ion rejection rates for both cases. Here, in order to account for circular nanopores, mixed pore edges have been chosen. The system contains 22000 atoms distributed in a box with dimensions nm in x, y and z, respectively. Although the usual salinity of seawater is M, we choose a molarity of M for all the cations (Na+, Zn2+ and Fe3+) due the computational cost associated with low-molarity solutions.
The TIP4P/2005 abascal-jcp2005 water model was used and the SHAKE algorithm ryckaert1977 was employed to maintain the rigidity of the water molecules. The non-bonded interactions are described by the Lennard-Jones (LJ) potential with a cutoff distance of 0.1 nm and the parameters tabulated in Table 1. The Lorentz-Berthelot mixing rule were used to obtain the LJ parameters for different atomic species. The long-range electrostatic interactions were calculated by the Particle Particle Particle Mesh method hockney1981 . Periodic boundary conditions were applied in all the three directions.
| Interaction | (nm) | (kcal/mol) | Charge |
|---|---|---|---|
| CC farimani-jpcb2011 | 3.39 | 0.0692 | 0.00 |
| MoMo liang-prb2009 | 4.20 | 0.0135 | 0.60 |
| SS liang-prb2009 | 3.13 | 0.4612 | -0.30 |
| OO abascal-jcp2005 | 3.1589 | 0.1852 | -1.1128 |
| HH | 0.00 | 0.00 | 0.5564 |
| NaNa raul-jpcb2016 | 2.52 | 0.0347 | 1.00 |
| ClCl raul-jpcb2016 | 3.85 | 0.3824 | -1.00 |
| ZnZn hinkle-jced2016 | 0.0125 | 1.960 | 2.00 |
| FeFe hinkle-jced2016 | 0.18 | 0.745 | 3.00 |
For each simulation, the system was first equilibrated for constant number of particles, pressure and temperature (NPT) ensemble for 1 ns at P = 1 atm and T = 300 K. Graphene and MoS2 atoms were held fixed in the space during equilibration and the NPT simulations allow water to reach its equilibrium density (1 g/cm3). After the pressure equilibration, a 5 ns simulation in the constant number of particles, volume and temperature (NVT) ensemble to further equilibrate the system at the same T = 300 K. Finally, a 10 ns production run were carried out, also in the NVT ensemble. The Nosé-Hoover thermostat nose1984 ; hoover1985 was used at each 0.1 ps in both NPT and NVT simulations, and the Nosé-Hoover barostat was used to keep the pressure constant in the NPT simulations. Different external pressures were applied on the rigid piston to characterize the water filtration through the 2D (graphene and MoS2) nanopores. For simplicity, the pores were held fixed in space to study solely the water transport and ion rejection properties of these materials. The external pressures range from 10 to 100 MPa. These are higher than the osmotic pressure used in the experiments. The reason for applying such high pressures at MD simulations with running time in nanosecond scale is because the low pressures would yield a very low water flux that would not go above the statistical error. We carried out three independent simulations for each system collecting the trajectories of atoms every picoseconds.
III Water flux
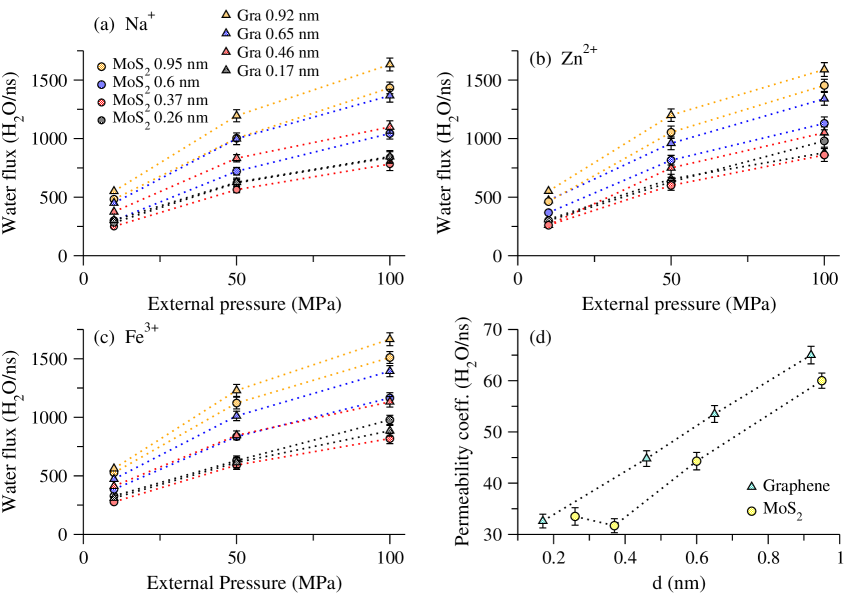
First, let us compare the flux performance of the graphene and the MoS2 membranes. In the Figure 2, we show the water flux through 2D nanopores in number of molecules per nanosecond (MoS2 and graphene) as a function of the applied pressure gradient for different pore diameters. The water is filtered from a reservoir containing an ionic solution of either monovalent sodium (Na+), divalent zinc (Zn2+) or trivalent iron cations (Fe3+). In all cases, chlorine (Cl-) was used as the standard anion. Four pore sizes for each material were investigated.
Our results indicates that for the smaller pore diameter, the black points in the Figure 2, both materials have the same water permeation. However, for the other values of pore diameter the graphene membrane shows a higher water flux, for all applied pressure gradient. While the flux at the purely hydrophobic graphene pore for a fixed pressure monotonically increases with the pore diameter, this is not the case for the MoS2 pore for which the flows shows a minimum around pore diameter of nm probably due to the non uniform distribution of the hydrophobic and hydrophilic sites of the pore. The Figures 2(a), (b) and (c) show that this behavior of the water flux is not affected by the cation valence, only by the applied pressure, by geometric effects and by the pore composition. For instance, the 0.46 nm graphene pore shows enhanced water flux compatible with the 0.6 nm MoS2 pore for all cations. Therefore, is clear that pore composition affects the water permeation properties more than the water-ion interaction.
This result agrees with the findings by Aluru and his group aluru-nc2015 , were they showed that even a small change in pore composition can lead to enhanced water flux through a MoS2 nanocavity. This is also consistent with our recent findings that the dynamics of water inside nanopores with diameter 1.0 nm is strongly affected by the presence of hydrophilic or hydrophobic sites kohler-pccp2017 . This investigation, over distinct cation valences and membranes, highlights the importance of the nanopore physical-chemistry properties for water filtration processes.
To quantify the water permeability through the pores, we compute the permeability coefficient, , across the pore. For dilute solutions
| (1) |
where is the flux of water (H2O/ns), is the molar volume of water (19 ml/mol), is the concentration gradient of the solute (1.0 M), is the Avogadro number, is the Boltzmann constant, is the temperature (300 K) and P is the applied hydrodynamic pressure (MPa).
The case of P = 50 MPa is shown in Figure 2(d). The permeability coefficient of the MoS2 range from approximately 33 to 55 H2O/ns for the 0.26 and 0.95 nm diameters, respectively. The graphene nanopore presents a permeability coefficient of 34 - 63 H2O/ns as the pore diameter is varied from 0.17 to 0.92 nm, respectively. For smaller pores the difference between MoS2 and graphene is inside the error bars, whereas for the larger pores both materials exhibit high permeability rates, with a slight advantage in the case of graphene.
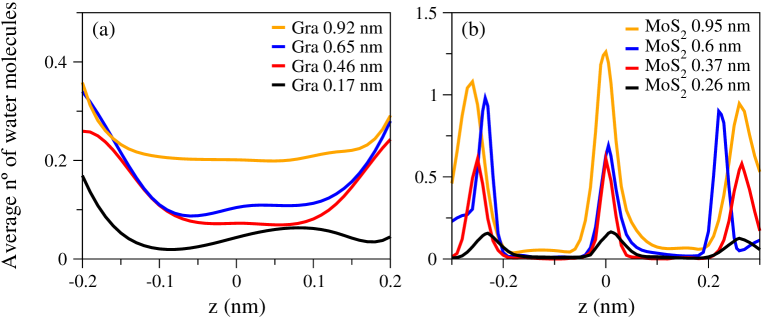
The water structure and dynamics inside nanopores are strongly related kohler-pccp2017 ; Bordin13a . Therefore, distinct structural regimes can lead to different diffusive behaviors. In the Figure 3 we present the distribution of water molecules in the z-direction inside the MoS2 (solid line) and graphene (dotted line) nanopores. As for the water flux, the water axial distribution is not affects by the cation valence. Therefore, for simplicity and since there are more studies about monovalent salts, we show only the Na+ case. The nanopore length in the z-direction, considering the van der Walls diameter for each sheet, is 0.63 (-0.315 to 0.315) nm for the MoS2 and 0.34 (-0.17 to 0.17) nm for the graphene. The structure inside both pores are considerably different. For the graphene nanopore, shown in Figure 3(a), there is no favorable positions for the water molecules to remain throughout the simulation. This can be related to the hydrophobic characteristic of the graphene sheet and the high slippage observed for water inside carbon nanopores Falk10 ; Tocci14 . Since all the pore is hydrophobic, there is no preferable position for the water molecules, and the permeability is higher. On the other hand, along the MoS2 cavity we can observe a high structuration in three sharp peaks, as shown in Figure 3(b). This structuration comes from the existence of hydrophilic (Mo) and hydrophobic sites (S atoms). This layered organization within the MoS2 nanopore can be linked to the reduced flux compared with graphene, since it implies an additional term in the energy required for the water molecule to pass through the pore.
The higher water flux through graphene nanopores compared with MoS2 imply that for a desired water flux, a smaller applied pressure is needed for graphene. Nevertheless, it is important to note that both fluxes are higher, specially when compared with currently desalination technologies aluru-nc2015 ; azamat-cms2017 . Therefore, both materials are capable of providing a high water permeability. The question is whether these materials are also able to effectively clean the water by removing the ions.
IV Ion rejection efficiency
The other important aspect for the cleaning of water is the membrane ability to separate water and ions. In this way, we investigate how the cation valence and the pore size affects the percentage rejected ions. In the Figure 4 we show the percentage of total ions rejected by the 2D nanopores as a function of the applied pressure for the three cations. The pores diameters are the same from the discussed in the previous section.
The ion rejection by the smallest pores, 0.17 and 0.26 nm for graphene and MoS2, respectively, was 100% for all applied pressures and cation solutions. This is expected since the pore size is much smaller than the hydration radii of the cations. Therefore, is more energetically favorable for the cation to remain in the bulk solution instead of strip off the water and enter the pore Bordin12a . As the pore diameter increases this energetic penalty becomes smaller. As well, the valence plays a crucial role here, with the monovalent ions having a smaller penalty than divalent and trivalent cations. In this way, for the nanopores with diameter 0.37 nm and 0.46 nm for graphene and MoS2, respectively, Na+ and Cl- ions flow through the pore reducing the rejection efficiency for both materials, as we can see in the Figure 4(a). However, it is important to note that the ion rejection performance of molybdenum disulfide membranes is superior from the observed for graphene membranes for all ranges of pressure, sizes and cation valences. For instance, for the divalent case Zn2+, shown in the Figure 4(b) and the smaller P the rejection is 100% for all pores sizes in the MoS2 membrane, while for the graphene membrane we observe cation permeation for the bigger pores.
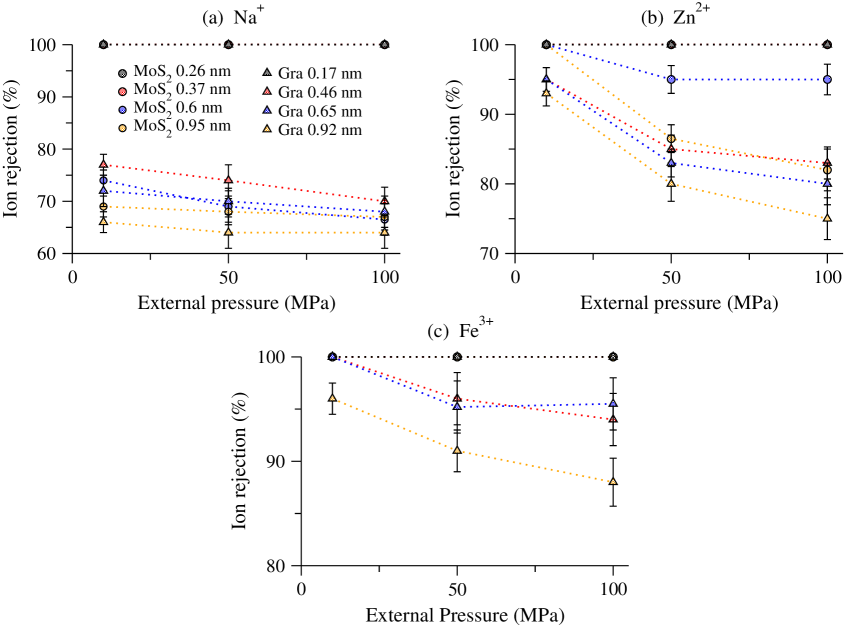
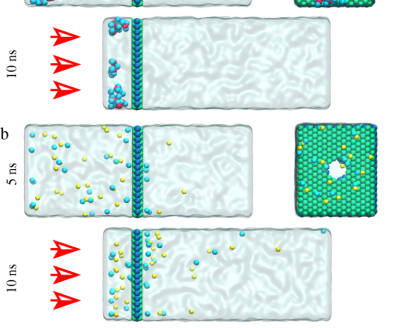
The MoS2 membrane shows a very good performance for the rejection of the trivalent cation Fe3+. As the Figure 4(c) shows, for all nanopore size and applied pressure the rejection is 100%. Such efficiency was not observed in the graphene membranes, were only the case with small pore diameter as 100% of iron rejection. Here, we should address that not only the hydration shell plays an important role in the cations rejection. While sodium chloride is uniformly dispersed in water and we do not observe clusters at the simulated concentration, the iron cations tend to form large clusters of ferric chlorides in solution, as shown in Figure 5. Moreover, we observe this structures throughout the whole simulation and even at high pressure regime the clusters remains too large to overcome the pore. In fact, ferric chlorides are effective as primary coagulants due to their associative character in solution. At controlled concentrations, it is excellent for both drinking and wastewater treatment applications, including phosphorus removal kim-ee2015 , sludge conditioning and struvite control amuda-jhm2007 ; sun-wr2015 . It also prevent odor and corrosion by controlling hydrogen sulfide formation. Additionally, our results indicates that the associative properties of ferric chlorides can be used to increase the efficiency of salt rejection by both MoS2 and graphene nanopores, which may contribute in water cleaning devices.
V Summary and conclusions
We have calculated water fluxes through various MoS2 and graphene nanopores and the respective percentage of total ions rejected by both materials as a function of the applied pressure gradient. Our results indicate that 2D nanoporous membranes are promising for water purification and salt rejection. The selectivity of the membranes was found to depend on factors such as the pore diameter, the cationic valence and the applied pressure. Nevertheless, our results shows that the ion valency do not affect the water permeation – this is only affected by the pore size and chemical composition.
Particularly, our findings indicate that graphene is a better water conductor than MoS2, with a higher permeability coefficient. Although, both material have presented high water fluxes. On the other hand, MoS2 nanopores with water accessible pore diameters ranging from 0.26 to 0.95 nm strongly reject ions even at theoretically high pressures of 100 MPa. Additionally, the rejection is shown to depend strongly on the ion valence. It reaches 100% for trivalent ferric chloride (Fe3+Cl) for all MoS2 pore sizes and applied pressures. This is a direct result of the ability of heavy metals to form agglomerates, eventually exhibiting long ionic chains. At the same time, this did not affected the water flux. Then, the ferric chloride properties can be used to improve the effectiveness of 2D material based nanofilters. New studies are been performed in this direction.
Acknowledgements.
We thank the Brazilian agencies CNPq and INCT-FCx for the financial support, CENAPAD/SP and CESUP/UFRGS for the computer time.References
- (1) D. Ko, J. S. Lee, H. A. Patel, M. H. Jakobsen, Y. Hwange, C. T. Yavuzan, H. B. Hansen, and H. R. Andersen, J. Hazard. Mater. 332, 140 (2017).
- (2) M. B. Gumpu, S. Sethuraman, U. M. Krishnan, and J. B. B. Rayappan, Sens. Actuators B: Chem. 213, 515 (2015).
- (3) M. Li, Desalination 422, 124 (2017).
- (4) L. Wang, M. S. H. Boutilier, P. R. Kidambi, D. Jang, N. G. Hadjiconstantinou, and R. Karnik, Nat. Nanotech. 12, 509 (2017).
- (5) K. Celebi, J. Buchheim, R. M. Wyss, A. Droudian, P. Gasser, I. Shorubalko, J.-I. Kye, C. Lee, and H. G. Park, Science 344, 289 (2014).
- (6) Q. Xu, H. Xu, J. Chen, Y. Lv, C. Dong, and T. S. Sreeprasadc, Inorg. Chem. Front. 2, 417 (2015).
- (7) K. C. Kemp, H. Seema, M. Saleh, N. H. Le, K. Mahesh, V. Chandra, and K. S. Kim, Nanoscale 5, 3149 (2013).
- (8) L. Huang, M. Zhang, C. Li, and G. Shi, J. Phys. Chem. Lett. 6, 2806 (2015).
- (9) J. Kou, J. Yao, L. Wu, X. Zhou, H. Lu, F. Wu, and J. Fan, Phys. Chem. Chem. Phys. 18, 22210 (2016).
- (10) W. Li, Y. Yang, J. K. Weber, G. Zhang, and R. Zhou, ACS Nano 10, 1829 (2016).
- (11) M. Heiranian, A. B. Farimani, and N. R. Aluru, Nat. Commun. 6, 8616 (2015).
- (12) W. Lei, D. Portehault, D. Liu, S. Qin, and Y. Chen, Nature Comm. 4, 1777 (2013).
- (13) J. Azamat, B. S. Sattary, A. Khataee, and S. W. Joo, J. Mol. Graph. Model. 61, 13 (2015).
- (14) M. M. Pendergast and E. M. Hoek, Energy Environ. Sci. 4, 1946 (2011).
- (15) S. H. Jamali, T. J. H. Vlugt, and L.-C. Lin, J. Phys. Chem. C 121, 11273 (2017).
- (16) S. P. Surwade, S. N. Smirnov, I. V. Vlassiouk, R. R. Unocic, G. M. Veith, S. Dai, and S. M. Mahurin, Nat. Nanotech. 10, 459 (2015).
- (17) D. Cohen-Tanugi and J. C. Grossman, Nano Lett. 12, 3602 (2012).
- (18) S. Garaj, W. Hubbard, A. Reina, J. Kong, D. Branton, and J. A. Golovchenko, Nature 467, 190 (2010).
- (19) K. Yoon, A. Rahnamoun, J. L. Swett, V. Iberi, D. A. Cullen, I. V. Vlassiouk, A. Belianinov, S. Jesse, X. Sang, O. S. Ovchinnikova, A. J. Rondinone, R. R. Unocic, and A. C. van Duin, ACS Nano 10, 8376 (2016).
- (20) S. C. OHern, D. Jang, S. Bose, J.-C. Idrobo, Y. Song, T. Laoui, J. Kong, and R. Karnik, Nano Lett. 15, 3254 (2015).
- (21) J. Feng, K. Liu, M. Graf, M. Lihter, R. D. Bulushev, D. Dumcenco, D. T. L. Alexander, D. Krasnozhon, T. Vuletic, A. Kis, and A. Radenovic, Nano Lett. 15, 3431 (2015).
- (22) K. Liu, M. Lihter, A. Sarathy, S. Caneva, H. Qiu, D. Deiana, V. Tileli, D. T. L. Alexander, S. Hofmann, D. Dumcenco, A. Kis, J.-P. Leburton, and A. Radenovic, Nano Lett. 17, 4223 (2017).
- (23) Z. Wang, Q. Tu, S. Zheng, J. J. Urban, S. Li, and B. Mi, Nano Lett. 17, 7289 (2017).
- (24) D. Jang, J.-C. Idrobo, T. Laoui, and R. Karnik, ACS Nano 11, 10042 (2017).
- (25) J. L. Achtyl, R. R. Unocic, L. Xu, Y. Cai, M. Raju, W. Zhang, R. L. Sacci, I. V. Vlassiouk, P. F. Fulvio, P. Ganesh, D. J. Wesolowski, S. Dai, A. C. T. van Duin, M. Neurock, and F. M. Geiger, Nature Communications 6, 6539 (2015).
- (26) G. Levita, P. Restuccia, and M. Righi, Carbon 107, 878 (2016).
- (27) J. Abrahamand, K. S. Vasu, C. D. Williams, K. Gopinadhan, Y. Su, C. T. Cherian, J. Dix, E. Prestat, S. J. Haigh, I. V. Grigorieva, P. Carbone, A. K. Geim, and R. R. Nair, Nat. Nanotech. 12, 546 (2017).
- (28) I. Moskowitz, M. A. Snyder, and J. Mittal, J. Chem. Phys. 141, 18C532 (2014).
- (29) M. H. Köhler, J. R. Bordin, L. B. da Silva, and M. C. Barbosa, Phys. Chem. Chem. Phys. 19, 12921 (2017).
- (30) J. R. Bordin and M. C. Barbosa, Phys. A 467, 137 (2017).
- (31) M. H. Köhler, R. C. Barbosa, L. B. da Silva, and M. C. Barbosa, Phys. A 468, 733 (2017).
- (32) B. Corry, J. Phys. Chem. B 112, 1427 (2008).
- (33) R. Das, M. E. Ali, S. B. A. Hamid, S. Ramakrishna, and Z. Z. Chowdhury, Desalination 336, 97 (2014).
- (34) K. A. Mahmoud, B. Mansoor, A. Mansour, and M. Khraisheh, Desalination 356, 208 (2015).
- (35) F. Fu and Q. Wang, J. Environ. Management 92, 407 (2011).
- (36) S. Plimpton, J. Comput. Phys. 117, 1 (1995).
- (37) J. Abascal and C. Vega, J. Chem. Phys. 123, 234505 (2005).
- (38) J. P. Ryckaert, G. Ciccotti, and H. J. C. Berendsen, J. Comput. Phys. 23, 327 (1977).
- (39) R. W. Hockney and J. W. Eastwood, Computer Simulation Using Particles, McGraw-Hill, New York, 1981.
- (40) A. Barati Farimani and N. R. Aluru, J. Phys. Chem. B 115, 12145 (2011).
- (41) T. Liang, S. R. Phillpot, and S. B. Sinnott, Phys. Rev. B 79, 245110 (2009).
- (42) R. Fuentes-Azcatl and M. C. Barbosa, J. Phys. Chem. B 120, 2460 (2016).
- (43) K. R. Hinkle, C. J. Jameson, and S. Murad, J. Chem. Eng. Data 61, 1578 (2016).
- (44) S. Nosé, Mol. Phys. 52, 255 (1984).
- (45) W. G. Hoover, Phys. Rev. A. 31, 1695 (1985).
- (46) J. R. Bordin, A. Diehl, and M. C. Barbosa, J. Phys. Chem. B 117, 7047 (2013).
- (47) K. Falk, F. Sedlmeier, L. Joly, R. R. Netz, and L. Bocquet, Nano Lett. 10, 4067 (2010).
- (48) G. Tocci, L. Joly, and A. Michaelides, Nano Lett. 14, 6872 (2014).
- (49) J. Azamat and A. Khataee, Comp. Mat. Sci. 137, 201 (2017).
- (50) J. R. Bordin, A. Diehl, M. C. Barbosa, and Y. Levin, Phys. Rev. E 85, 031914 (2012).
- (51) B. Kim, M. Gautier, P. Molle, P. Michel, and R. Gourdon, Ecol. Eng. 80, 53 (2015).
- (52) O. Amuda and I. Amoo, J. Hazard. Mater. 141, 778 (2007).
- (53) J. Sun, I. Pikaar, K. R. Sharma, J. Keller, and Z. Yuan, Water Research 71, 150 (2015).