Geostatistical methods for disease mapping and visualization using data from spatio-temporally referenced prevalence surveys
Abstract
In this paper we set out general principles and develop geostatistical methods for the analysis of data from spatio-temporally referenced prevalence surveys. Our objective is to provide a tutorial guide that can be used in order to identify parsimonious geostatistical models for prevalence mapping. A general variogram-based Monte Carlo procedure is proposed to check the validity of the modelling assumptions. We describe and contrast likelihood-based and Bayesian methods of inference, showing how to account for parameter uncertainty under each of the two paradigms. We also describe extensions of the standard model for disease prevalence that can be used when stationarity of the spatio-temporal covariance function is not supported by the data. We discuss how to define predictive targets and argue that exceedance probabilities provide one of the most effective ways to convey uncertainty in prevalence estimates. We describe statistical software for the visualization of spatio-temporal predictive summaries of prevalence through interactive animations. Finally, we illustrate an application to historical malaria prevalence data from 1334 surveys conducted in Senegal between 1905 and 2014.
Keywords: disease mapping; Gaussian processes; geostatistics; parameter uncertainty; parsimony; prevalence; spatio-temporal models.
1 Introduction
Model-based geostatistics (MBG) (Diggle et al., 1998) is a sub-branch of spatial statistics that provides methods for inference on a continuous surface using spatially discrete, noisy data. MBG is increasingly being used in disease mapping applications (e.g. Hay et al. (2009); Gething et al. (2012); Diggle & Giorgi (2016)), with a particular focus on low-resource settings where disease registries are geographically incomplete or non-existent.
We consider data obtained by sampling from a set of potential locations within an area of interest , repeatedly at each of a sequence of times . At each sampled location, individuals are then tested for the disease under investigation. The data-format can be formally expressed as
| (1) |
where is the location of the th of sampling units at time , is the number of tested individuals at and is the number of positively identified cases.
The methodology described in this paper can be equally applied to longitudinal or repeated cross-sectional designs. For this reason, we re-write (1) as
where and either or both of the and may include replicated values.
An essential feature of the class of problems that we are addressing in this paper is that the locations are a discrete set of sampled points within a spatially continuous region of interest. Another possible format for prevalence data, which we do not consider in the present study, is a small-area data-set. In this case, locations are reference locations associated with a partition of into sub-regions. Disease registries in relatively well developed countries often use this format, both for administrative convenience and, in associated publications such as health atlases, to preserve individual confidentiality; see, for example, (López-Abente et al., 2007) or (Hansell et al., 2014). In low-resource settings, this is also often the format of data from demographic surveillance systems, such as Demographic and Health Surveys (dhsprogram.com), which are nationally representative surveys conducted about every five years to collect information on population, health and nutrition indicators; see, for example, Mercer et al. (2015) for an analysis of data of this kind.
A geostatistical model for data of the kind specified by (1) is that, conditionally on a spatio-temporal process and unstructured random effects , the outcomes are mutually independent binomial distributions with number of trials and probability of being a case . Using the conventional choice of a logistic link function, although other choices are also available, we can then write
| (2) |
where is a vector of spatio-temporally referenced explanatory variables with associated regression coefficients . The spatio-temporal random effects can be interpreted as the cumulative effect of unmeasured spatio-temporal risk factors. These are modelled as a Gaussian process with stationary variance and correlation function
| (3) |
where is a vector of parameters that regulate the scale of the spatial and temporal correlation, the strength of space-time interaction and the smoothness of the process . Finally, the unstructured random effects are assumed to be independent zero-mean Gaussian variables with variance , to account for extra-binomial variation within a sampling location. In particular applications, this can represent non-spatial random variation, such as genetic or behavioural variation between co-located individuals, spatial variation on a scale smaller than the minimum observed distance between sampled locations, or a combination of the two.
The model (2) can be used to address two related, but different, research questions.
Estimation: what are the risk factors associated with disease prevalence? In this case the focus of scientific interest is on the regression coefficients .
Prediction: how to interpolate the spatio-temporal pattern of disease prevalence? The scientific focus is, in this case, on at both sampled and unsampled locations and times . In some cases, the scientific interest may be more narrowly focused on , in order to identify areas of relatively low and high spatio-temporal variation that is not explained by the available explanatory variables.
Modelling of the residual spatio-temporal correlation through is crucial in both cases: in the first case, in order to deliver valid inferences on the regression relationships by accurately quantifying the uncertainty in the estimate of (Thomson et al., 1999); in the second case, to borrow strength of information across observations by exploiting their spatial and temporal correlation.
The use of explanatory variables can also be beneficial in two ways: a simpler model for can be formulated by explaining part of the spatio-temporal variation in prevalence through ; more precise spatio-temporal predictions between data-locations also result from exploiting the association between disease prevalence and .
Here, we focus our attention on spatio-temporal prediction of disease prevalence. Our aim is to provide a general framework that can be used as a tutorial guide to address some of the statistical issues common to any spatio-temporal analysis of data from prevalence surveys, especially when sampling is carried out over a large geographical area or time period, or both. More specifically, we provide answers to each of the following research questions. How can we specify a parsimonious spatio-temporal model while taking account of the main features of the underlying process? How can we extend model (2) in order to account for non-stationary patterns of prevalence? What are the predictive targets that we can address using our model for disease prevalence? How can we effectively visualise the uncertainty in spatio-temporal prevalence estimates? These issues have only partly been addressed in current spatio-temporal applications of model-based geostatistics for disease prevalence mapping. Some of these are: Clements et al. (2006) on schistosomiasis in Tanzania; Gething et al. (2012) on the world-wide distribution of Plasmodium vivax; Hay et al. (2009) and Noor et al. (2014) on the world-wide and Africa-wide distributions of Plasmodium falciparium; Snow et al. (2015b) on historical mapping of malaria in the Kenyan Coast area; Bennett et al. (2013) on the mapping of malaria transmission intensity in Malawi; Kleinschmidt et al. (2001) on malaria incidence in KwaZulu Natal, South Africa; Kleinschmidt et al. (2007) on HIV in South Africa; Soares Magalhaes & Clements (2011) on anemia in preschool-aged children in West Africa; Raso et al. (2005) on schistosomiasis in Côte D’Ivoire; Pullan et al. (2011) on soil-transmitted infections in Kenya; Zouré et al. (2014) on river blindness in the 20 participating countries of the African Programme for Onchocerciasis control. In almost all of these cases, the adopted spatio-temporal model is only assessed with respect to its predictive performance, using ROC curves and prediction error summaries. In our view, a validation check on the adopted correlation structure in the analysis should precede geostatistical prediction, as misspecification of the spatio-temporal structure of the field can potentially lead to an inaccurate quantification of uncertainty in the prevalence estimates and, therefore, to invalid inferences. In this paper, we describe the different stages of a spatio-temporal geostatistical analysis and provide tools that directly address the issue of specifying a spatio-temporal covariance structure that is compatible with the data.
The paper is structured as follows. Section 2 is a review on geostatistical sampling design, where we show how this might affect our analysis of the data. In Section 3 we describe principles and provide statistical tools for each of the stages of a spatio-temporal geostatistical analysis. In Section 3.1, we define the objectives of an exploratory geostatistical analysis and show how to pursue these using the empirical variogram. In Section 3.2, we outline and contrast likelihood-based and Bayesian methods of inference. In Section 3.3, we propose a general Monte Carlo procedure based on the empirical variogram, in order to check the validity of the assumed spatio-temporal correlation function for . In Sections 3.4 and 3.5, we discuss how to define and visualize predictive targets. In Section 4 we illustrate an application to historical mapping of malaria using data from prevalence surveys conducted in Senegal between 1905 and 2014. Section 5 is a concluding discussion.
2 Geostatistical sampling design
Different design scenarios can give rise to data of the kind expressed by (1). A good choice of design depends both on the objectives of the study and on practical constraints.
In a longitudinal design, data are collected repeatedly over time from the same set of sampled locations. This is an appropriate strategy when temporal variation in the outcome of primary interest dominates spatial variation, and more obviously when the scientific goal is to understand change over time at a set of sentinel locations. A longitudinal design is also cost-effective when setting up a sampling location is expensive but subsequent data-collection is cheap.
In a repeated cross-sectional design, a different set of locations is chosen on each sampling occasion. This sacrifices direct information on changes in disease prevalence over time in favour of more complete spatial coverage. Repeated cross-sectional designs can also be adaptive, meaning that on any sampling occasion, the choice of sampling locations is informed by an analysis of the data collected on earlier occasions. Adaptive repeated cross-sectional designs are therefore particularly suitable for applications in which temporal variation either is dominated by spatial variation or can be well explained by available covariates; see Chipeta et al. (2016) and Kabaghe et al. (2017).
To explain how the sampling design might affect our geostatistical analysis of the data, let denote the set of sampling locations arising from the sampling design, the signal process and the outcome data.
A sampling design is deterministic if it consists of a set of pre-defined sampling locations, and stochastic if the locations are a probability-based selection from a set of candidate designs. In the latter case is a finite point process on the region of interest . Let denote “the distribution of.” Our model for the outcome data is then obtained by integrating out from the joint distribution , i.e.
| (4) |
From a modelling perspective, the most natural factorization of the integrand in the above equation is as
| (5) |
The design is non-preferential if , in which case (4) becomes
| (6) |
Hence, under non-preferential sampling schemes, inference about and/or can be conducted legitimately by simply conditioning on the observed set of locations, .
The simplest example of a probabilistic sampling design is completely random sampling. This can be interpreted, according to context, either as a random sample from a finite, pre-specified set of potential sampling locations or as an independent random sample from the continuous uniform distribution on . Other examples include spatially stratified random sampling designs, which consist of a collection of completely random designs, one in each of a number of subdivisions of , and systematic sampling designs, in which the sampled locations form a regular (typically rectangular) lattice to cover , strictly with the first lattice-point chosen at random, although in practice this is often ignored.
Here as in other areas of statistics, the choice of sampling design affects inferential precision. If, for example, the inferential target is the underlying spatially continuous prevalence surface, at a future time , a possible design goal for geostatistical prediction would be to minimise the spatial average of the mean squared error,
where is a predictor for obtained from (2). In contrast, a possible design goal for estimation of the relationship between a covariate and disease prevalence would be to minimise the variance of the estimated regression parameter, .
Efficient sampling designs for spatial prediction generally require sampled locations to be distributed more evenly over than would result from completely random or stratified random sampling; see, for example, Matérn (1986).
Stratified sampling often provides a more cost-effective design than simple random sampling from the general population. In cases where the strata correspond to sub-populations associated with different disease risk levels, a geostatistical model should account for the stratification through the use of an appropriate explanatory variable. To illustrate this, consider, for example, a population consisting of strata which correspond to a partition of the region of interest, , into non-overlapping regions for . We then take a random sample from each region so that each location has probability of being selected proportional to the population of . If it is known that each of the strata is associated with different levels in disease risk, this can be accounted for by including a factor variable in (2) with levels or, if is large, using random effects at stratum-level. In some cases the strata can also be grouped into sub-populations which are known to differ in their exposure to the disease. For example, let us assume that each stratum can be classified as being urban or rural and that these two types of areas are associated with different risk levels, i.e.
| (7) |
where is an indicator function that takes value 1 if and is urban, and 0 otherwise. Under this model, it follows that
hence (7) does not constitute an instance of preferential sampling. This shows that variables used in the design should be included in the model when these are associated with the outcome of interest so as to ensure that the sampling is non-preferential. For a wider discussion on this issue in the context of standard regression models, we refer to Skinner & Wakefield (2017) and Lumley & Scott (2017).
Another common design in practice is the opportunistic sampling design (Hedt & Pagano, 2011), in which data are collected at convenient places, for example from presentations at health clinics, a market or a school. The limitations of this are obvious: opportunistic samples may not be representative of the target population and so not deliver unbiased estimates of . Also, as unmeasured factors relating to the disease in question are likely to affect an indivudual’s decision to present, the assumption of non-preferential sampling is questionable. For example, areas with atypically high or low levels of may have been systematically oversampled; see Diggle et al. (2010) and Pati et al. (2011) for a discussion and formal solution to the problem of geostatistical inference under preferential sampling.
Giorgi et al. (2015) address the issue of combining data from multiple prevalence surveys, with a mix of random and opportunistic sampling designs. By developing a multivariate geostatistical model that enables estimation of the bias from opportunistic samples, they show that combining information from multiple studies can lead to more precise estimates of prevalence, provided that at least one of these is known to be unbiased.
In the remainder of this paper, we shall focus our attention on the case of prevalence data obtained from a non-preferential sampling design.
3 Methods
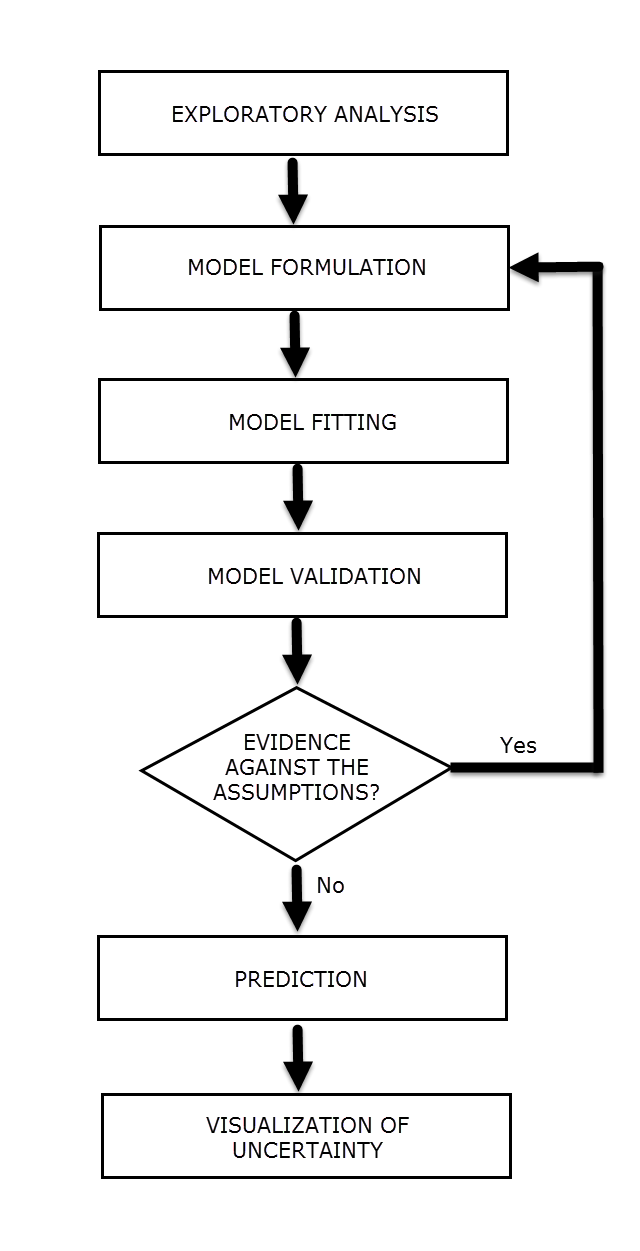
In this Section we provide a general framework for the analysis of data from spatio-temporally referenced prevalence surveys. Figure 1 shows the different stages of the analysis as a cycle that terminates when all the modelling assumptions are supported by the data. In our context, visualization of the results also plays an important role in order to display the spatio-temporal patterns of estimated prevalence and to communicate uncertainty effectively.
3.1 Exploratory analysis: the spatio-temporal variogram
The usual starting point for a spatio-temporal analysis of prevalence data is an analysis based on a binomial mixed model without spatial random effects, i.e. for all and . Let denote a point estimate, such as the predictive mean or mode, of the unstructured random effects from the non-spatial binomial mixed model. We then analyse to pursue the two following objectives:
-
1.
testing for presence of residual spatio-temporal correlation;
-
2.
formulating a model for (3) and providing an initial guess for .
We make a working assumption that is a stationary and isotropic process, hence
| (8) |
where , with denoting the Euclidean distance, and .
The variogram can then be used to formulate and validate models for the spatio-temporal correlation in (3). Let , where and are specified as in (2); the spatio-temporal variogram of this process is given by
| (9) |
We refer to this as the theoretical variogram, since it is directly derived from the theoretical model for the process .
We use to estimate the unexplained extra-binomial variation in prevalence, at observed locations and times . Let denote the pairs such that and ; the empirical variogram is then defined as
| (10) |
where is the number of pairs in the set.
Testing for the presence of residual spatio-temporal correlation can be carried out using the following Monte-Carlo procedure:
-
(Step 1)
permute the order of the data, including , while holding fixed;
-
(Step 2)
compute the empirical variogram for ;
-
(Step 3)
repeat() and () a large enough number of times, say ;
-
(Step 4)
use the resulting empirical variograms to generate tolerance intervals at each of the pre-defined distance bins.
If lies outside these intervals, then the data show evidence of residual spatio-temporal correlation. If this is the case, the next step is to specify a functional form for .
Gneiting (2002) proposed the following class of spatio-temporal correlation functions
| (11) |
where and are positive parameters that determine the rate at which the spatial and temporal correlations decay, respectively. When in (11), where and are purely spatial and purely temporal correlation functions, respectively. Any spatio-temporial correlation function that factorises in this way is called separable. In this sense, the parameter represents the extent of non-separability. Stein (2005) provides a detailed analysis of the properties of space-time covariance functions and highlights the limitations of using separable families. However, fitting of complex space-time covariance models requires more data than, in our experience, is typically available in prevalence mapping applications. In the application of Section 4, we show that only and in (11) can be estimated with an acceptable level of precision, whilst the data are poorly informative with respect to the other covariance parameters, in which case the parsimony principle favours a separable model. Note, incidentally, that separability is implied by, but does not imply, that can be factorised as , which would be a highly artificial construction.
A spatio-temporal correlation function is separable if
where and parametrise the purely spatial and temporal correlation functions, respectively; in the case of (11), this is separable when . Separable correlation functions are computationally convenient when joint predictions of prevalence are required at different time points over the same set of prediction locations. Checking the validity of the separability assumption can be carried out using the likelihood-ratio test for models such as (11), where separability can be recovered as a special case.
Once a parametric model has been specified, an initial guess for can be used to initialise the maximization of the likelihood function. One way to obtain an initial guess is to choose the value of that minimizes the sum of squared differences between the theoretical and empirical variogram ordinates. Section 5.3 of Diggle & Ribeiro (2007) describes the least squares algorithm and other, more refined methods to fit a parametric variogram model to an empirical variogram. However, in our view, variogram-based techniques should only be used for exploratory analysis and diagnostic checking. For parameter estimation and formal inference, likelihood-based and Bayesian methods are more efficient and more objective.
3.2 Parameter estimation and spatial prediction
We now outline likelihood-based and Bayesian methods of parameter estimation for the model in (2).
3.2.1 Likelihood-based inference
Let denote the set of unknown model parameters, including regression coefficients , the variance of and covariance parameters . We use as a shorthand notation for “the distribution of”. The likelihood function is then obtained from the marginal distribution of the outcome by integrating out the random effects to give
| (12) |
In general, the integral in (12) is intractable. However, numerical integration techniques or Monte Carlo methods can be used for approximate evaluation and maximization of the likelihood function, as required for classical inference (Geyer & Thompson, 1992; Geyer, 1994, 1996, 1999). See Christensen (2004) for a detailed description of the Monte Carlo maximum likelihood estimation method in a geostatistical context.
In our application of Section 4, we use the following approach to approximate (12). Let represent our best guess of . We then rewrite (12) as
| (13) | |||||
where the expectation in the above equation is taken with respect to . Using MCMC algorithms, we then generates samples from , say , and approximate (13) as
We maximize using a Broyden-Fletcher-Goldfarb-Shanno algorithm (Fletcher, 1987), which incorporates analytical expressions for the first and second derivatives of . Let denote the Monte Carlo maximum likelihood estimate of . We then set and repeat the outlined procedure until convergence.
To simulate from , we first reparametrise the model based on , where is the mode of and is the inverse of the negative Hessian of at the mode . At each iteration of the MCMC, we propose a new value for , given the current value , using a Langevin-Hastings algorithm with a Gaussian proposal distribution having mean
and covariance matrix given by , where is the identity matrix and is tuned so that the acceptance rate is 0.574 (Roberts & Rosenthal, 1998).
Other approaches that have been proposed to maximize (12) are based on the expectation-maximization algorithm (Zhang, 2002) and the Laplace approximation (Bonat & Ribeiro, 2016).
Let denote the vector of values of at a set of unobserved times and locations. The formal solution to the prediction problem is to evaluate the conditional distribution of given the data . Although the joint predictive distribution of the elements of is intractable, it is possible to simulate samples from this distribution.
If we assume, unrealistically, that is known, the predictive distribution of is given by
| (14) |
See Chapter 4 of Diggle & Ribeiro (2007) for explicit expressions.
If, more realistically, is unknown, plug-in prediction consists of replacing in (14) by an estimate , preferably the maximum likelihood estimate. A legitimate criticism of this is that the resulting predictive probabilities ignore the inherent uncertainty in . However, this can be taken into account within a likelihood-based inferential framework as follows. Let denote the maximum likelihood estimator of . We define the predictive distribution of as
| (15) |
where denotes the sampling distribution of the maximum likelihood estimator . Equation (15) acknowledges the uncertainty in by expressing the predictive distribution as the expectation of the plug-in predictive distribution (14) with respect to the sampling distribution of . This can then be approximated using a multivariate Gaussian distribution with mean given by the observed MLE, , and covariance matrix given by
In our experience, the quality of the Gaussian approximation is improved considerably by applying a log-transformation to each of the covariance parameters. If the Gaussian approximation remains questionable, a more computationally intensive alternative is a parametric bootstrap consisting of the following steps: simulate a number of binomial data-sets using the plug-in MLE for ; for each simulated data-set, carry out parameter estimation by maximum likelihood. The resulting set of bootstrap estimates for can then be used to approximate the distribution of . We give an example of these approaches in the case-study of Section 4.
3.2.2 Bayesian inference
In Bayesian inference, is treated as a random variable and must be assigned a prior distribution, . Parameter estimation is then carried out through the posterior distribution of , which is obtained using Bayes’ theorem as
| (16) |
All other things being equal, as the sample size increases becomes more concentrated around the true value of , the impact of the prior is reduced and the difference between likelihood-based and Bayesian parameter estimation becomes less important. MCMC algorithms can be used for approximate computation of the posterior in (16). For the Bayesian analysis in the application of Section 4, we develop an MCMC algorithm which separately updates , , and . Specifically, we use a Metropolis-Hastings algorithm to update and , and a Gibbs sampler to update . To update the random effect , we use a Hamiltonian Monte Carlo procedure (Neal, 2011). More computational details on this approach can be found in Section 2.2 of Giorgi & Diggle (2017).
Non-stochastic analytical approximations of (16) can also be obtained using, for example by the use of integrated nested Laplace approximations (Rue et al., 2009). However, their accuracy should be considered carefully in each spefici context. Joe (2008) shows that for binomial mixed models, the smaller the denominator the less accurate is the Laplace approximation. Fong et al. (2010), in a review of computational methods for Bayesian inference in generalized linear mixed models, also report poor performance of the INLA method in the case binary responses
Bayesian predictive inference about uses a second application of Bayes’ theorem to give the predictive distribution
| (17) |
where is the posterior distribution of . Comparison of (17) and (15) shows that both are weighted averages of plug-in predictive distributions. The difference between them is that (17) uses the posterior as the weighting distribution whilst (15) uses the sampling distribution . In either case, the weights concentrate increasingly around the maximum likelihood estimate of as the sample size increases.
In our experience the difference between plug-in prediction using the maximum likelihood estimate and weighted average prediction is often negligible, because the uncertainty in dominates that in . An intuitive explanation for this is that for estimation of all of the data contribute information, whereas for prediction of only data at locations and times relatively close to and contribute materially. However, this is not guaranteed, especially when the predictive target is a non-linear property of ; see, for example, Figure 9a of Diggle et al. (2002).
3.3 Diagnostics and novel extensions
In order to check the validity of the chosen spatio-temporal covariance function, we modify the Monte Carlo algorithm introduced in Section 3.1 by replacing (Step 1) with following.
-
(Step 1)
Simulate at observed locations and times , for , from its marginal multivariate distribution under the assumed model. Conditionally on the simulated values of , simulate binomial data from (2). Finally, compute the point estimates using the simulated data.
In this case, the resulting 95 tolerance band is generated under the assumption that the true covariance function for exactly corresponds to the one adopted for the analysis. If lies outside the intervals, then this indicates that the fitted covariance function is not compatible with the data. To formally test this hypothesis, we can also use the following test statistic
| (18) |
where and are the distance and time separations of the variograms bins, respectively, the are the numbers of pairs of observations contributing to each bin and is the true parameter value of the covariance parameters. Since is almost always unknown, it can be estimated using either maximum likelihood or Bayesian methods, in which case (18) should be averaged over the posterior distribution of using posterior samples , i.e.
| (19) |
The null distribution of can be obtained using the simulated values for from the modified (Step 1) introduced in this section. Let denote the -th sample from the null distribution of , for . Since evidence against the adopted covariance model arises from large values of , an approximate p-value can be computed as
where takes value 1 if and 0 otherwise, and is the value of the test statistic obtained from the data.
An unsatisfactory result from this diagnostic check could indicate a need for either or both of two extensions to the model: a more flexible family of stationary covariance structures; or non-stationarity induced by parameter variation over time, space or both.
In the former case, we note that the correlation function in (11) can also be obtained a special case of
| (20) |
where is the Matérn (1986) correlation function with scale and smoothness parameters and , respectively (Gneiting, 2002). Equation (11) is recovered for . However, the additional parameter introduced, , is likely to be poorly identified. A pragmatic response is to discretise the smoothness parameter in (20) to a finite set of values, e.g. , over which the likelihood function is maximized.
In the second case, the context of the analysis can provide some insights on the nature of the non-stationary behaviour of the process being studied. For example, if data are sampled over a large geographical area, such as a continent, one may expect the properties of the process to vary across countries. This can then be assessed by fitting the model separately for each country. A close inspection of the parameter estimates for might then reveal which of its components show the strongest variation. Furthermore, if these estimates also show spatial clustering, the vector , or some of its components, can be modelled as an additional spatial process, say . The process is then modelled as a stationary Gaussian process conditionally on . A similar argument can also be developed if data are collected over a large time period in a geographically restricted area. In this case, may primarily vary across time and, therefore, could be modelled as a temporal stochastic process.
3.3.1 Example: a model for disease prevalence with temporally varying variance
We now give an example of how model (2) can be extended in order to allow the nature of the spatial variation in disease prevalence to change over time. We replace the spatio-temporal random effect in the linear predictor with
| (21) |
where represents the temporally varying variance of . We then model as a stationary Gaussian process, independent of , with mean , variance and one-dimensional correlation function , with covariance parameters . Note that, using this parametrisation, and, therefore, . The resulting process is a non-Gaussian process with heavier tails than and correlation function
| (22) |
The likelihood function is obtained as in (12) but now with .
3.4 Defining targets for prediction
Let denote the set of prevalence surfaces covering the region of interest and spanning the time period . Prediction of is carried out by first simulating samples from the the predictive distribution of , i.e. the distribution of conditional on the data . From each simulated sample of , we then calculate any required summary, say, of the corresponding , for example means or selected quantiles at any of interest. By construction, this generates a sample from the predictive distribution of . Computational details and explicit expressions can be found in Giorgi & Diggle (2017).
Two ways to display uncertainty in the estimates of prevalence are through quantile or exceedance probability surfaces. We define the -quantile surface as
| (23) |
Similarly, we define the exceedance probability surface for a given threshold as
| (24) |
Values of the point-wise exceedance probability close to 1 identify locations for which prevalence is highly likely to exceed , and vice-versa.
In public health applications, an exceedance probability surface is a suitable predictive summary when the objective is to identify areas that may need urgent intervention because they are likely to exceed a policy-relevant prevalence threshold, say . A disease “hotspot” is then operationally defined as the set of locations , at a given time , such that .
In some cases, summaries by administrative areas can be operationally useful. For example, the district-wide average prevalence for a district at time is
| (25) |
where is its area of . Incidentally, can also be estimated more accurately than the point-wise prevalence , because it uses all the available information within . Quantile and exceedance probability surfaces can be defined for in the obvious way.
3.5 Visualization
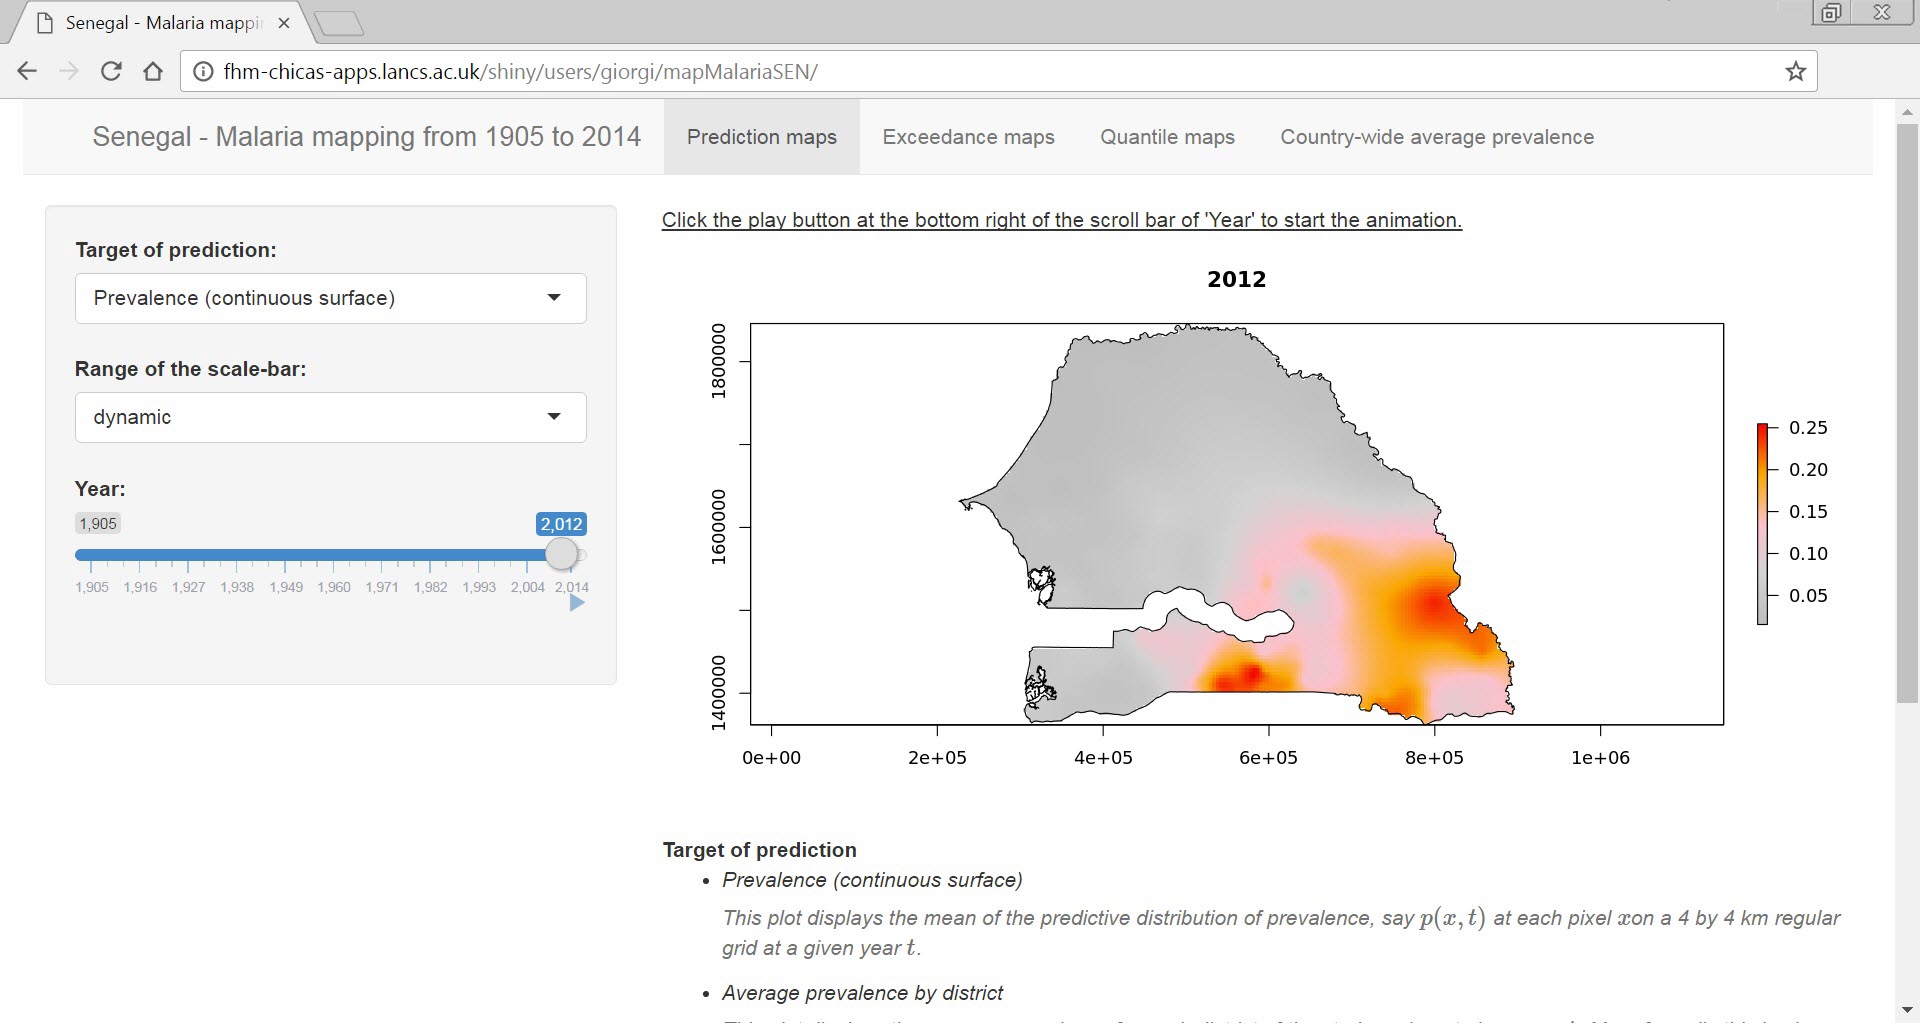
The output from the prediction step consists of a set of predictive surfaces, whether estimates, quantiles or exceedance probabilities, within the region of interest at times . Animations then provide a useful tool for visualizing the predictive spatio-temporal surfaces and highlighting the main features of the interpolated pattern of prevalence. The R package animation (Xie, 2013) provides utilities for writing animations in several video and image formats. However, if interactivity is also desired, web-based “Shiny” applications (SAs) (RStudio, Inc, 2013) represent one of the best alternatives within R.
For the analysis carried out in Section 4, we have developed an SA which can be viewed at
http://fhm-chicas-apps.lancs.ac.uk/shiny/users/giorgi/mapMalariaSEN/.
The user-interface of this SA is shown in Figure 2. Any of four panels can be chosen in order to display predictive maps of prevalence (“Prediction maps”), exceedance probabilities with user defined prevalence thresholds (“Exceedance maps”), quantile surfaces (“Quantile maps”) and country-wide summaries (“Country-wide average prevalence”). In the first three panels, the user can choose which target of prediction to display from a list and select the year on a slide bar. The range of prevalence and exceedance probabilities used to define the colour scale can be set to the observed range across the whole time series (“fixed”) or specific to each year (“dynamic”). The former option is convenient for comparisons between years, whilst the latter gives a more effective visualization of the spatial heterogeneity in the predictive target in a given year.
4 Case-study: historical mapping of malaria prevalence in Senegal from 1905 to 2014
We analyse malaria prevalence data from 1,334 surveys conducted in Senegal between 1905 and 2014. The data were assembled from three different data sources: historical archives and libraries of ex-colonial institutes; online electronic databases with data on malaria infection prevalence published since the 1980s; national household sample surveys. In assembling the data for the analysis, we only included locations that were classified as individual villages or communities or a collection of communities within a definable area that does not exceed 5 km2. For more details on the data extraction, see Snow et al. (2015a).
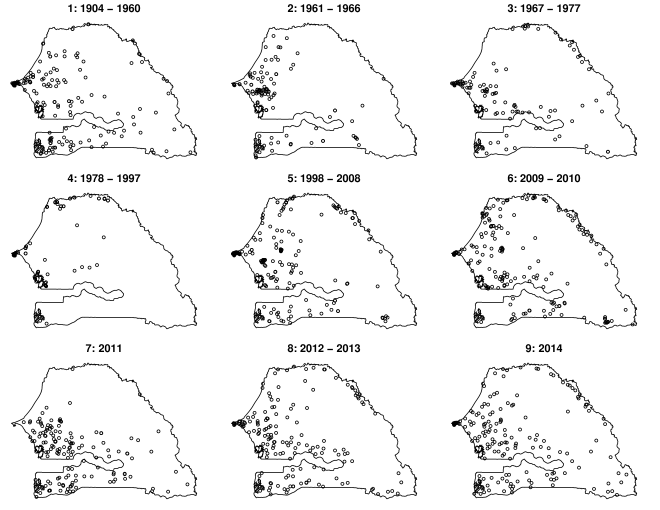
The outcome of interest is the count of positive microscopy tests out of for Plasmodium falciparum, at a community location and year . Table 1 shows the number of surveys and the average prevalence for each of the indicated time-blocks. These were identified by grouping the data points so that each time-block contains at least 100 surveys. We observe that 649 out of the 1334 surveys were carried out between 2009 and 2014. Also, the empirical country-wide average prevalence steadily declines from the first to the last time-block. Figure 3 displays the sampled community locations within each of the time-blocks. The plot suggests a poor spatial coverage of Senegal in some years. The use of geostatistical methods can therefore be beneficial since it allows us to borrow the strength of information by exploiting the spatio-temporal correlation in the data.
| Time-block | Number of surveys | Average prevalence |
|---|---|---|
| 1: 1904 - 1960 | 180 | 0.416 |
| 2: 1961 - 1966 | 109 | 0.384 |
| 3: 1967 - 1977 | 104 | 0.402 |
| 4: 1978 - 1997 | 101 | 0.134 |
| 5: 1998 - 2008 | 191 | 0.111 |
| 6: 2009 - 2010 | 187 | 0.051 |
| 7: 2011 | 140 | 0.043 |
| 8: 2012 - 2013 | 157 | 0.038 |
| 9: 2014 | 165 | 0.019 |
Our model for the data is of the form (26), with the following linear predictor
| (26) | |||||
where and are the lowest and largest observed ages among the sampled individuals at location and time , respectively. In (26), we use linear splines, each with a single knot, at 5 years for and at 20 years for . For the spatio-temporal process , we use a Gneiting correlation function, as in (11), with , i.e. a separable covariance function.
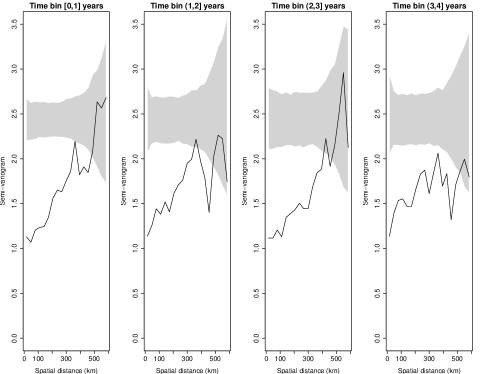
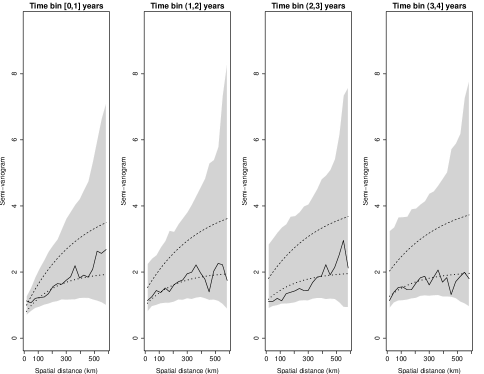
Using the predictive mean as a point estimate of the random effects from a non-spatial binomial mixed model, we carry out the test for residual spatio-temporal correlation, as outlined in Section 3.1. The upper panels of Figure 4 show overwhelming evidence against the assumption of spatio-temporal independence. We then initialize the covariance parameters, and , using a least squares fit to the empirical variogram, as shown by the dotted lines in the lower panels of Figure 4.
| Parameter | Estimate | CI (GA) | CI (PB) |
|---|---|---|---|
| -1.830 | (-3.180, -0.480) | (-3.131, -0.367) | |
| 0.118 | (0.017, 0.220) | (0.019, 0.226) | |
| -0.334 | (-0.562, -0.105) | (-0.585, -0.103) | |
| 0.015 | (-0.022, 0.052) | (-0.025, 0.052) | |
| -0.014 | (-0.055, 0.027) | (-0.056, 0.030) | |
| 3.650 | (2.378, 5.601) | (2.272, 5.222) | |
| 381.022 | (225.948, 642.528) | (220.593, 568.953) | |
| 0.157 | (0.097, 0.253) | (0.105, 0.253) | |
| 6.730 | (3.571, 12.683) | (3.484, 10.669) |
| Posterior mean | credible interval | |
|---|---|---|
| -1.899 | (-3.746, -0.275) | |
| 0.116 | (0.013, 0.212) | |
| -0.335 | (-0.560, -0.115) | |
| 0.013 | (-0.023, 0.050) | |
| -0.013 | (-0.054, 0.028) | |
| 4.649 | (2.887, 7.641) | |
| 504.330 | (283.019, 863.198) | |
| 0.137 | (0.075, 0.217) | |
| 9.098 | (4.443, 16.608) |
We conducted parameter estimation and spatial prediction using both likelihood-based and Bayesian inference. In the latter case, we specifed the following set of independent and vague priors: ; ; ; ; . Table 2 shows the maximum likelihood estimates of the model parameters and their corresponding 95% confidence intervals based on the Gaussian approximation (GA) and on parametric boostrap (PB), together with Bayesian esimates (posterior means) and 95% credible intervals. The two non-Bayesian methods give similar confidence intervals; the difference is noticeable, although still small in practical terms, only for the parameter . The Bayesian method gives materially larger estimates of and . Note that for both of these parameters, the prior means are substantially larger than the maximum likelihood estimates, suggesting that the priors, although vague, have nevertheless had some impact on the estimates.
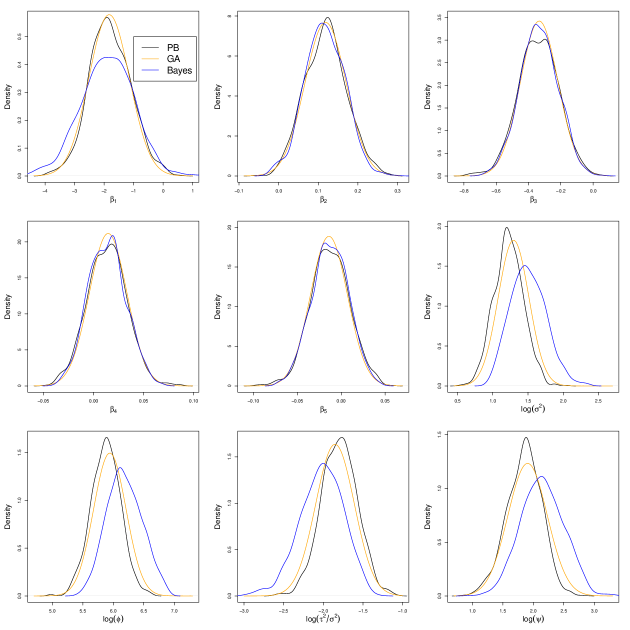
Figure 5 gives a different perspective on the similarities and differences between the results obtained by the non-Bayesian and Bayesian methods. The Bayesian posterior density of the intercept has heavier tails than the sampling distribution of the maximimum likelihood estimator; the posterior densities of , and are shifted to the right of their non-Bayesian counterparts, whilst the posterior density of is shifted to the left. Finally, there is some residual skewness in the PB distributions of the log-transformed covariance parameters.
Using the Monte Carlo methods of Section 3.3, we checked the validity of the assumed covariance model. The lower panels of Figure 4 show that for each of the four time-lag intervals considered, the observed variograms fall within within the 95 tolerance region obtained under the fitted model; the -value for a Monte Carlo goodness-of fit test using the test statistic (18) is 0.548.

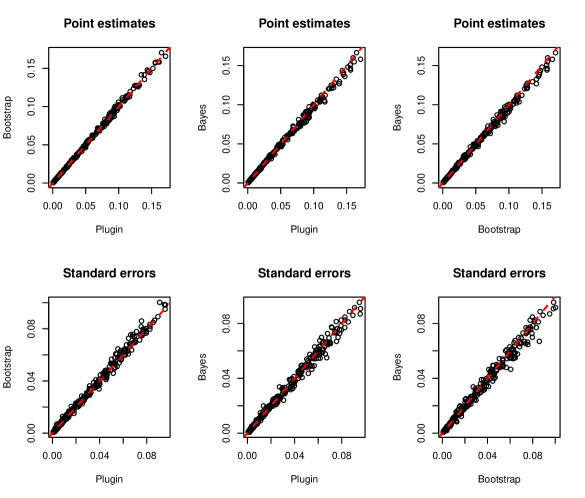
Figure 6 shows the profile deviance function
where is the profile likelihood for the parameter of spatio-temporal interaction parameter and is its Monte Carlo maximum likelihood estimate. The dashed horizontal line is the 0.95 quantile of a distribution with one degree of freedom. The flatness of indicates that data give very little information about the non-separability of the correlation structure of .
To assess the differences in the spatial predictions obtained using thr GA, PB and Bayesian approaches, we used each method to predict P. falciparum prevalence for children between 2 and 10 years of age () in the year 2014, at each point on a 10 by 10 km regular grid covering the whole of Senegal. Figure 7 shows pairwise scatterplots of the three sets of point predictions and associated standard deviations of . All six scatter plots show only small deviations from the identity line.
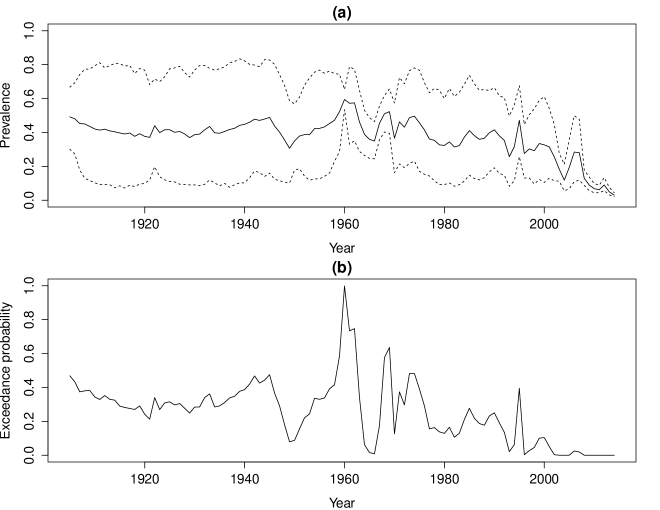
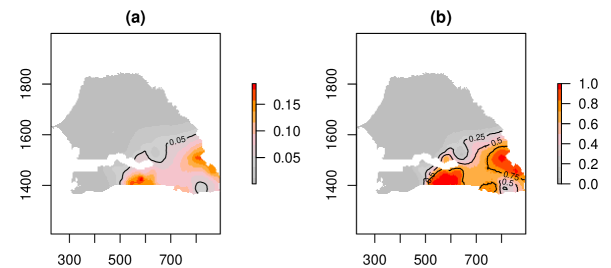
Figure 8(a) shows point and interval predictions of average country-wide . We observe a steady decline in in the most recent decade. The highest predicted value of across the whole of the time series occured in 1960, the year in which Senegal gained independence from France. Figure 8(b) shows for each year the predictive probability that average country-wide exceeded 5%. Figure 9 shows the surfaces of the predictive mean (left panel) and the preditive probability that prevalence exceeds prevalence (right panel), for the year 2014. In the right panel, we can identify two disjoint areas in the south-west of Senegal, where the probability of exceeding is at least 75. In areas between the contour of 50 and 75 exceedance probability we are less confident that exceeds . These aspects relating to the uncertainty about the threshold cannot be deduced from the map of prevalence estimates in the left panel, nor would a map of pointwise prediction variances be of much help.
5 Discussion
We have developed a statistical framework for the analysis of spatio-temporally referenced data from repeated cross-sectional prevalence surveys. Our aim was to provide a set of tools and principles that can be used to identify a parsimonious geostatistical model that is compatible with the data. In our view, model validation should include checking the validity of the specific assumptions made on rather than be focused exclusively on predictive performance, so as to avoid the risk of attaching spurious precision to predictions from an inappropriate model.
The variogram is very widely used in geostatistical analysis. We use it both for exploratory analysis and model validation, but favour likelihood-based methods, whether non-Bayesian or Bayesian, for parameter estimation and formal model comparison; an example of the latter is our use of the profile deviance to justify fitting a model with separable correlation structure to the Senegal malaria data.
In our spatio-temporal analysis of historical malaria prevalence data from Senegal, we have shown how to incorporate parameter uncertainty within a likelihood-based framework by approximation of the distribution of the maximum likelihood estimator using the Gaussian approximation and parametric bootstrap. The results showed that the Gaussian approximation provides reliable numerical inferences for the regression coefficients but was slightly inaccurate for the log-transformed covariance parameters. For this reason, we generally recommend using parametric bootstrap whenever this is computationally feasible. In our view, this gives a viable approach to handling parameter uncertainty in predictive inference without requiring the specification of so-called non-informative priors. Non-Bayesian and Bayesian approaches showed some differences with respect to parameter estimation, but delivered almost identical point predictions and predictive standard deviations for the spatial estimates of prevalence. Our results also illustrate how even large geostatistical data-sets often lead to disappointingly imprecise inferences about model parameters. For this reason, we woild favour Bayesian inference when, and only when, an informative prior can be specified from contextually based expert prior knowledge of the process under investigation.
In Section 3.3, we discussed how to extend the standard model for prevalence data in order to let the model parameters change over time, space or both. However, the use of these models requires a large amount of the data and good spatio-temporal coverage so as to detect non-stationary patterns in prevalence. In the Senegal malaria application application the spatio-temporal sparsity of the sampled locations meant that the data could not be used to reliably detect spatio-temporal variation in the covariance parameters. For this application we also assumed that the sampling locations did not arise from a preferential sampling scheme. The standard geostatistical model for prevalence can also be extended to account for preferentiality in the sampling design, based on the framework developed by Diggle et al. (2010). However, such a model would require a larger amount of data than was available for this application.
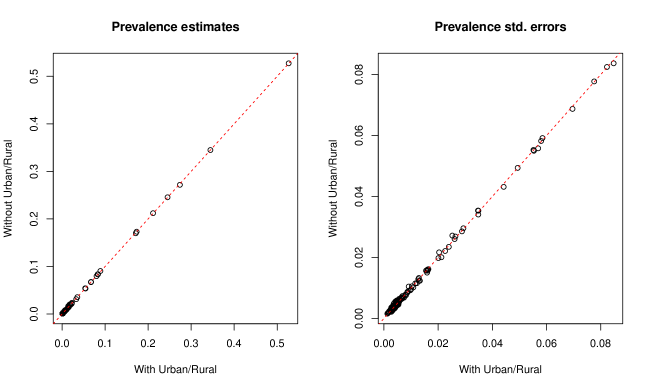
Our analysis included data from the Demographic and Health Survey (DHS) conducted in Senegal in 2014. These data were collected using a two-stage stratified sampling design (ANSD, 2015). In the first stage, 200 census districts (CDs) are randomly selected, 79 among urban CDs and 121 among rural CDs, with probability proportional to the population size. In the second stage, an enumeration list from each CD was used to sample households randomly. In the analysis reported above, we could not account for the sampling design of the DHS data because of the lack of information on urban and rural extents for every single year when the surveys were conducted. However, since this variable is available for 2014, we extracted the DHS data and fitted two geostatistical models with and without an explanatory variable that classifies every location as rural or urban. Figure 11 shows the plots for the estimated prevalence and associated standard errors obtained from the two models. The differences both in the point estimates and standard error of prevalence are negligible. Hence, we do not expect the sampling design adopted in the DHS survey to affect the results reported in Section 4.
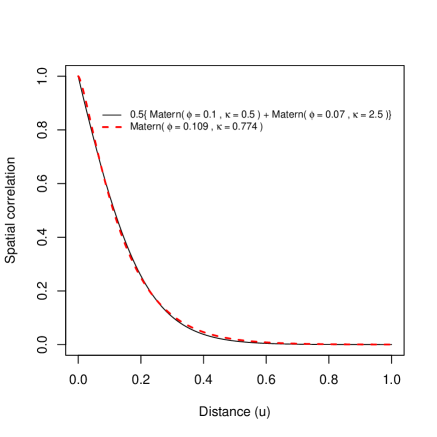
In model (2), spatial confounding can arise when some of the variation in prevalence due to to the effect of spatially structured risk factors is attributed by the model to the stochastic process . This phenomenon affects the interpretation of the regression parameters ; see, for example, Paciorek (2010) and Hodges & Reich (2010). However, the following argument supports our experience that it has a negligible impact on predictive inference for . Consider, for simplicity, the following purely spatial model,
| (27) |
If both of and are observed, fitting the model (27) with and as covariates, i.e. conditioning on both and , would lead to consistent estimation of and . If only is observed, we can only condition on . Now assume that , with and independent processes, and re-express (27) as
| (28) | |||||
where and . Provided that we correctly specify the model for , conditioning on will lead to consistent estimation of , which is all that we require for prediction of . Now suppose that and are Matérn processes, but we specify to be a Matérn process. This is incorrect, but we conjecture that it is a good approximation. Figure 10 shows an example in which and and have Matérn covariance functions with unit variance, scale parameters and and smoothness parameters and , respectively. The resulting correlation function of is , which can be closely approximated by a single Matérn, , where is a Matérn correlation function with scale parameter and smoothness parameter .
For large data-sets, it may be necessary to use an approximation of the spatio-temporal Gaussian process in order to make inference computationally feasible. One such approach is to use a low-rank approximation (Higdon, 1998, 2002) in which is represented as a finite linear combination of basis functions with radom coefficients; see, for example, Rodrigues & Diggle (2010) who develop a class of non-separable spatio-temporal covariance functions using this approach. Another approach is to formulate as the solution to a stochastic partial differential equation (SPDE). Lindgren et al. (2011) develop a general framework for this approach, in which Gaussian Markov random fields are used to obtain a computationally fast solution to a discretised version of the defining SPDE. In the case of binary data, the computational burden can also be reduced by using data augmentation sampling schemes (Holmes & Held, 2006).
Throughout the paper, we have assumed that the process is isotropic. To diagnose anisotropy, a directional version of the variogram can be used, in which inter-point distances are replaced by vector differences and the results displayed as a three-dimensional scatterplot at each time-lag. Weller & Hoeting (2016) provides a comprehensive survey of non-parametric diagnostic methods used to test specific deviations from the assumption of isotropy. A limitation of most of these methods is that they require the spatial process to be observed either on a grid or on a relaisation of a homogeneous Poisson process. Additionally, the properties of these tests have only been investigated when the response is continuous. The sample size required to obtain adequate power is likely to be higher in the case of binomial data.
In addition to the sampling designs that we discussed in Section 2, cluster sampling is another cost-effective alternative to simple random sampling. In households surveys, a cluster might correspond to a geographically restricted area, e.g. a village or group of households, which are randomly selected in a first stage. One of the potential, but still unexplored, uses of this sampling design in disease mapping would be to disentangle the long-range and small-range spatial variation in disease risk. To pursue this objective the nugget component in (2) could be modelled as an additional Gaussian process whose scale of spatial correlation is constrained to be smaller than that of . Separating these two spatial scales of correlation would require a large amount of data and would be dependent on the spatial arrangement of the clusters.
We have not considered issues of data-quality variation across multiple surveys. This has been addressed by (Giorgi et al., 2015), who developed a multivariate geostatistical model to combine prevalence data from multiple randomised and non-randomised surveys. Incorporation of this modelling framework into the methods of Section 3 would be straightforward given the required data, since all the different stages of the analysis can still be carried out using the same tools and principles.
Acknowledgements
EG holds an MRC Strategic Skills Fellowship in Biostatistics (MR/M015297/1). RWS is funded as a Principal Fellow by the Wellcome Trust, UK (No. 079080 and 103602) and is grateful to the UK’s Department for International Development for their continued support to the project Strengthening the Use of Data for Malaria Decision Making in Africa first, funded and piloted in 2013 (DFID Programme Code No. 203155). AMN acknowledges support from the Wellcome Trust as an Intermediary Fellow (No. 095127).
References
- ANSD (2015) ANSD (2015). Sénǵal : Enquête Démographique et de SantĆontinue (EDS-Continue 2014). Rockville, Maryland, USA : Agence Nationale de la Statistique et de la Démographie and ICF International.
- Bennett et al. (2013) Bennett, A., Kazembe, L., Mathanga, D., Kinyoki, D., Ali, D., Snow, R. & Noor, A. M. (2013). Mapping malaria transmission intensity in malawi, 2000-2010. American Journal of Tropical Medicine and Hygiene 89, 840–849.
- Bonat & Ribeiro (2016) Bonat, W. H. & Ribeiro, P. J. (2016). Practical likelihood analysis for spatial generalized linear mixed models. Environmetrics 27, 83–89. Env.2375.
- Chipeta et al. (2016) Chipeta, M. G., Terlouw, D. J., Phiri, K. S. & Diggle, P. J. (2016). Adaptive geostatistical design and analysis for prevalence surveys. Spatial Statistics 15, 70 – 84.
- Christensen (2004) Christensen, O. F. (2004). Monte Carlo maximum likelihood in model-based geostatistics. Journal of Computational and Graphical Statistics 3, 702–718.
- Clements et al. (2006) Clements, A., Lwambo, N., Blair, L., Nyandindi, U., Kaatano, G., Kinung’hi, S., Webster, J., Fenwick, A. & Brooker, S. (2006). Bayesian spatial analysis and disease mapping: tools to enhance planning and implementation of a schistosomiasis control programme in tanzania. Tropical Medicine and International Health 11, 490–503.
- Diggle & Giorgi (2016) Diggle, P. J. & Giorgi, E. (2016). Model-based geostatistics for prevalence mapping in low-resource setting (with discussion). Journal of the American Statistical Association DOI: 10.1080/01621459.2015.1123158.
- Diggle et al. (2010) Diggle, P. J., Menezes, R. & Su, T. (2010). Geostatistical inference under preferential sampling. Journal of the Royal Statistical Society, Series C 59, 191–232.
- Diggle et al. (2002) Diggle, P. J., Moyeed, R., Rowlingson, B. & Thomson, M. (2002). Childhood malaria in the Gambia: a case-study in model-based geostatistics. Journal of the Royal Statistical Society, Series C 51, 493–506.
- Diggle & Ribeiro (2007) Diggle, P. J. & Ribeiro, P. J. (2007). Model-based geostatistics. Springer Science+Business Media, New York.
- Diggle et al. (1998) Diggle, P. J., Tawn, J. A. & Moyeed, R. A. (1998). Model-based geostatistics (with discussion). Applied Statistics 47, 299–350.
- Fletcher (1987) Fletcher, R. (1987). Practical methods of optimization. John Wiley & Sons, New York, 2nd ed.
- Fong et al. (2010) Fong, Y., Rue, H. & Wakefield, J. (2010). Bayesian inference for generalized linear mixed models. Biostatistics 11, 397.
- Gething et al. (2012) Gething, P. W., Elyazar, I. R. F., Moyes, C. L., Smith, D. L., Battle, K. E., Guerra, C. A., Patil, A. P., Tatem, A. J., Howes, R. E., Myers, M. F., George, D. B., Horby, P., Wertheim, H. F. L., Price, R. N., Müeller, I., Baird, J. K. & Hay, S. I. (2012). A long neglected world malaria map: Plasmodium vivax endemicity in 2010. PLoS Neglected Tropical Diseases 6, e1814.
- Geyer (1994) Geyer, C. J. (1994). On the convergence of Monte Carlo maximum likelihood calculations. Journal of the Royal Statistical Society, Series B 56, 261–274.
- Geyer (1996) Geyer, C. J. (1996). Estimation and optimization of functions. In Markov Chain Monte Carlo in Practice, W. Gilks, S. Richardson & D. Spiegelhalter, eds. London: Chapman and Hall, pp. 241––258.
- Geyer (1999) Geyer, C. J. (1999). Likelihood inference for spatial point processes. In Stochastic Geometry, Likelihood and Computation, O. E. Barndorff-Nielsen, W. S.Kendall & M. N. M. van Lieshout, eds. Boca Raton, FL: Chapman and Hall/CRC, pp. 79––140.
- Geyer & Thompson (1992) Geyer, C. J. & Thompson, E. A. (1992). Constrained Monte Carlo maximum likelihood for dependent data. Journal of the Royal Statistical Society, Series B 54, 657–699.
- Giorgi & Diggle (2017) Giorgi, E. & Diggle, P. J. (2017). Prevmap: an R package for prevalence mapping. Journal of Statistical Software 78, 1–29. DOI:10.18637/jss.v078.i08.
- Giorgi et al. (2015) Giorgi, E., Sesay, S. S. S., Terlouw, D. J. & Diggle, P. J. (2015). Combining data from multiple spatially referenced prevalence surveys using generalized linear geostatistical models. Journal of the Royal Statistical Society, Series A 178, 445–464.
- Gneiting (2002) Gneiting, T. (2002). Nonseparable, stationary covariance functions for space-time data. Journal of the American Statistical Association 97, 590–600.
- Hansell et al. (2014) Hansell, A. L., Beale, L. A., Ghosh, R. E., Fortunato, L., Fecht, D., Järup, L. & Elliott, P. (2014). The Environment and Health Atlas for England and Wales. Oxford University Press.
- Hay et al. (2009) Hay, S. I., Guerra, C. A., Gething, P. W., Patil, A. P., Tatem, A. J., Noor, A. M., Kabaria, C. W., Manh, B. H., Elyazar, I. R. F., Brooker, S., Smith, D. L., Moyeed, R. A. & Snow, R. W. (2009). A world malaria map: Plasmodium falciparum endemicity in 2007. PLoS Medicine 6, e1000048.
- Hedt & Pagano (2011) Hedt, B. L. & Pagano, M. (2011). Health indicators: Eliminating bias from convenience sampling estimator. Statistics in Medicine 30, 560–568.
- Higdon (1998) Higdon, D. (1998). A process-convolution approach to modeling temperatures in the North Atlantic Ocean. Environmental and Ecological Statistics 5, 173–190.
- Higdon (2002) Higdon, D. (2002). Space and space-time modeling using process convolutions. In Quantitative methods for current environmental issues, C. W. Anderson, V. Barnett, P. C. Chatwin & A. H. El-Shaarawi, eds. Springer-Verlag, New York, pp. 37–56.
- Hodges & Reich (2010) Hodges, J. S. & Reich, B. J. (2010). Adding spatially-correlated errors can mess up the fixed effect you love. The American Statistician 64, 325–334.
- Holmes & Held (2006) Holmes, C. C. & Held, L. (2006). Bayesian auxiliary variable models for binary and multinomial regression. Bayesian Analysis 1, 145–168.
- Joe (2008) Joe, H. (2008). Accuracy of laplace approximation for discrete response mixed models. Computational Statistics & Data Analysis 52, 5066–5074.
- Kabaghe et al. (2017) Kabaghe, A. N., Chipeta, M. G., McCann, R. S., Phiri, K. S., van Vugt, M., Takken, W., Diggle, P. & Terlouw, A. D. (2017). Adaptive geostatistical sampling enables efficient identification of malaria hotspots in repeated cross-sectional surveys in rural malawi. PLOS ONE 12, 1–14.
- Kleinschmidt et al. (2007) Kleinschmidt, I., Pettifor, A., Morris, N., MacPhail, C. & Rees, H. (2007). Geographic distribution of human immunodeficiency virus in South Africa. The American journal of tropical medicine and hygiene 77, 1163–1169.
- Kleinschmidt et al. (2001) Kleinschmidt, I., Sharp, B. L., Clarke, G. P. Y., Curtis, B. & Fraser, C. (2001). Use of generalized linear mixed models in the spatial analysis of small-area malaria incidence rates in Kwazulu Natal, South Africa. American Journal of Epidemiology 153, 1213–1221.
- Lindgren et al. (2011) Lindgren, F., Rue, H. & Lindström, J. (2011). An explicit link between Gaussian fields and Gaussian Markov random fields: the stochastic partial differential equation approach. Journal of the Royal Statistical Society. Series B 73, 423–498.
- López-Abente et al. (2007) López-Abente, G., Ramis, R., Pollán, M., Aragonés, N., Pérez-Gómez, B., Gómez-Barroso, D., Carrasco, J. M., Lope, V., Garciá-Pérez, J., Boldo, E. & García-Mendizábal, M. J. (2007). Atlas Municipale de Mortalidad por Cancér en Espana 1989-1998. Madrid: Instituto de Salud Carlos III.
- Lumley & Scott (2017) Lumley, T. & Scott, A. (2017). Fitting regression models to survey data. Statistal Science 32, 265–278.
- Matérn (1986) Matérn, B. (1986). Spatial Variation. Springer, Berlin, 2nd ed.
- Mercer et al. (2015) Mercer, L. D., Wakefield, J., Pantazis, A., Lutambi, A. M., Masanja, H. & Clark, S. (2015). Space–time smoothing of complex survey data: Small area estimation for child mortality. Ann. Appl. Stat. 9, 1889–1905.
- Neal (2011) Neal, R. M. (2011). MCMC using Hamiltonian dynamics. In Handbook of Markov Chain Monte Carlo, S. Brooks, A. Gelman, G. Jones & X.-L. Meng, eds., chap. 5. Chapman & Hall, CRC Press, pp. 113–162.
- Noor et al. (2014) Noor, A. M., Kinyoki, D. K., Mundia, C. W., Kabaria, C. W., Mutua, J. W., Alegana, V. A., Fall, I. S. & Snow, R. W. (2014). The changing risk of plasmodium falciparum malaria infection in africa: 2000–10: a spatial and temporal analysis of transmission intensity. The Lancet 383, 1739 – 1747.
- Paciorek (2010) Paciorek, C. J. (2010). The importance of scale for spatial-confounding bias and precision of spatial regression estimators. Statistical Science 25, 107–125.
- Pati et al. (2011) Pati, D., Reich, B. J. & Dunson, D. B. (2011). Bayesian geostatistical modelling with informative sampling locations. Biometrika 98, 35–48.
- Pullan et al. (2011) Pullan, R. L., Gething, P. W., Smith, J. L., Mwandawiro, C. S., Sturrock, H. J. W., Gitonga, C. W., Hay, S. I. & Brooker, S. (2011). Spatial modelling of soil-transmitted helminth infections in Kenya: A disease control planning tool. PLoS Neglected Tropical Diseases 5, e958.
- Raso et al. (2005) Raso, G., Matthys, B., N’goran, E. K., Tanner, b., Vounatsou, P. & Utzinger, J. (2005). Spatial risk prediction and mapping of schistosoma mansoni infections among schoolchildren living in western Côte d’Ivoire. Parasitology 131, 97–108.
- Roberts & Rosenthal (1998) Roberts, G. O. & Rosenthal, J. S. (1998). Optimal scaling of discrete approximations to langevin diffusions. Journal of the Royal Statistical Society: Series B (Statistical Methodology) 60, 255–268.
- Rodrigues & Diggle (2010) Rodrigues, A. & Diggle, P. J. (2010). A class of convolution-based models for spatio-temporal processes with non-separable covariance structure. Scandinavian Journal of Statistics 37, 553–567.
- RStudio, Inc (2013) RStudio, Inc (2013). Easy web applications in R. http://www.rstudio.com/shiny/.
- Rue et al. (2009) Rue, H., Martino, S. & Chopin, N. (2009). Approximate Bayesian inference for latent Gaussian models by using integrated nested laplace approximations. Journal of the Royal Statistical Society, Series B 71, 319–392.
- Skinner & Wakefield (2017) Skinner, C. & Wakefield, J. (2017). Introduction to the design and analysis of complex survey data. Statistical Science 32, 165–175.
- Snow et al. (2015a) Snow, R., Amratia, P., Mundia, C., Alegana, V., Kirui, V., Kabaria, C. & Noor, A. (2015a). Assembling a geo-coded repository of malaria infection prevalence survey data in Africa 1900-2014. Tech. rep. INFORM Working Paper, developed with support from the Department of International Development and Wellcome Trust, UK, June 2015. Avilable at http://www.inform-malaria.org/wp-content/uploads/2015/07/Assembly-of-Parasite-Rate-Data-Version-1.pdf.
- Snow et al. (2015b) Snow, R. W., Kibuchi, E., Karuri, S. W., Sang, G., Gitonga, C. W., Mwandawiro, C., Bejon, P. & Noor, A. M. (2015b). Changing malaria prevalence on the kenyan coast since 1974: Climate, drugs and vector control. PLoS ONE 10, 1–14.
- Soares Magalhaes & Clements (2011) Soares Magalhaes, R. J. & Clements, A. C. A. (2011). Mapping the risk of anaemia in preschool-age children: The contribution of malnutrition, malaria, and helminth infections in West Africa. PLoS Medicine 8, e1000438.
- Stein (2005) Stein, M. L. (2005). Space: Time covariance functions. Journal of the American Statistical Association 100, 310–321.
- Thomson et al. (1999) Thomson, M. C., Connor, S. J., D’Alessandro, U., Rowlingson, B., Diggle, P., Cresswell, M. & Greenwood, B. (1999). Predicting malaria infection in gambian children from satellite data and bed net use surveys: the importance of spatial correlation in the interpretation of results. The American Journal of Tropical Medicine and Hygiene 61, 2–8.
- Weller & Hoeting (2016) Weller, Z. D. & Hoeting, J. A. (2016). A review of nonparametric hypothesis tests of isotropy properties in spatial data. Statistical Science 31, 305–324.
- Xie (2013) Xie, Y. (2013). animation: An R package for creating animations and demonstrating statistical methods. Journal of Statistical Software 53, 1–27.
- Zhang (2002) Zhang, H. (2002). On estimation and prediction for spatial generalized linear mixed models. Biometrics 58, 129–136.
- Zouré et al. (2014) Zouré, Honorat, G. M., Noma, M., Tekle, Afework, H., Amazigo, U. V., Diggle, P. J., Giorgi, E. & Remme, J. H. F. (2014). The geographic distribution of onchocerciasis in the 20 participating countries of the african programme for onchocerciasis control: (2) pre-control endemicity levels and estimated number infected. Parasites & Vectors 7.