GASP VII. Signs of gas inflow onto a lopsided galaxy
Abstract
Theoretically, inflowing filaments of gas are one of the main causes of growth for a galaxy. Nonetheless, observationally, probing ongoing gas accretion is challenging. As part of the Gas Stripping Phenomena in galaxies with MUSE (GASP) program, we present the analysis of a spiral galaxy at whose characteristics indeed are consistent with a scenario in which gas accretion plays a major role. The most salient indirect parts of evidence that support this picture are: 1) The galaxy is isolated, its position rules out the mechanisms expected in dense environments. 2) It shows a pronounced lopsidedness extending toward West. According to the spatially resolved star formation history, this component was formed yr ago. 3) It has many large and elongated HII regions that are indication of a fragmentation due to disk instability. 4) The stellar and gas kinematics are quite symmetric around the same axis, but in the gas the locus of negative velocities shows a convexity toward East, as if new gas has been infalling with different orientation and velocity. 5) The metallicity distribution is inhomogeneous and shows exceptionally steep gradients from the center toward the outskirts, especially in the South-West side. 6) The luminosity weighted age is generally low ( Gyr) and particularly low (<7 Gyr) along a trail crossing the galaxy from South-West toward North. It might trace the path of the accreted gas. These findings point to an inflow of gas probably proceeding from the South-West side of the galaxy.
1 Introduction
A large fraction of galaxies in the local Universe present a non-symmetric light distribution in their disk, whose spatial extent is much larger along one half of the galaxy than the other (Baldwin et al., 1980; Block et al., 1994; Richter & Sancisi, 1994; Rix & Zaritsky, 1995; Schoenmakers et al., 1997; Zaritsky & Rix, 1997; Haynes et al., 1998; Matthews et al., 1998; Swaters et al., 1999; Bournaud et al., 2005). The asymmetry is often visible also in the rotation curves, such that the shape and the maximum velocity are different in the two halves of a galaxy (e.g. Mihalas & Binney, 1981; Jog, 2002). The percentage of these galaxies depends on the environment: it is larger than 50% in Hickson compact groups (Rubin et al., 1991; Nishiura et al., 2000), and is in the field (Rubin et al., 1999; Zaritsky & Rix, 1997; Sofue & Rubin, 2001). Given the frequency of this phenomenon, the lopsided modes should be fairly long-lived (e.g., Baldwin et al., 1980) or excited frequently.
Generally, the lopsidedness is clearly visible in the gaseous component (HI), and occurs also in the central regions, where the nucleus is offset with respect to the outer isophotes. The asymmetry is of type , where is the azimuthal wavenumber (e.g. Bournaud et al., 2005).
A similar fraction of galaxies () also present deviations from the single plane and exhibit an integral-shape with typical amplitudes of a few degrees in the stellar disc (e.g. Sanchez-Saavedra et al., 1990; Reshetnikov & Combes, 1998; Ann & Park, 2006). These galaxies usually also present even stronger warps in the neutral hydrogen (e.g. Sancisi, 1976; Bosma, 1981; Briggs, 1990; Bottema, 1995).
The asymmetry might be the result of different processes, such as tidal interactions (Beale & Davies, 1969), mergers (Walker et al., 1996), satellite gas accretion (Zaritsky & Rix, 1997), lopsided dark matter halo (Jog, 1997, 2002; Angiras et al., 2007), off-center disk in halo (Levine & Sparke, 1998; Noordermeer et al., 2001), gas accretion (Bournaud et al., 2005) or, in clusters and groups, ram pressure stripping (e.g., Young et al., 2006). In addition to these externally triggered processes, the disk lopsidedness could also arise as a global instability in self-gravitating disks (Junqueira & Combes, 1996; Bournaud et al., 2005). As discussed by Mapelli et al. (2008), the different scenarios might not be exclusive and different processes could induce different degrees of lopsidedness in the different galaxy components. For example, ram pressure might create only moderate tidal gas tails in galaxies without inducing lopsidedness in the stellar population; galaxy interactions in the form of flybys might account for much stronger asymmetries simultaneously both in the gaseous and in the stellar disc; gas accretion from filaments might produce even more pronounced lopsidedness, first in the gaseous disc, and only at later times in the stellar component, due to star formation in the asymmetric gaseous disc.
Several theoretical mechanisms have been proposed to explain the formation and maintenance of warped discs (e.g. Binney, 1992; Kuijken & Garcia-Ruiz, 2001; Sellwood, 2013, and references therein). Among the proposed scenarios, discrete modes of bending in a self-gravitating disc (Toomre, 1983; Sparke & Casertano, 1988), misaligned dark halos (Dubinski & Kuijken, 1995), galaxy interactions and accretion of satellites (e.g. Huang & Carlberg, 1997; Schwarzkopf & Dettmar, 2001; Kim et al., 2014), direct accretion of intergalactic matter in the outskirts of galaxies (e.g. Revaz & Pfenniger, 2001; van der Kruit, 2007; Roškar et al., 2010), extragalactic magnetic fields (Battaner et al., 1990), cosmic infall and outer gas accretion (Binney, 1992, e.g.), and others. This large variety of proposed mechanisms and their modifications probably indicates that there is no single mechanism responsible for all observable warps in galaxies. The current situation looks like the largest warps are mostly caused by tidal distortions (Schwarzkopf & Dettmar, 2001; Ann & Park, 2006), whereas relatively small warps are triggered and supported by a variety of mechanisms.
Overall, the most promising processes to describe lopsidedness are tidal encounters and gas accretion, with the former being the dominant mechanism for group galaxies. Indeed, a perturbation due to a tidal encounter between two galaxies with an arbitrary orientation can generate a force term, which can then induce lopsidedness in the galaxy (Combes et al., 2004). Lopsidedness can also be generated more indirectly due to the response of the disk to the distorted halo which feels a stronger effect of the interaction (Weinberg, 1995; Jog, 1997; Schoenmakers et al., 1997). A generally stronger perturbation resulting from the infall of a satellite galaxy can also result in the disk lopsidedness as shown in the N-body simulation study by Walker et al. (1996), who suggest that minor mergers can induce lopsidedness over a long time-scale (1 Gyr).
While tidal encounters can explain the observed amplitudes of disk lopsidedness, the N-body simulations by Bournaud et al. (2005) show that they cannot explain various observed statistical properties, such as the higher lopsidedness seen for the late-type field galaxies. Indeed, tidal encounters and mergers would tend to lead to the secular evolution of a galaxy towards earlier-type morphologies. Thus, if tidal interactions were the primary mechanism for generating lopsidedness, then the early-type galaxies should show a higher amplitude of lopsidedness. In addition, the amplitude of the lopsidedness seems not to correlate with the strength of a tidal encounter (Bournaud et al., 2005), or with the presence of nearby neighbors (Wilcots & Prescott, 2004). Tidal encounters typically generate a fast mode which is expected to be not long-lived (Ideta, 2002).
Thus mechanisms such as gas accretion from outside the galaxy need to be invoked to explain the lopsidedness in field galaxies.
There is growing evidence that galaxies steadily accrete gas from the external regions, as seen from cosmological models (Semelin & Combes, 2005), and also observed in nearby galaxies (Sancisi et al., 2008).
Smoothed particle hydrodynamics (SPH) simulations by Kereš et al. (2005) and grid-based adaptive mesh refinement simulations (e.g. Ocvirk et al., 2008) predict that galaxies can accrete large amounts of gas from the Inter Galactic Medium (IGM) along cosmological filaments and show that a fraction of the inflowing gas is delivered to the disk not heated to the virial temperature of the halo (the so-called “cold accretion mode” - e.g., Kereš et al., 2005; Dekel & Birnboim, 2006; Ocvirk et al., 2008; Brooks et al., 2009; Dekel et al., 2009; Faucher-Giguere, 2011; Faucher-Giguère et al., 2011; van de Voort et al., 2011; Hobbs et al., 2015; Silk & Mamon, 2012; Genel et al., 2012). The cold accretion mode appears to be most efficient at high redshifts (), but at low redshifts it seems to mainly occur in low-mass galaxies with Mhalo .
However, more recently, Nelson et al. (2013) showed that the role of cold accretion might have been overestimated in previous smoothed particle hydrodynamics simulations. The new calculations, performed with the moving mesh code (arepo, Springel, 2010), indicate that the majority of gas is heated to the virial temperature before accreting onto the halo, at all galaxy masses (see also Torrey et al., 2012; Nelson et al., 2016).
The cold accreted gas does not necessarily mix with the existing gaseous halo and over a few billion years it can represent a significant fraction of the disk mass itself (both as gas phase and as newborn stars). This accretion can be asymmetrical (e.g. Jog & Combes, 2009, and references therein), due to the different gas distribution along the filaments and to the different accretion rate.
The degree of lopsidedness decreases after a few Gyrs, even if accretion is not stopped, because the disk re-orients itself in regard to the filament. If there are more filaments with different accretion rates (e.g., Semelin & Combes, 2005), the lopsidedness will generally be more moderate. In the simulations, when accretion is stopped the lopsidedness has a typical lifetime of 3 Gyr (Bournaud et al., 2005).
Therefore gas accretion can be the clue to explaining strong lopsidedness in galaxies that have no sign of recent interaction/merger.
Gas accretion might also induce the formation of clumps in the disk due to local gravitational instabilities. Clumping instabilities also cause starbursts, with a star formation rate typically enhanced by a factor of 10 in the present models. These bursts are thus not related to interactions, although the large-scale environment should influence this kind of activity indirectly through its role in the growth of disks (e.g. Noeske et al., 2007; Elmegreen et al., 2007).
Finally, another consequence of gas accretion might be metallicity gradients. This connection is poorly explored in the literature. Primordial gas accreted through filaments should be characterized by a lower metallicity than that of the target galaxy. Note that instead both flybys and ram pressure are expected not to significantly affect metallicity gradients (Mapelli et al., 2008). However, it is important to keep in mind that stars form from a mixture between the gas in the cold filament and the gas which was already in the disk. Moreover, if the gas accretion from the filament is not recent, but occurred in the past, phenomena like pollution from supernovae, stellar winds and other feedback mechanisms might have already erased any metallicity gradient both in the gaseous and in the stellar component.
In the local Universe, the advent of wide-field integral field spectroscopy (IFS) is permitting to study metallicity gradients in a statistical way (e.g. Sánchez et al., 2014; Ho et al., 2015). On-going large IFS surveys include the Calar Alto Legacy Integral Field Area (CALIFA) Survey (Sánchez et al., 2012), the Sydney-AAO Multi-object Integral field spectrograph (SAMI) Survey (Croom et al., 2012), the Mapping Nearby Galaxies at Apache Point Observatory (MaNGA) Survey (Bundy et al., 2015). Overall, disc galaxies have been found to universally exhibit negative metallicity gradients, i.e. the centre of a galaxy has a higher metallicity than the outskirts (e.g. Zaritsky et al., 1994; Moustakas et al., 2010; Rupke et al., 2010; Sánchez et al., 2014, and references therein).
Gas accretion and metallicity gradients have been also studied at higher redshift. For example, Cresci et al. (2010) observed low metallicity regions in three galaxies at 3, providing evidence for the actual presence of accretion of metal-poor gas in massive high-z galaxies, capable to sustain high star formation rates without frequent mergers of already evolved and enriched objects. In this paper we present the analysis of an isolated spiral galaxy in the local universe presenting asymmetric features that we will argue are most likely due to cold gas accretion. This galaxy is drawn from GASP111http://web.oapd.inaf.it/gasp/index.html (GAs Stripping Phenomena in galaxies with MUSE), an ongoing ESO Large programme granted 120 hours of observing time with the integral-field spectrograph MUSE mounted at the VLT aimed at characterizing where, how and why gas can get removed from galaxies. A complete description of the survey strategy, data reduction and analysis procedures is presented in (Poggianti et al., 2017, Paper I). Briefly, GASP targets 94 “stripping-candidate galaxies” in a wide range of environments (from clusters to the general field) selected from a catalog built on a systematic search for galaxies with optical signatures of unilateral debris or tails. Such signatures are reminiscent of gas stripping processes or other processes leading to extraplanar star formation in outgoing gas (Poggianti et al., 2016). Targets are selected from WINGS (Fasano et al., 2006) and OMEGAWINGS (Gullieuszik et al., 2015) surveys and from the Padova Millennium Galaxy and Group Catalogue (PM2GC, Calvi et al., 2011). As all the other targets of GASP, the galaxy we discuss in this paper was selected for presenting a B-band morphological asymmetry suggestive of unilateral debris.
Throughout all the papers of the GASP series, we adopt a Chabrier (2003) initial mass function (IMF) in the mass range 0.1-100 M⊙. The cosmological constants assumed are , and H km s-1 Mpc-1. This gives a scale of 0.912 kpc/′′ at the redshift of P11695, which is .
2 The target
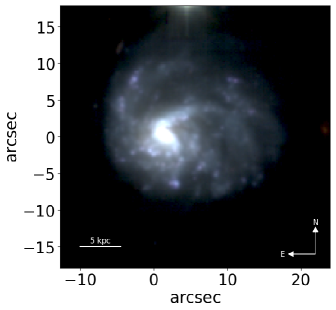
Focus of this analysis is P11695 (RA: 10:46:14.78, DEC: +00:03:01.5), a galaxy at z= 0.04648 drawn from the Millennium Galaxy Catalog (Liske et al., 2003; Driver et al., 2005). Figure 1 shows a color composite image obtained combining the reconstructed , and filters from the MUSE datacube. It appears evident that P11695 is an asymmetric spiral galaxy possessing trails of bright knots across the disk. The galaxy seems also to be characterized by a small U-shaped warp.
2.1 Observations
Following the GASP strategy, P11695 was observed in service mode with the MUSE spectrograph, mounted at the Nasmyth focus of the UT4 VLT, at Cerro Paranal in Chile. It was observed on 9/10-Jan-2016, with photometric conditions; the seeing at 650nm (measured on telescope guide star) remained below 07 during the whole observing block. A total of four 675 second exposures were taken with the Wide Field Mode.
MUSE is composed by 24 IFU modules and each of them is equipped with a 4k4k CCD. The spectral coverage spans the wavelength range between 4500Å and 9300Å, with a sampling of 1.25 Å/pixel and a spectral resolution of 2.6Å. The field of view is sampled at /pixel; each datacube therefore consists of 105 spectra.
2.2 Data reduction
The data reduction process for all galaxies in the GASP survey is presented in Paper I. Briefly, raw data were reduced using the latest ESO MUSE pipeline available at the time of observations (v1.2.1).
As the data have sufficient sky coverage, the sky was modeled directly and subtracted from individual frames using the 20% pixels with the lowest counts. After wavelength calibration using arc lamp exposures, the final wavelength adjustments were made using sky emission lines. The final, flux-calibrated data cube was generated by lining up and combining the individual frames using sources in the white light images and consists of 329329 spectra with radial velocities corrected to the barycenter of the Solar System. The FWHM of point-like sources on the image obtained by convolving the final MUSE datacube with the V-band filter is 08 (4 pixels).
3 Analysis
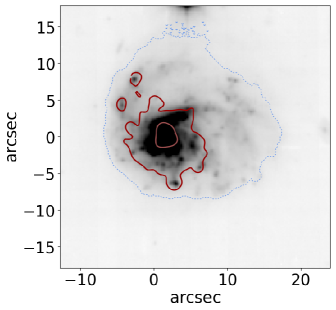
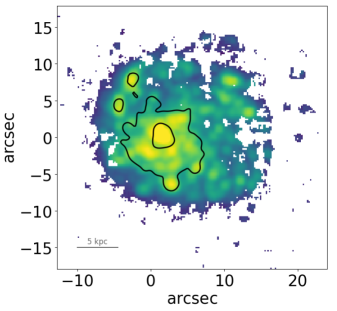
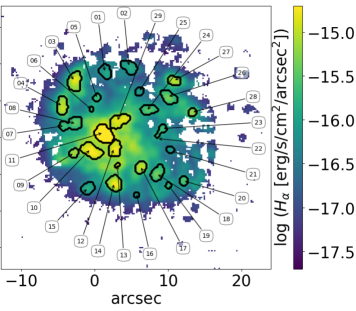
Figure 2 shows the white-light image from MUSE (4750-9350 Å). From now on, we will use the contours representing the distribution of the oldest stellar population (see Sect. 3.6 and Fig. 14) to define the “original body” of the galaxy. Instead, we will call “main body” of the galaxy the region containing the spaxels whose near-H continuum flux is above the background level (see also Paper I, ).
The lopsided shape of the galaxy clearly stands out. Traces of debris to the North and West of the main body and bright knots distributed across the galaxy appear evident.
The presence of the knots becomes even more striking in the MUSE H map, shown in Fig. 3. The standard procedure developed within the GASP project to identify these H knots (see Paper I for details) detected 101 knots, less than 10 of which are outside the main body. However, this automatic procedure assumes all the knots have a round shape, but, as it is evident from Fig. 3, this is not the case for P11695. We therefore developed another procedure that selects all the regions with a flux larger than the (arbitrary value of) . Many other fainter knots are visible, but, to be conservative, we choose to focus only on the brightest ones. The right panel of Fig. 3 shows the 29 bright knots we detected with this approach. We note that while many other stripping candidates in the GASP sample are characterized by a conspicuous number of knots, usually these are located mainly in the stripping tails and have a round shape (Paper I; Gullieuszik et al. 2017, Paper IV). In contrast, almost all the knots in P11695 are located on the galaxy disk and they clearly show elongated shapes. These peculiarities induce us to pay particular attention to the properties of the knots, and in what follows we will characterize them separately.
In the left panel of Fig. 3 we overplot the contours of the original body to the H flux map. The latter is much more extended than the older stellar population, especially on the West side of the galaxy, showing how the galaxy grew in size over time.
3.1 Dust
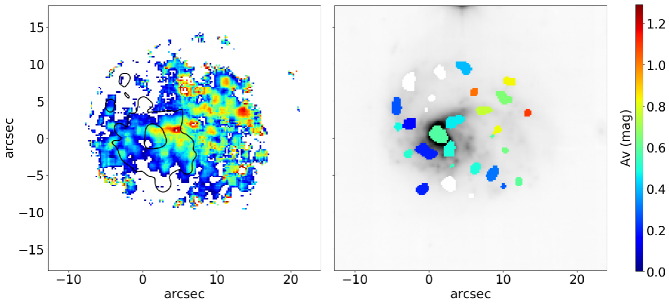
The fluxes presented in Fig. 3 were corrected for extinction by dust internal to P11695. The map of the dust extinction AV is obtained from the absorption-corrected Balmer decrement in each spaxel. As described in Paper I, we assumed an intrinsic H/H ratio equal to 2.86 and adopt the Cardelli et al. (1989) extinction law. The AV map has been calculated only for spaxels where the S/N on the H and H lines is larger than 3 and the ratio of the two lines is larger than the assumed 2.86 value for the Balmer decrement.
The map (Fig. 4) shows that overall P11695 is characterized by low values of extinction, almost always mag. The North-West side of the galaxy has a systematically larger extinction that the South-East side. Note, however, that the in the East side of the galaxy there are many regions where is not measured. In these regions indeed H might be undetected because of obscuration by dust.
To compute the dust extinction of the H knots, we assign the median value within each knot to all the spaxels in that knot, therefore spaxels with no measurement in the left hand panel of Fig. 4 might have an associated measurement in the right hand panel. The estimate in the knots can be therefore considered as a lower limit of the true values. However, we have compared these values to those obtained by integrating over the spectra in each knot, finding good agreement. We find that not all the knots are highly extincted, as we would expect in strongly star forming regions. Overall, there does not seem to be a strong correlation between the position of the knots and the distribution of the dust.
3.2 Gas ionization mechanism
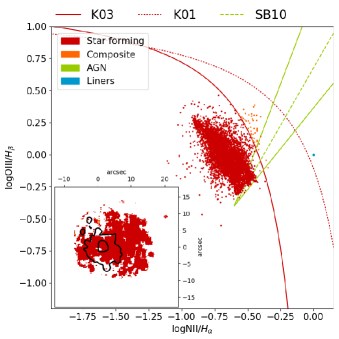
The next step is to characterize the ionizing sources as a function of the position, and detect the possible presence of an active galactic nucleus (AGN). We therefore inspect the diagnostic diagrams (e.g., Kewley et al., 2006) based on the emission lines located within our cube observed range (i.e. H, [OIII] 5007 Å, [OI] 6300 Å, H, [NII] 6583 Å, and [SII] 6716+6731 Å). The lines’ intensities were measured after subtraction of the continuum, exploiting the pure stellar emission best fit model provided by our spectral fitting code sinopsis (Fritz et al., 2017, Paper III, see Sect. 3.6), to take into account any possible contamination from stellar photospheric absorption. Only spaxels with a in all the emission lines involved were considered.
All the diagnostic tools are concordant that the emission-line ratios are consistent with gas being photoionized by young stars (“Star-forming” according to Kauffmann et al., 2003; Kewley et al., 2006). As an example, Fig. 5 shows the [OIII]5007/H vs [NII]6583/H.
Véron-Cetty & Véron (2003) classified P11695 (identified as SDSS J10462+0003) as Seyfert 1, but this catalog is obsoleted by Véron-Cetty & Véron (2006), which does not detect any sign of AGN activity, in agreement to our results.
We also characterize the main source of ionization for the H knots and, according to BPT diagrams, they are all powered by star formation (plot not shown).
3.3 The integrated and spatially resolved Star Formation Rate
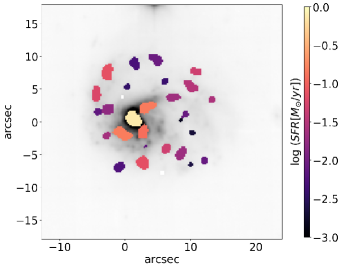
Having assessed that the ionization source in P11695 is mostly photoionization by young stars, we can now measure the total ongoing Star Formation Rate (SFR), obtained from the dust- and absorption-corrected H luminosity adopting the Kennicutt (1998)’s relation for a Chabrier (2003) IMF: . Integrating the spectrum over the galaxy main body, for the spaxels with a S/N(H), we get a value of SFR=3.27 . The total SFR in the H knots is 1.70 : half of the current SFR is therefore taking place in these HII regions. This value can be considered a lower limit to the total SFR in the knots, indeed the contribution of the H flux escaped from the knots is not taken into account.
Figure 6 shows the spatial distribution of the SFR in the H knots. The SFR in all the spaxels included in each knot is summed up. The central knot has a very high value of SFR, while all the other regions are producing stars at a much lower rate ().
3.4 The stellar and gas kinematics
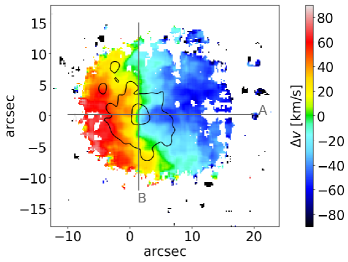
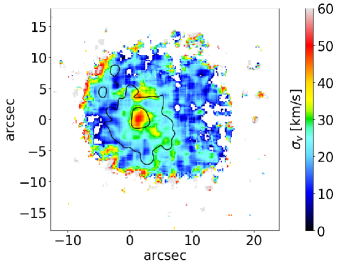
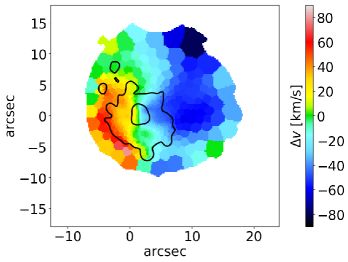
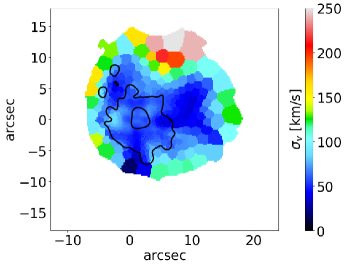
We now characterize separately the kinematics of the gas and stellar components (Fig. 7).
The kinematic properties of the gas were inferred by the analysis of the characteristics of emission lines, especially H, by exploiting the kubeviz (Fossati et al., 2016) code. In the MUSE wavelength range the typical spectral dispersion of 1.25 Å pixel-1 translates to a velocity scale of 25 km s-1 pixel-1. The average FWHM resolution is 2.51 Å, equivalently to 110 km s-1. Details on the methods can be found in Paper I.
The stellar kinematic was instead derived from the analysis of the characteristics of absorption lines, using the pPXF software (Cappellari, 2012), which works in Voronoi binned regions of given S/N (15 in this case; see Cappellari & Copin, 2012). The value of the stellar radial velocity was further smoothed using the two-dimensional local regression techniques (LOESS) as implemented in the Python code developed by M. Cappellari.222http://www-astro.physics.ox.ac.uk/~mxc/software
The velocity fields of the two components are co-rotating around the same axis, approximately the North-South direction (slit B in Fig. 7), and span a similar velocity range ().333We applied a shift in velocity of 25 to the gas to force the velocities of the two components to be the same in the galaxy center. In both cases, the West side is characterized by negative velocities, indicating that side is approaching. For the gas uncertainties are in most of the spaxels <2.5 , except in the very external regions. Uncertainties on the stellar motion are the formal errors of the fit calculated using the original noise spectrum datacube and have been normalized by the of the fit. These errors are systematically larger () than those for the gas, reflecting the quality of the fit, but still much smaller than the measured velocities, reassuring us about the robustness of our results.
In the gas, the locus of negative velocities shows a bending in the external regions, with the convexity pointing toward East.
The velocity dispersion maps highlight some differences between the two components. In the original body, the goes from to 50 , while ranges from 50 to and does not increase toward the center. In the outskirts, the velocity dispersion of the gas is always relatively low ( ), indicative of a dynamically cold medium, except on the South and East edges of the galaxy, but there the low S/N ratio of these spaxels prevents us from drawing solid conclusions. In contrast, the motion of the stars is much more random, as indicated by the stellar that reaches peaks of , in the Northern regions. Nominal errors on the dispersions are similar to uncertainties on the velocities, both for the gas and the stars.
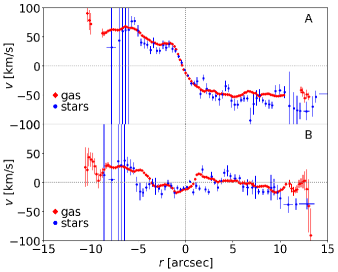
To better contrast the gas and stellar kinematics, we extract the velocity profiles (Fig. 8) along the rotation axis and its perpendicular direction (B and A in Fig. 7, respectively). We deproject the radius considering the position angle and inclination (the inferred position angle is 40, the inferred inclination is 42). We compute the average value of the spaxels entering the slit at each distance, weighted for the corresponding errors. Along the slit A, the gas presents a quite regular rotation. In the central part of the galaxy () the variation of the velocity is quite steep, and then it flattens out and the curves are almost flat. The stars follow the same trend, even though the curve is more noisy. In contrast, along the slit B, for both components the curve is always quite flat, even though with many local variations. This was expected since the slit A is approximately 90 from the rotation axis.
3.5 The spatially resolved gas properties
The gas metallicity and ionization parameter for each star forming spaxel were calculated using the pyqz Python module7 (Dopita et al., 2013) v0.8.2; the and values are obtained by interpolating from a finite set of diagnostic line ratio grids computed with the MAPPINGS code. We used a modified version of the code (F. Vogt, priv comm.) to implement the MAPPING IV grids that are calibrated in the range , which is broader than the metallicity range covered by MAPPING V grids. Our results are based on the [NII]6585 / [SII]6717+6731 vs [OIII]/[SII]6717+6731 (see Paper I). As discussed in detail by Kewley & Ellison (2008), the systematic errors introduced by modeling inaccuracies are usually estimated to be 0.1-0.15 dex, whereas discrepancies of up to 0.2 dex exist among the various calibrations based on photoionization models.
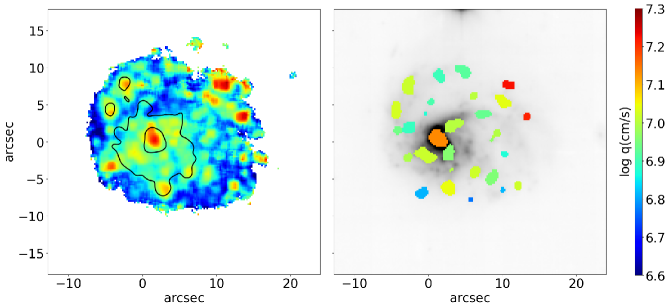
The ionization parameter is quantified as the ionizing photon flux through a unit area divided by the local number density of hydrogen atoms. The spatial distribution of the ionization parameter for P11695 is presented in Fig. 9. It is generally low, ranging from 6.67.3. This is in agreement with other galaxies in the GASP survey (\al@Poggianti2017a,Gullieuszik2017; \al@Poggianti2017a,Gullieuszik2017), even though in this case a clear clumpy pattern emerges, while in other galaxies a more smooth distribution is observed. H knots tend to have a systematically large value of q: the median value integrated across the entire galaxy is 6.8, while the median value in the H knots is 7.
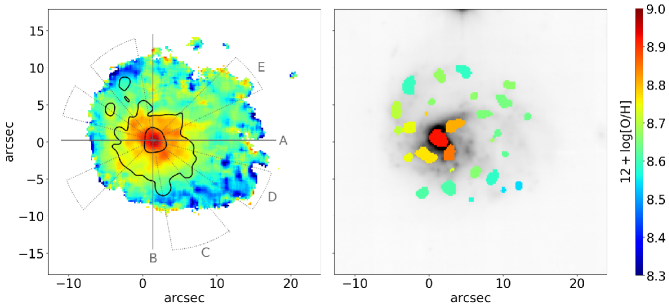
Figure 10 shows that the spatially resolved metallicity ranges between 8.39, with a median value of 8.6. The maximum of the metallicity corresponds to the maximum of the H flux. According to the Tremonti et al. (2004) mass-metallicity relation, a galaxy with mass similar to that of P11695 should have a metallicity of . However, the uncertainties in the absolute calibration of the metallicity scale (F. Vogt, priv. comm.) prevent us from drawing solid conclusions regarding the low metallicity of P11695.
The galaxy shows a sharp decrease in its metallicity from the center toward the outskirts. The metallicity distribution is inhomogeneous and it is not characterized by spherical symmetry. For example, two regions of very low metallicity stand out in the South-West and North-East side of the galaxy, while the North-West side has systematically higher metallicity values.
The metallicity in the H knots (right panel of Fig. 10) follows the trend of the entire galaxy: those in the center are more metal-rich, those in the outskirts have lower values of metallicity, especially on the South-West and North side of the galaxy.
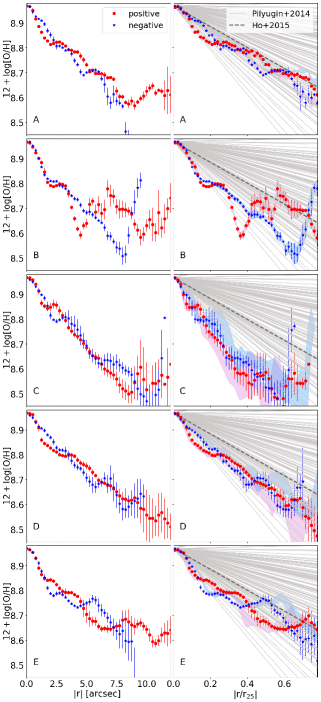
Trends between metallicity and distance from the galaxy center are more clear in Fig. 11, where metallicity gradients along different axes are shown. To start, we use the axis defined by the velocity maps (slits A and B in Figs. 7 and 10). In order to get more signal in the galaxy outskirts, instead of extracting gradients along a slit, we select all the spaxels within conic apertures wide around the slits and take the median of the metallicity as a function of distance. This choice also allows us to compute errors as standard deviation within the aperture. Along A, the gradients extracted on the two sides (East negative and West positive) of the galaxy are quite similar, except that on the West side at there is a steeper decline in the metallicity values with distance than on the other side. Trends are inverted at , where the East side is more metal poor than the West side. Along B, gradients are symmetric around the 0 position up to 5′′, then the South side shows a constant decline and a sudden increase at , while the North side of the galaxy shows some fluctuations.
Clearly, these two axes do not capture the largest variation of metallicity in the galaxy. We therefore use three additional axes (C, D, E), which are chosen ad hoc to better characterize the variations across the galaxy. The chosen apertures are shown in the left panel of Fig. 10, and are 30, 20 and 20 wide, respectively. While gradients along D are similar to those along B, the panels in the third row of Fig. 11 shows that the gradients along C are the steepest ones. The minimum metallicity is 8.4, while along A and B, for example, it is always 8.5. Finally, the E aperture catches one of the flattest gradients in the galaxy, with metallicity values > 8.6 at all distances.
To understand if these results are in some sense peculiar or are similar to those of other galaxies in the local universe, in the right panels of Fig. 11 we compare the metallicity gradients of P11695 to those tabulated by Pilyugin et al. (2014), who investigated the oxygen abundance distributions across the optical disks of 130 nearby late-type galaxies, and by Ho et al. (2015), who measured the average metallicity of 50 nearby galaxies mainly drawn from the CALIFA (Sánchez et al., 2012) survey. For all the samples, has been computed as the major axis of the isophote of surface brightness = 25 in B band and radii are deprojected considering the position angle and inclination. As P11695 has a very lopsided optical light distribution, a single scale length might not be representative of the entire galaxy. Therefore, we also compute considering separately the West side and the East side of the galaxy. In the right panels of Fig.11, while the profiles represented by the symbols are scaled using the average scale length , profiles shown in shaded areas are scaled using the most appropriate scale length: the positive sides of the profiles extracted along A, C, D and E are scaled using , the corresponding negative sides are scaled using . For the profiles along the slit B, the average scale length is adopted. As expected, the slope of the profiles depends on the adopted scale length, but the general conclusions hold. To renormalize the Pilyugin et al.; Ho et al. samples to ours, we assume that the maximum central metallicity coincide in all the samples. This normalization allows us to compare the gradients regardless of the uncertainties related to the absolute calibrations adopted by the different works. Overall, P11695 presents the steepest gradients. Differences are the largest for the trends extracted along the aperture C, the smallest for trends extracted along E. P11695 is therefore at the tail of the metallicity-radius distribution.
3.6 The integrated and spatially resolved stellar population properties
The spectral fitting code sinopsis (Paper III) allows us to characterize the spatially resolved properties of the stellar populations. Details can be found in \al@Poggianti2017a,Fritz2017; \al@Poggianti2017a,Fritz2017. Briefly, this code combines different simple stellar populations spectra to reproduce the observed equivalent widths of the main absorption and emission lines, and the continuum in various bands. The main outputs of sinopsis are maps of stellar mass, average star formation rate and total mass formed in four age bins, luminosity-weighted and mass-weighted stellar ages. In addition, it also produces a best-fit model datacube for the stellar-only component.
Running sinopsis on the galaxy integrated spectrum obtained within the galaxy main body, the total stellar mass measured is . Considering the total SFR measured in Sec. 3.3, P11695 lays on the upper envelope of the typical SFR-mass relation for star-forming field galaxies (see Poggianti et al., 2016).
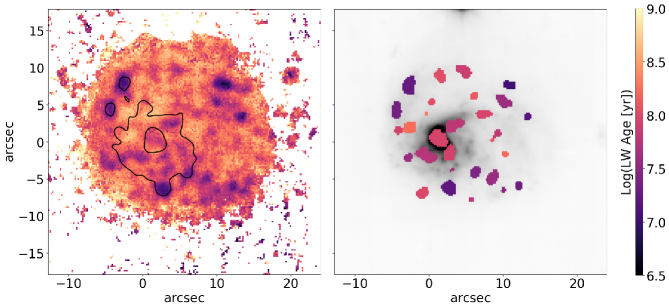
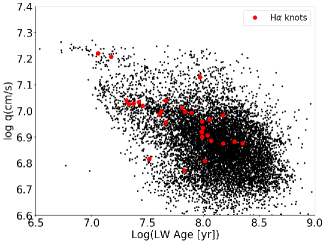
Figure 12 presents the map of the luminosity weighted age. This provides an estimate of the average age of the stars weighted by the light we actually observe, therefore giving us an indication on when the last episode of star formation occurred. The map shows that the typical luminosity weighted age of the galaxy is yr. The distribution of ages is quite homogeneous, except in some regions, where the stars are much younger ( yr). In most of the cases, these regions coincide with the H knots, even though there are some knots with older ages and some young regions not included in any knot (see the trail in the Southern part of the galaxy). Overall, the knots have an age typically less than yr. The youngest knots are located in the South-West side of the galaxy, and two very young ( yr) knots are located on the opposite side and others on the North-West side.
Comparing the luminosity weighted age and the ionization parameter (Fig. 13), we find a clear anticorrelation, both for the spaxels in the H knots and for those outside. This trend suggests that we might be able to infer the level of ionization in a galaxy given the age of its stellar population, or viceversa. Within the GASP sample, other galaxies present very different correlations. Understanding the physical meaning of this result is beyond the scope of this work and will be investigated in a following paper.
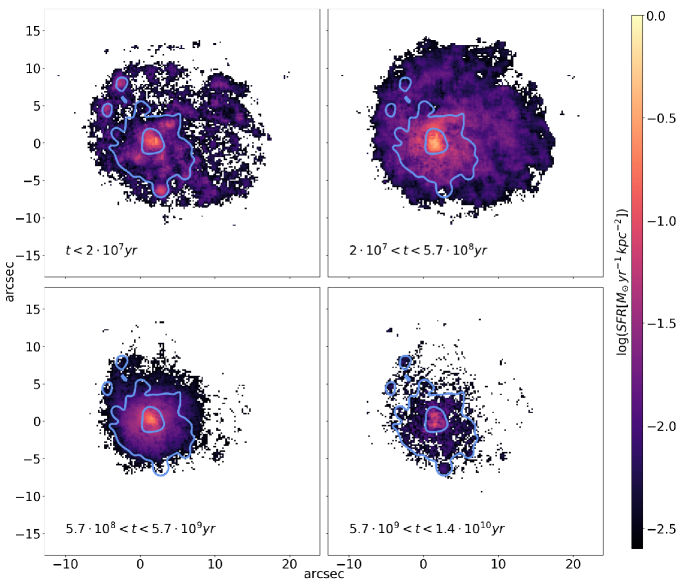
Finally, we can investigate how the SFR varied with cosmic time. We choose four logarithmically spaced age bins in such a way that the differences between the spectral characteristics of the stellar populations are maximal (Fritz et al. 2007 and Paper III).
The bottom right panel of Fig. 14 shows the SFR that took place in the oldest age bin ( yr). This is the bin we use to define the contours indicating the original body shown in all the previous figures. During this epoch, the SFR is high only within the original body, which assembled over this time. Very little SFR is found far from the galaxy core (). At this stage the galaxy does not show any sign of asymmetry. In the following age bin ( yr yr), the galaxy SFR is still mainly concentrated in the original body and the SFR in the outer region is still low. In the next age bin ( yr yr), the SFR in the galaxy boosts and the galaxy develops especially towards the West side. This is the epoch when the total SFR is the highest and the galaxy has the largest extension. The map is not smooth, suggesting the SFR is taking place in a non uniform way. Finally, in the current SFR ( yr), the core of the galaxy is still highly star forming, while in the external regions a decline in the SFR is observed. A conspicuous number of highly star forming regions are visible. Overall, they correspond to the knots seen in the H maps.
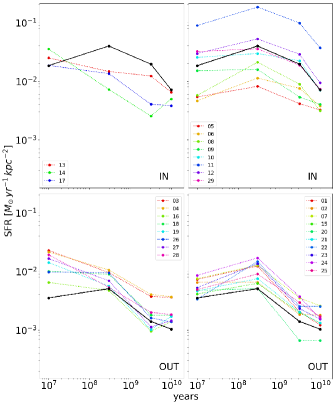
The Star Formation History (SFH), i.e. the average SFR in the four age bins, computed by summing the SFR in the spaxels, divided by the number of spaxels, is presented in Figure 15 as black lines, for both the region within and outside the original body. The trends just discussed emerge clearly: the original body developed in the earlier epochs and the galaxy was forming stars at a quite high rate already in the second oldest age bin, while the external part developed in a later phase and a strong SFR increase happened only during the last yr. Both regions peak within yr yr ago. The same Figure also shows the SFHs of each H knot separately. The SFHs of the H knots within and outside the original body follow the trends of all the spaxels in the same regions, respectively, with some exceptions. Among the H knots with rising SFR, 13, 14, and 17 (within the original body) and 16, 18, and 19 (outside) are all located in the South-West side of the galaxy. H knots 3 and 4 are instead in the opposite side: in the North-East side. Finally, H knots 26, 27 and 28 are on the Western side, in the outskirts. The last four seem to be located on the extension of the same spiral arm.
This analysis shows how H knots located at similar distances from the center but in different regions of the galaxy have a quite different history, suggesting they were born in different conditions.
4 Discussion
In this section we aim at drawing a scenario for the formation and evolution of P11695 able to explain its main characteristics illustrated in the previous sections. First, we need to characterize the environment around the galaxy, in order to shed light on the possible physical mechanisms acting on it.
4.1 The environment
| ID | Ngal | z | RA | DEC | Rvir | |
|---|---|---|---|---|---|---|
| (J2000) | (J2000) | (Mpc) | () | |||
| A | 32 | 0.04036 | 162.44151 | 0.3568 | 0.51 | 245.8 |
| B | 3 | 0.04106 | 161.76073 | -0.09061 | 0.16 | 118.1 |
| C | 5 | 0.04008 | 161.51663 | -0.3767 | 0.35 | 134.1 |
P11695 does not belong to any recognizable cluster or group: it has been selected as isolated from both our own environmental catalog (Calvi et al., 2011) and an independent catalog assembled by Argudo-Fernández et al. (2015). Paccagnella et al. (in prep) estimate that it is embedded in a halo of mass .
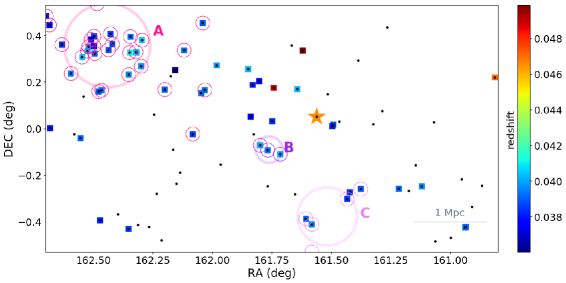
Figure 16 shows the spatial distribution of all galaxies around P11695 with measured redshift in the range . Redshifts are taken from the MGCz (Driver et al., 2005) and SDSS-DR9 (Ahn et al., 2012). The estimated spectroscopic completeness in this region of the sky is at B=20 (Liske et al., 2003; Driver et al., 2005). In agreement to Argudo-Fernández et al. (2015), the closest galaxy at the same redshift is at 2.3 Mpc. Calvi et al. (2011); Tempel et al. (2012) identified overall three groups in this area, whose position is highlighted in Fig. 16 and whose properties are listed in Tab.1. The spectroscopic galaxy sample adopted by Tempel et al. (2012) to identify the groups is complete up to the Petrosian magnitude (Strauss et al., 2002).
Their redshift difference with respect to P11695 corresponds to a relative velocity of . This difference in velocity is the velocity dispersion of the largest group. Therefore, if P11695 ever belonged to one of these groups, it should now move at an unrealistic velocity. We therefore tend to exclude that the galaxy was formed in one of the groups and was subsequently kicked out from it.
To firmly exclude the presence of massive structures around P11695, we searched for X-ray emission within 30′′ from the galaxy. ROSAT (0.1- 2.4 keV) and SWIFT (15-25keV e 25-45keV, 50-194 keV) data are available in this region of the sky, and both failed in detecting any extended structure, which could be connected to the presence of a group or cluster.
P11695 is therefore a truly isolated galaxy and the typical mechanisms usually invoked to explain the observed tails, e.g. ram pressure stripping due to the interaction between the hot and dense intragroup/cluster medium and the galaxy gas (Gunn & Gott, 1972), or tidal interactions (Byrd & Valtonen, 1990), have to be ruled out, because they generally take place in more massive or at least richer environments.
In addition, no clear sign of recent merger is visible in any part of the analysis we have conducted, and there is no visible companion. Note that even if we do not observe companions now, they might have merged with P11695 in the past. Walker et al. (1996) show that perturbations induced by a minor merger can last for 1 Gyr. However, it is not clear whether a minor merger can induce significant lopsidedness for a sufficiently long time. Walker et al. (1996) show that minor mergers can substantially heat and puff-up the disk, driving the formation of a strong bar ( = 2 mode). Their simulated galaxies are not axi-symmetric at intermediate time during the merger, but they do not look lopsided after the satellites has been completely accreted. Similarly, Bournaud et al. (2005) find that a 10:1 minor merger triggers significant lopsidedness, but this lasts typically no more than 500 Myrs.
In contrast, fly-by events can trigger lopsidedness (e.g., Mapelli et al., 2008), but at much lower level than gas accretion. Moreover, in case of a fly-by we should still see the companion close to P11695.
Hence, we need to invoke some other mechanism to explain the peculiarities of P11695.
4.2 Cold gas accretion scenario
We propose a scenario in which the galaxy is being fed by a filament of cold (T K) low metallicity gas, most probably flowing from the South West side of the galaxy. This accretion increases the availability of gas pumping up the lopsidedness of the disk, igniting the formation of giant HII regions, influencing the gas motion, the conditions of star formation and the metallicity of the galaxy.
In our observations, there are many indirect parts of evidence that are consistent with and point to the cold gas accretion scenario, as we describe in what follows.
4.2.1 Lopsidedness
P11695 is a spiral galaxy with very asymmetric features. It is lopsided and extends toward the West side much more than toward the East.
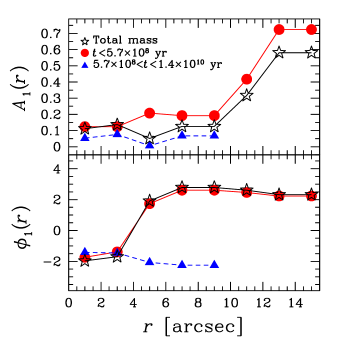
To quantify the lopsidedness in its surface density, we compute the Fourier transforms of the stellar mass surface density, obtained from sinopsis.
Following Bournaud et al. (2005), the surface density is decomposed as:
| (1) |
where the normalized strength of the Fourier component is . Thus, represents the normalized amplitude of the disk lopsidedness at a given radius. Values of indicate significant lopsidedness. The quantity denotes the position angle or the phase of the Fourier component .
Figure 17 shows the amplitude and the phase versus radius for the total stellar mass and the mass formed in two age bins ( yr and yr yr). Considering the total mass, P11695 appears to be significantly lopsided for . The phase is nearly constant for , which is typical of most lopsided galaxies (see, e.g., Rix & Zaritsky, 1995). Contrasting the curves for the two age bins, we find an increase in both the amplitude and the phase of the lopsidedness with time. This suggests that the West side of the galaxies developed in recent epoch, yr ago, in agreement with what found in Fig.14.
In principle, the asymmetric shape could be due to either accretion or a disk truncation, after a merger or due to a gas stripping. However, if the lopsidedness was due to mergers, we should also detect signs of the the remnants in our spatially resolved spectroscopy (Mapelli et al., 2008), which is not the case. As for ram pressure, the galaxy should be located in a denser medium to feel the gas stripping, while we find no observational support for this hypothesis. In contrast, no observational evidence contrasts the gas inflow.
The simulations run by Bournaud et al. (2005) show that lopsidedness can result from cosmological accretion of gas on galactic disks, which can create strongly lopsided disks when this accretion is sufficiently asymmetrical. Simulations by e.g. Brook et al. (2008); Roškar et al. (2010); Snaith et al. (2012) predict that misaligned gas structures are found to form and persist for many Gyr through the continued accretion of cold gas with misaligned angular momentum. In absence of any continuous gas fuel, in an axisymmetric potential the gas will over time relax back into one of the preferred axes, becoming exactly co- or counter-rotating with the stars (see also van de Voort et al., 2015).
This analysis therefore supports a scenario in which continuous gas accretion is feeding the galaxy inducing the growth of the West side of the galaxy. Based on the stellar population analysis, we can date the beginning of the galaxy growth due to gas accretion yr ago.
4.2.2 Velocity profiles
Jog (1997, 2002) showed that a galaxy showing spatial asymmetry would naturally show kinematical asymmetry. The two have to be casually connected in most cases. Instead, the gas and stellar components co-rotate and span the same velocity range in P11695. The gas kinematic shows a bending of the locus where velocities are negative in the external regions of the galaxy. It convexity points toward East. Nbody/hydrodynamical simulations have shown that this U-shape might be due to ram pressure stripping (Merluzzi et al., 2016), but it might also be related to galaxy interactions or gas accretion that produce lopsidedness (see, e.g., Sancisi et al., 2008, and references therein). In P11695, the bending is consistent with a scenario in which the gas is inflowing from South-West with its own velocity, and affects the gas velocity in its motion toward the center. The stellar kinematics might show a similar pattern, but this is less evident because this component is more bound than the gas, and therefore less easily disturbed.
The maps of velocity dispersions show that gas and stars have different level of turbulence. Overall, the velocity dispersion of the gas decreases from the center towards the outskirts. In contrast, the stars have a more quite motion in the core of the galaxy, but the velocity dispersion significantly increases toward the external regions. The SFH maps (Fig. 14) have shown that the galaxy outskirts have formed in a recent epoch and the motion of the newly formed stars might be influenced by the relative velocity and inclination of the inflowing gas.
4.2.3 Metallicity gradients
P11695 has a generally low metallicity and a strong metallicity gradient. Compared to other gradients of late-type galaxies in the local universe (Pilyugin et al., 2014; Ho et al., 2015), P11695 has one of the steepest ones. Overall, the metallicity is higher in the core, in the North-West and South-East sides of the galaxy, while it is significantly lower in the South-West and North-East sides.
Mapelli et al. (2008); Oppenheimer et al. (2010); Ma et al. (2016) suggest that strong metallicity gradients might support the cold gas accretion scenario: when particularly low metallicity gas is detected in a galaxy halo it is often claimed to be the accretion of the IGM filaments, because the pristine gas accreted through filaments is expected to be characterized by a lower metallicity than that of the target galaxy (see also Crighton et al., 2013; Lehner et al., 2013; Cooper et al., 2015, for higher results).
Köppen & Hensler (2005) investigate the chemical evolution of galaxies that undergo an episode of massive and rapid accretion of metal-poor gas with models using both simplified and detailed nucleosynthesis recipes. Focusing on the effect of gas accretion on metallicity gradients in the last 2 Gyr, they find that during the infall, the oxygen abundance is decreased due to dilution of the galactic gas, followed after the infall by the evolution towards the closed-box relation. The large excursions in the gradient is reproduced if the mass of the infall is much larger than the mass of the gas present in the galaxy and the infall is greater than the SFR.
Radial metallicity gradients are instead expected to flatten once previously-ejected gas begins to re-accrete. This is because metals that form and are ejected in a galaxy’s core are mixed by the halo and re-distributed to large radii. We should therefore be able to exclude a recycle of gas in P11695.
In principle, we could expect the region where the gas is inflowing to be much more metal poor than the rest of the galaxy, with the result of having much more asymmetric gradients on the different sides of a same slit. This is true if the low metallicity gas is able to form stars before having traveled across the galaxy and mixing up with the existing gas. We can therefore estimate the time a particle would need to complete an orbit around the galaxy. As a first approximation, the orbital period is with radius of the galaxy, and rotation velocity. From Fig.8 we obtain for 2.7 kpc. We adopt as inclination deg. The orbital period results to be for kpc, for kpc. As in the North-East side of the galaxy we do not observe strong metallicity gradients, the orbital periods suggest that the gas did not have the time yet to complete an entire orbit and influence the metallicity of all new born stars, and therefore accreted in a later epoch. We only measure relatively low metallicity in the South-West and North-East sides of the galaxy. The former is the region where we hypothesize the gas is inflowing, i.e along the probable major axis of the original body of the galaxy.
4.2.4 H knots
Another peculiarity of P11695 is the presence of many H knots. They are all on the main body and present elongated shapes.
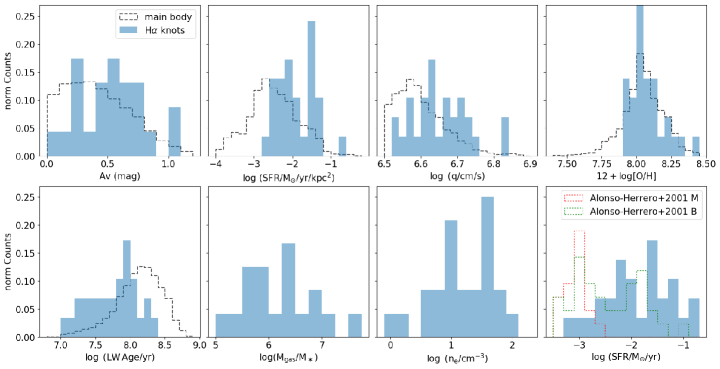
Figure 18 shows the distribution of the properties in the knots compared to those in the main body. Median values obtained by considering all the spaxels within each H knot agree with those obtained from the spectra integrated over the knots. Overall, the knots are dustier, have higher SFR values, younger ages, higher ionization parameters than the rest of the galaxy, and similar metallicity. A gradient in the properties of the knots, going from North East to South West, might be detected in all the properties, with the exception of the 2 more external knots in the North West area. Half of the current SFR is taking place in the H knots, which are therefore an important hotbed of new stars. In the last panel of Fig. 18, we overplot the SFR distribution of HII regions of a sample of 52 nearby galaxies, studied by Alonso-Herrero & Knapen (2001). These authors provide the brightest, the median and the faintest H luminosities of the circumnuclear HII regions. We converted their luminosities to SFRs and find that indeed the H knots in P11695 are systematically larger than both the typical and brightest HII regions in other galaxies.
Considering the SFH of the H knots, we find that most of them follow the trend of the entire galaxy, except for the H knots located in the South-West region. They have all rising SFHs, suggesting that a large amount of fuel for star formation is available in this region of P11695.
Even though clumpy galaxies in the local universe are not as common as at higher redshift (e.g., Genzel et al., 2006; Agertz et al., 2009; Elmegreen et al., 2007), samples at redshifts similar to that of P11695 have been studied e.g. by Smith et al. (2001); Garland et al. (2015). Overall, the continuous appearance of clump-cluster galaxies throughout a wide range of redshifts means that disk galaxies start forming over an extended period of time.
We are not able to state whether the knots we observe are the first knots formed in the galaxy or if their are a nth generation of knots. For example, Elmegreen et al. (2007) claim that the clump- cluster phase lasts for 0.5-1 Gyr and occurs only once during the life of a galaxy, unless there is a significant accretion event later. In contrast, simulations by Noguchi (1999) do not exclude the possibility that new generations of knots are easily formed.
The explanation for the existence of these knots is that when a disk becomes sufficiently massive through accretion (through cold gas inflow in our case), giant clumps form at the local Jeans mass by gravitational instabilities. This induces a disk fragmentation, without destroying the disk. The mass of the clumps therefore depends on the turbulent Jeans mass. As turbulent speeds decrease relative to the rotation speed, clump masses decrease relative to the galaxy mass; then their interactions and migrations toward the bulge become less severe.
As described in detail in Paper I, we can compute the gas mass of each star forming region from the H luminosity (Boselli et al., 2016), after having estimated the electron density. To do that, we follow the relation presented in Proxauf et al. (2014) that is based on the R =[SII]6717/[SII]6737 line ratio and is valid in the range 0.4 < R < 1.435. 24 out of 29 knots have a [SII]6716/[SII]6732 ratio in the range where the density calibration applies, while the others have ratio values larger than 1.44, which suggests that their density is below 10 cm-3. The distribution of their ionized gas densities is shown in Fig. 18. Most of the measured densities are between 3 and 100 cm-3, with a median of 19 cm-3. The derived ionized gas mass distribution is also shown in Fig. 18. Most of the knots have masses in the range , with a median of 7.9. Summing up the gas mass in these knots we obtain . This value has to be taken as lower limit to the total ionized gas mass, given that the contributions of the knots with no density estimate and of the diffuse line emission are not taken into account.
Note that if major interactions were occurring, the resulting galaxy would likely include a highly concentrated central starburst, not smaller clumps of star formation spread throughout.
4.2.5 Star forming properties
The typical luminosity weighted age of P11695 is yr, but the galaxy is characterized by a large number of much younger regions ( yr). In particular, Figure 12 suggests the existence of a trail of very young stars starting from the South-West side, extending toward East and continuing on the North side toward West. It is tempting to interpret this as the path of new gas inflowing and then orbiting around the original body of the galaxy.
The analysis of the SFHs showed that at the early stage of its formation, P11695 probably was a much more symmetric object. The lopsidedness seems to have started to develop at later times, especially in the second youngest bin. The measurement of the amplitude of the lopsidedness confirms this finding. In the youngest age bin the SFR is declining, and the outskirts of the galaxies form stars at a lower level. Also these findings are consistent with a scenario according to which after its formation, P11695 has been fed by a gas inflow, leading to a more massive extension of the galaxy on the West side. The decrease in star formation observed today might suggest that currently the gas flow is feeding the galaxy at a lower rate.
4.3 Final remarks
P11695 has been observed by the ALFALFA survey (Giovanelli et al., 2005).444The galaxy is not in the publicly released ALFALFA catalog, since its S/N is below the adopted limit (S/N¿6). Given the low resolution of the observations, we can not characterize the lopsidedness, but we can obtain an estimates of its HI mass, which can be considered as the raw fuel for star formation and a lower limit of the accreted gas mass, as a large fraction of it has already formed stars. The inferred is (D. Stark, priv. comm.), entailing a . Comparing its position on the vs. plane to that of galaxies at drawn from the RESOLVE survey (Stark et al., 2016), we find it lays on the upper envelope of the relation (see also Putman, 2017), suggesting its ratio is higher than the typical one for galaxies with similar stellar mass. P11695 has therefore still a large reservoir of unprocessed gas.
Considering the SFR of the galaxy (3.27 ), the star formation efficiency () turns out to be 0.31 , which gives us a time scale of the gas consumption. Bournaud et al. (2005) simulate accretion rates of the order to for 2 Gyr (see also van de Voort & Schaye, 2012), yielding a total accretes mass of , i.e. the same order of magnitude as our estimates. For comparisons, in the Milky Way, gas that is clearly infalling is observed at 1-15 kpc above the disk. The actual rate of accretion depends on the 3D motions of the gas and the full extent of the accreting layer, but the rates calculated are for the coldest gas (Putman et al., 2012), and closer to when the ionized gas is included (Lehner & Howk, 2011). In M33, a direct detection of gas accretion yields an accretion rate obtained . This amount is relatively large for this small galaxy, and may be further evidence for the infall of fuel being intermittent in nature (Zheng et al., 2017).
Taking into account the adopted inclination of P11695, we can suppose an U-shaped warp for the galaxy visible in the most external regions. The possible presence of the warp could be indicated also by the fact that the velocity field indicates a change of the apparent major axis from the inner to the outer region of the galaxy. This velocity distribution can be represented by annular rings in circular motion, progressively more inclined at larger radii (van der Kruit & Allen, 1978). Sancisi (1976); Binney (1992) have emphasized that warps occur in apparently isolated galaxies. They conclude that if the generator of the warps is invisible, this could be outer gas accretion (see also López-Corredoira et al., 2002; Bournaud et al., 2005; Kamphuis et al., 2013, for more recent results), consistent with our general interpretation.
Reichard et al. (2009) connected the lopsidedness of 25,000 star-forming galaxies from SDSS to metallicity. They found that at a fixed mass, the more metal-poor galaxies turn out to be more lopsided, extending the morphology-metallicity relation to the full population of star-forming galaxies. This result might explain why P11695 lay off the Tremonti et al. (2004)’s mass metallicity relation. Reichard et al. (2009) interpret their result in the context of a gas accretion triggering scenario. Indeed, the accreted gas is metal-poor (e.g., Dekel et al., 2009; van de Voort & Schaye, 2012), and induces off-center giant star-forming clumps that gradually migrate toward the disk centers (Ceverino et al., 2010; Mandelker et al., 2014). The giant star-forming clumps may be born in-situ (if the accreted gas builds up the gas reservoir in the disk to a point where disk instabilities set in and trigger star formation) or ex-situ (if already formed clumps are incorporated into the disk). In both cases, a significant part of the star formation in the disks occurs in these giant clumps. As a result of the whole process, the gas accretion produces bright off-center starbursts increasing the lopsidedness of the host disk. This explanation suits also our observational results.
Unfortunately, we are not able to get direct observations of this gas flow. As discussed e.g. by Rubin (2016), an unequivocal evidence of gas flow toward a source is the detection of absorption lines in a galaxy’s spectrum which shows a velocity shift with respect to its rest frame. The continuum spectrum can be either a higher redshift background source or the host galaxy itself. This technique is sensitive to the inflow of material over a broad range of densities and temperatures. Even though we found a high redshift () galaxy in the MUSE FoV, NW from P11695, its flux is too weak to detect any possible sign of absorption by the gas inflow.
5 Summary and conclusions
GASP (GAs Stripping phenomena in galaxies with MUSE) is an ongoing ESO Large Program with the MUSE/VLT to study the causes and the effects of gas removal processes in galaxies in different environments. Within the sample, we identified a galaxy that is likely undergoing accretion through a cold gas filament coming from the South-West side of the galaxy. In this paper we analyze its spatially resolved properties that indirectly support this scenario.
P11695 is an isolated spiral galaxy at showing a marked lopsidedness in the light distribution. Such lopsidedness developed yr ago. The gas and the stars are co-rotating around the same axis, but the velocity field of the gas bends in the outskirts, as if new gas has been infalling with a different orientation and velocity.
P11695 presents steep metallicity gradients, as expected from simulations when cold accretion of low metallicity gas is occurring (e.g., Mapelli et al., 2008). P11695 has low levels of dust (mag), a low ionization parameter value ( 6.8) and quite young luminosity weighted age (). Both the luminosity weighted age and parameter of ionization maps are very patchy, and we found a close correspondence between the two. A trail of very young stars () visible across the galaxy might trace the path of the new gas. Another important characteristic is the presence of 29 elongated H knots on the galaxy disk. These knots have systematically lower metallicity, younger ages, higher ionization parameters than the rest of the galaxy.
Finally, it is worth stressing again that this galaxy was selected for showing signs that could be indicative of stripping, therefore it emerges that in optical images gas stripping and gas accretion can present similar features. Within the GASP sample, we recently detected other galaxies not belonging to any structure whose properties might resemble those of P11695. In a following paper we will characterize this whole sample, in order to state whether all isolated galaxies that present signatures suggestive of gas stripping are on the contrary still accreting gas.
References
- Agertz et al. (2009) Agertz, O., Teyssier, R., & Moore, B. 2009, MNRAS, 397, L64
- Ahn et al. (2012) Ahn, C. P., Alexandroff, R., Allende Prieto, C., et al. 2012, ApJS, 203, 21
- Alonso-Herrero & Knapen (2001) Alonso-Herrero, A., & Knapen, J. H. 2001, AJ, 122, 1350
- Angiras et al. (2007) Angiras, R. A., Jog, C. J., Dwarakanath, K. S., & Verheijen, M. A. W. 2007, MNRAS, 378, 276
- Ann & Park (2006) Ann, H. B., & Park, J.-C. 2006, New A, 11, 293
- Argudo-Fernández et al. (2015) Argudo-Fernández, M., Verley, S., Bergond, G., et al. 2015, A&A, 578, A110
- Baldwin et al. (1980) Baldwin, J. E., Lynden-Bell, D., & Sancisi, R. 1980, MNRAS, 193, 313
- Battaner et al. (1990) Battaner, E., Florido, E., & Sanchez-Saavedra, M. L. 1990, A&A, 236, 1
- Beale & Davies (1969) Beale, J. S., & Davies, R. D. 1969, Nature, 221, 531
- Binney (1992) Binney, J. 1992, ARA&A, 30, 51
- Block et al. (1994) Block, D. L., Bertin, G., Stockton, A., et al. 1994, A&A, 288, 365
- Boselli et al. (2016) Boselli, A., Cuillandre, J. C., Fossati, M., et al. 2016, A&A, 587, A68
- Bosma (1981) Bosma, A. 1981, AJ, 86, 1791
- Bottema (1995) Bottema, R. 1995, A&A, 295, 605
- Bournaud et al. (2005) Bournaud, F., Combes, F., Jog, C. J., & Puerari, I. 2005, A&A, 438, 507
- Briggs (1990) Briggs, F. H. 1990, ApJ, 352, 15
- Brook et al. (2008) Brook, C. B., Governato, F., Quinn, T., et al. 2008, ApJ, 689, 678
- Brooks et al. (2009) Brooks, A. M., Governato, F., Quinn, T., Brook, C. B., & Wadsley, J. 2009, ApJ, 694, 396
- Bundy et al. (2015) Bundy, K., Bershady, M. A., Law, D. R., et al. 2015, ApJ, 798, 7
- Byrd & Valtonen (1990) Byrd, G., & Valtonen, M. 1990, ApJ, 350, 89
- Calvi et al. (2011) Calvi, R., Poggianti, B. M., & Vulcani, B. 2011, MNRAS, 416, 727
- Cappellari (2012) Cappellari, M. 2012, pPXF: Penalized Pixel-Fitting stellar kinematics extraction, Astrophysics Source Code Library, ascl:1210.002
- Cappellari & Copin (2012) Cappellari, M., & Copin, Y. 2012, Voronoi binning method, Astrophysics Source Code Library, ascl:1211.006
- Cardelli et al. (1989) Cardelli, J. A., Clayton, G. C., & Mathis, J. S. 1989, ApJ, 345, 245
- Ceverino et al. (2010) Ceverino, D., Dekel, A., & Bournaud, F. 2010, MNRAS, 404, 2151
- Chabrier (2003) Chabrier, G. 2003, PASP, 115, 763
- Combes et al. (2004) Combes, F., Boisse, P., Mazure, A., & Blanchard, A. 2004
- Cooper et al. (2015) Cooper, T. J., Simcoe, R. A., Cooksey, K. L., O’Meara, J. M., & Torrey, P. 2015, ApJ, 812, 58
- Cresci et al. (2010) Cresci, G., Mannucci, F., Maiolino, R., et al. 2010, Nature, 467, 811
- Crighton et al. (2013) Crighton, N. H. M., Hennawi, J. F., & Prochaska, J. X. 2013, ApJ, 776, L18
- Croom et al. (2012) Croom, S. M., Lawrence, J. S., Bland-Hawthorn, J., et al. 2012, MNRAS, 421, 872
- Dekel & Birnboim (2006) Dekel, A., & Birnboim, Y. 2006, MNRAS, 368, 2
- Dekel et al. (2009) Dekel, A., Birnboim, Y., Engel, G., et al. 2009, Nature, 457, 451
- Dopita et al. (2013) Dopita, M. A., Sutherland, R. S., Nicholls, D. C., Kewley, L. J., & Vogt, F. P. A. 2013, ApJS, 208, 10
- Driver et al. (2005) Driver, S. P., Liske, J., Cross, N. J. G., De Propris, R., & Allen, P. D. 2005, MNRAS, 360, 81
- Dubinski & Kuijken (1995) Dubinski, J., & Kuijken, K. 1995, ApJ, 442, 492
- Elmegreen et al. (2007) Elmegreen, D. M., Elmegreen, B. G., Ravindranath, S., & Coe, D. A. 2007, ApJ, 658, 763
- Fasano et al. (2006) Fasano, G., Marmo, C., Varela, J., et al. 2006, A&A, 445, 805
- Faucher-Giguere (2011) Faucher-Giguere, C.-A. 2011, in Bulletin of the American Astronomical Society, Vol. 43, American Astronomical Society Meeting Abstracts #218, 119.03
- Faucher-Giguère et al. (2011) Faucher-Giguère, C.-A., Kereš, D., & Ma, C.-P. 2011, MNRAS, 417, 2982
- Fossati et al. (2016) Fossati, M., Fumagalli, M., Boselli, A., et al. 2016, MNRAS, 455, 2028
- Fritz et al. (2007) Fritz, J., Poggianti, B. M., Bettoni, D., et al. 2007, A&A, 470, 137
- Fritz et al. (2017) Fritz, J., Moretti, A., Poggianti, B., et al. 2017, ArXiv e-prints, arXiv:1704.05088
- Garland et al. (2015) Garland, C. A., Pisano, D. J., Mac Low, M.-M., et al. 2015, ApJ, 807, 134
- Genel et al. (2012) Genel, S., Dekel, A., & Cacciato, M. 2012, MNRAS, 425, 788
- Genzel et al. (2006) Genzel, R., Tacconi, L. J., Eisenhauer, F., et al. 2006, Nature, 442, 786
- Giovanelli et al. (2005) Giovanelli, R., Haynes, M. P., Kent, B. R., et al. 2005, AJ, 130, 2598
- Gullieuszik et al. (2015) Gullieuszik, M., Poggianti, B., Fasano, G., et al. 2015, A&A, 581, A41
- Gullieuszik et al. (2017) Gullieuszik, M., Poggianti, B. M., Moretti, A., et al. 2017, ApJ, 846, 27
- Gunn & Gott (1972) Gunn, J. E., & Gott, III, J. R. 1972, ApJ, 176, 1
- Haynes et al. (1998) Haynes, M. P., van Zee, L., Hogg, D. E., Roberts, M. S., & Maddalena, R. J. 1998, AJ, 115, 62
- Ho et al. (2015) Ho, I.-T., Kudritzki, R.-P., Kewley, L. J., et al. 2015, MNRAS, 448, 2030
- Hobbs et al. (2015) Hobbs, A., Read, J., & Nicola, A. 2015, MNRAS, 452, 3593
- Huang & Carlberg (1997) Huang, S., & Carlberg, R. G. 1997, ApJ, 480, 503
- Ideta (2002) Ideta, M. 2002, ApJ, 568, 190
- Jog (1997) Jog, C. J. 1997, ApJ, 488, 642
- Jog (2002) —. 2002, A&A, 391, 471
- Jog & Combes (2009) Jog, C. J., & Combes, F. 2009, Phys. Rep., 471, 75
- Junqueira & Combes (1996) Junqueira, S., & Combes, F. 1996, A&A, 312, 703
- Kamphuis et al. (2013) Kamphuis, P., Rand, R. J., Józsa, G. I. G., et al. 2013, MNRAS, 434, 2069
- Kauffmann et al. (2003) Kauffmann, G., Heckman, T. M., Tremonti, C., et al. 2003, MNRAS, 346, 1055
- Kennicutt (1998) Kennicutt, Jr., R. C. 1998, ARA&A, 36, 189
- Kereš et al. (2005) Kereš, D., Katz, N., Weinberg, D. H., & Davé, R. 2005, MNRAS, 363, 2
- Kewley & Ellison (2008) Kewley, L. J., & Ellison, S. L. 2008, ApJ, 681, 1183
- Kewley et al. (2006) Kewley, L. J., Groves, B., Kauffmann, G., & Heckman, T. 2006, MNRAS, 372, 961
- Kewley et al. (2001) Kewley, L. J., Heisler, C. A., Dopita, M. A., & Lumsden, S. 2001, ApJS, 132, 37
- Kim et al. (2014) Kim, J. H., Peirani, S., Kim, S., et al. 2014, ApJ, 789, 90
- Köppen & Hensler (2005) Köppen, J., & Hensler, G. 2005, A&A, 434, 531
- Kuijken & Garcia-Ruiz (2001) Kuijken, K., & Garcia-Ruiz, I. 2001, in Astronomical Society of the Pacific Conference Series, Vol. 230, Galaxy Disks and Disk Galaxies, ed. J. G. Funes & E. M. Corsini, 401
- Lehner & Howk (2011) Lehner, N., & Howk, J. C. 2011, Science, 334, 955
- Lehner et al. (2013) Lehner, N., Howk, J. C., Tripp, T. M., et al. 2013, ApJ, 770, 138
- Levine & Sparke (1998) Levine, S. E., & Sparke, L. S. 1998, ApJ, 496, L13
- Liske et al. (2003) Liske, J., Lemon, D. J., Driver, S. P., Cross, N. J. G., & Couch, W. J. 2003, MNRAS, 344, 307
- López-Corredoira et al. (2002) López-Corredoira, M., Betancort-Rijo, J., & Beckman, J. E. 2002, A&A, 386, 169
- Ma et al. (2016) Ma, X., Hopkins, P. F., Faucher-Giguère, C.-A., et al. 2016, MNRAS, 456, 2140
- Mandelker et al. (2014) Mandelker, N., Dekel, A., Ceverino, D., et al. 2014, MNRAS, 443, 3675
- Mapelli et al. (2008) Mapelli, M., Moore, B., & Bland-Hawthorn, J. 2008, MNRAS, 388, 697
- Matthews et al. (1998) Matthews, L. D., van Driel, W., & Gallagher, III, J. S. 1998, AJ, 116, 2196
- Merluzzi et al. (2016) Merluzzi, P., Busarello, G., Dopita, M. A., et al. 2016, MNRAS, 460, 3345
- Mihalas & Binney (1981) Mihalas, D., & Binney, J. 1981, Science, 214, 829
- Moustakas et al. (2010) Moustakas, J., Kennicutt, Jr., R. C., Tremonti, C. A., et al. 2010, ApJS, 190, 233
- Nelson et al. (2016) Nelson, D., Genel, S., Pillepich, A., et al. 2016, MNRAS, 460, 2881
- Nelson et al. (2013) Nelson, D., Vogelsberger, M., Genel, S., et al. 2013, MNRAS, 429, 3353
- Nishiura et al. (2000) Nishiura, S., Shimada, M., Ohyama, Y., Murayama, T., & Taniguchi, Y. 2000, AJ, 120, 1691
- Noeske et al. (2007) Noeske, K. G., Faber, S. M., Weiner, B. J., et al. 2007, ApJ, 660, L47
- Noguchi (1999) Noguchi, M. 1999, Advances in Space Research, 23, 1121
- Noordermeer et al. (2001) Noordermeer, E., Sparke, L. S., & Levine, S. E. 2001, MNRAS, 328, 1064
- Ocvirk et al. (2008) Ocvirk, P., Pichon, C., & Teyssier, R. 2008, MNRAS, 390, 1326
- Oppenheimer et al. (2010) Oppenheimer, B. D., Davé, R., Kereš, D., et al. 2010, MNRAS, 406, 2325
- Pilyugin et al. (2014) Pilyugin, L. S., Grebel, E. K., & Kniazev, A. Y. 2014, AJ, 147, 131
- Poggianti et al. (2016) Poggianti, B. M., Fasano, G., Omizzolo, A., et al. 2016, AJ, 151, 78
- Poggianti et al. (2017) Poggianti, B. M., Moretti, A., Gullieuszik, M., et al. 2017, ApJ, 844, 48
- Proxauf et al. (2014) Proxauf, B., Öttl, S., & Kimeswenger, S. 2014, A&A, 561, A10
- Putman (2017) Putman, M. E. 2017, in Astrophysics and Space Science Library, Vol. 430, Astrophysics and Space Science Library, ed. A. Fox & R. Davé, 1
- Putman et al. (2012) Putman, M. E., Peek, J. E. G., & Joung, M. R. 2012, ARA&A, 50, 491
- Reichard et al. (2009) Reichard, T. A., Heckman, T. M., Rudnick, G., et al. 2009, ApJ, 691, 1005
- Reshetnikov & Combes (1998) Reshetnikov, V., & Combes, F. 1998, A&A, 337, 9
- Revaz & Pfenniger (2001) Revaz, Y., & Pfenniger, D. 2001, in Astronomical Society of the Pacific Conference Series, Vol. 240, Gas and Galaxy Evolution, ed. J. E. Hibbard, M. Rupen, & J. H. van Gorkom, 278
- Richter & Sancisi (1994) Richter, O.-G., & Sancisi, R. 1994, A&A, 290
- Rix & Zaritsky (1995) Rix, H.-W., & Zaritsky, D. 1995, ApJ, 447, 82
- Roškar et al. (2010) Roškar, R., Debattista, V. P., Brooks, A. M., et al. 2010, MNRAS, 408, 783
- Rubin (2016) Rubin, K. H. R. 2016, ArXiv e-prints, arXiv:1612.00805
- Rubin et al. (1991) Rubin, V. C., Hunter, D. A., & Ford, Jr., W. K. 1991, ApJS, 76, 153
- Rubin et al. (1999) Rubin, V. C., Waterman, A. H., & Kenney, J. D. P. 1999, AJ, 118, 236
- Rupke et al. (2010) Rupke, D. S. N., Kewley, L. J., & Chien, L.-H. 2010, ApJ, 723, 1255
- Sánchez et al. (2012) Sánchez, S. F., Kennicutt, R. C., Gil de Paz, A., et al. 2012, A&A, 538, A8
- Sánchez et al. (2014) Sánchez, S. F., Rosales-Ortega, F. F., Iglesias-Páramo, J., et al. 2014, A&A, 563, A49
- Sanchez-Saavedra et al. (1990) Sanchez-Saavedra, M. L., Battaner, E., & Florido, E. 1990, MNRAS, 246, 458
- Sancisi (1976) Sancisi, R. 1976, A&A, 53, 159
- Sancisi et al. (2008) Sancisi, R., Fraternali, F., Oosterloo, T., & van der Hulst, T. 2008, A&A Rev., 15, 189
- Schoenmakers et al. (1997) Schoenmakers, R. H. M., Franx, M., & de Zeeuw, P. T. 1997, MNRAS, 292, 349
- Schwarzkopf & Dettmar (2001) Schwarzkopf, U., & Dettmar, R.-J. 2001, A&A, 373, 402
- Sellwood (2013) Sellwood, J. A. 2013, Dynamics of Disks and Warps, ed. T. D. Oswalt & G. Gilmore, 923
- Semelin & Combes (2005) Semelin, B., & Combes, F. 2005, A&A, 441, 55
- Sharp & Bland-Hawthorn (2010) Sharp, R. G., & Bland-Hawthorn, J. 2010, ApJ, 711, 818
- Silk & Mamon (2012) Silk, J., & Mamon, G. A. 2012, Research in Astronomy and Astrophysics, 12, 917
- Smith et al. (2001) Smith, A. M., Collins, N. R., Waller, W. H., et al. 2001, ApJ, 546, 829
- Snaith et al. (2012) Snaith, O. N., Gibson, B. K., Brook, C. B., et al. 2012, MNRAS, 425, 1967
- Sofue & Rubin (2001) Sofue, Y., & Rubin, V. 2001, ARA&A, 39, 137
- Sparke & Casertano (1988) Sparke, L. S., & Casertano, S. 1988, MNRAS, 234, 873
- Springel (2010) Springel, V. 2010, MNRAS, 401, 791
- Stark et al. (2016) Stark, D. V., Kannappan, S. J., Eckert, K. D., et al. 2016, ApJ, 832, 126
- Strauss et al. (2002) Strauss, M. A., Weinberg, D. H., Lupton, R. H., et al. 2002, AJ, 124, 1810
- Swaters et al. (1999) Swaters, R. A., Schoenmakers, R. H. M., Sancisi, R., & van Albada, T. S. 1999, MNRAS, 304, 330
- Tempel et al. (2012) Tempel, E., Tago, E., & Liivamägi, L. J. 2012, A&A, 540, A106
- Toomre (1983) Toomre, A. 1983, in IAU Symposium, Vol. 100, Internal Kinematics and Dynamics of Galaxies, ed. E. Athanassoula, 177
- Torrey et al. (2012) Torrey, P., Vogelsberger, M., Sijacki, D., Springel, V., & Hernquist, L. 2012, MNRAS, 427, 2224
- Tremonti et al. (2004) Tremonti, C. A., Heckman, T. M., Kauffmann, G., et al. 2004, ApJ, 613, 898
- van de Voort et al. (2015) van de Voort, F., Davis, T. A., Kereš, D., et al. 2015, MNRAS, 451, 3269
- van de Voort & Schaye (2012) van de Voort, F., & Schaye, J. 2012, MNRAS, 423, 2991
- van de Voort et al. (2011) van de Voort, F., Schaye, J., Booth, C. M., Haas, M. R., & Dalla Vecchia, C. 2011, MNRAS, 414, 2458
- van der Kruit (2007) van der Kruit, P. C. 2007, A&A, 466, 883
- van der Kruit & Allen (1978) van der Kruit, P. C., & Allen, R. J. 1978, ARA&A, 16, 103
- Véron-Cetty & Véron (2003) Véron-Cetty, M.-P., & Véron, P. 2003, A&A, 412, 399
- Véron-Cetty & Véron (2006) —. 2006, A&A, 455, 773
- Walker et al. (1996) Walker, I. R., Mihos, J. C., & Hernquist, L. 1996, ApJ, 460, 121
- Weinberg (1995) Weinberg, M. D. 1995, ApJ, 455, L31
- Wilcots & Prescott (2004) Wilcots, E. M., & Prescott, M. K. M. 2004, AJ, 127, 1900
- Young et al. (2006) Young, L. M., Rosolowsky, E., van Gorkom, J. H., & Lamb, S. A. 2006, ApJ, 650, 166
- Zaritsky et al. (1994) Zaritsky, D., Kennicutt, Jr., R. C., & Huchra, J. P. 1994, ApJ, 420, 87
- Zaritsky & Rix (1997) Zaritsky, D., & Rix, H.-W. 1997, ApJ, 477, 118
- Zheng et al. (2017) Zheng, Y., Peek, J. E. G., Werk, J. K., & Putman, M. E. 2017, ApJ, 834, 179