NGC 4051: Black hole mass and photon index-mass accretion rate correlation
We present a discovery of the correlation between the X-ray spectral (photon) index and mass accretion rate observed in an active galactic nucleus, NGC 4051. We analyzed spectral transition episodes observed in NGC 4051 using XMM/Newton, Suzaku and RXTE. We applied a scaling technique for a black hole (BH) mass evaluation which uses a correlation between the photon index and normalization of the seed (disk) component, which is proportional to a mass accretion rate. We developed an analytical model that shows the spectral (photon) index of the BH emergent spectrum undergoes an evolution from lower to higher values depending on a mass accretion rate in the accretion disk. We considered Cygnus X-1 and GRO J1550-564 as reference sources for which distances, inclination angles and the BH masses are evaluated by dynamical measurements. Application of the scaling technique for the photon indexmass accretion rate correlation provides an estimate of the black hole mass in NGC 4051 to be more than solar masses.
Key Words.:
accretion, accretion disks—black hole physics—stars:individual (Cygnus X-1), individual (GRO J1550–564), individual (NGC 4051):radiation mechanisms: nonthermal—physical data and processes1 Introduction
Determination of masses of Galactic black holes (BHs) is one of the most important tasks in modern astronomy. There are two methods for BH mass determination. One relies on determination of the mass function using optical observations. While the theoretical mass function is a function of the two masses and the inclination angle, the value of the observationally inferred mass function (the minimum possible mass of the compact object) depends only on the velocity half-amplitude K and the orbital period and is independent of the inclination angle . Orosz (2003) summarized the measurements of the rotational velocities and inclinations for 17 BH binaries.
However, this mass function method cannot be applied to active galactic nuclei (AGN) and for this case the second method of BH mass estimate using the photon index-mass accretion rate correlation [see Shaposhnikov & Titarchuk (2009), hereafter ST09] is potentially more promising because it applies only information on X-ray spectral characteristics of a compact object. It is worthwhile to point out that an evolution of the photon index for super-massive BH sources (AGN) was not systematically analyzed while the presence of fast evolution of X-ray spectral shape similar to one observed in a number of galactic BHs was reported also for AGNs [see Vaughan et al. (2011)]. In this paper we present a detailed analysis of X-ray spectral evolution in the AGN NGC 4051 and its application for a BH mass estimate.
Observational appearances of BHs in Galactic sources is conventionally described in terms of the BH spectral state classification (see Remillard & McClintock, 2006; Belloni, 2005; Klein-Wolt & van der Klis, 2008, for different flavors of BH states definitions). A general BH state classification for five major BH states: quiescent, low-hard (LHS), intermediate (IS), high-soft (HSS) and very high states (VHS) is accepted by the community. When a BH transient goes into outburst it leaves the quiescent state and enters the LHS, a low luminosity state with the energy spectrum dominated by the thermal Comptonization component related to a weak thermal component. The photon spectrum in the LHS is presumably a result of the Comptonization (upscattering) of soft photons, that originated in a relatively weak inner part of the accretion disk, off electrons of the hot ambient plasma [see e.g., Sunyaev & Titarchuk (1980)]. Variability in the LHS is high (fractional root-mean-square variability is up to 40%) and presented by a flat-top broken power law (white-red noise) shape, accompanied by quasi-periodic oscillations (QPOs) in the range of 0.01-30 Hz, observed as narrow peaks in the power density spectrum (PDS). The HSS photon spectrum is characterized by a prominent thermal component which is probably a signature of a strong emission coming from a geometrically thin accretion disk. A weak power-law component is also present at a level of not more than 20% of the total source flux. In the HSS the flat-top variability ceases, QPOs disappear, and the PDS acquires a pure power-law shape. The total variability in the HSS is usually about 5% fractional rms. The IS is a transitional stage between the LHS and the HSS.
We have concentrated our efforts on a study of correlations between the photon index and the accretion disk (soft photon) luminosity. This correlation pattern carries the most direct information on a BH mass and a source distance. We also investigated a possibility that the shape of this correlation pattern can provide a direct signature of the bulk motion (converging) flow onto a BH, or in other words, the BH signature [see Titarchuk & Zannias (1998) and Laurent & Titarchuk (1999) for more details on this subject].
The authors of ST09 argue that that the saturation effect seen in the index-mass accretion rate correlation is a signature of a converging flow, when the mass accretion rate, exceeds the Eddington limit, which can only exist in BH sources. We note that in the neutron star (NS) sources the mass accretion rate is, in most cases, less than the Eddington rate limit. As far as we know, in only Sco X-1 does it reaches the Eddington limit [compare Shaposhnikov & Titarchuk (2009); Titarchuk & Seifina (2009); Seifina & Titarchuk (2010); Seifina & Titarchuk (2011); Seifina & Titarchuk (2012); Seifina, Titarchuk & Frontera (2013); Titarchuk, Seifina & Frontera (2013) and Seifina et al. (2014)].
In the observed LHS and IS a small fraction of the disk emission component is seen directly. The Compton cloud almost fully covers the inner part of the disk. The energy spectrum is dominated by a Comptonized component seen as a power law at energies higher than the characteristic energy of the disk blackbody (BB) emission. To calculate the normalization of the seed (disk) BB component we modeled the spectrum using a generic Comptonization model (BMC) (see Titarchuk et al. 1997) which consistently convolves a seed BB emission with the Green’s (response) function of the Compton corona (as a broken power law) to produce the Comptonized component (see details in §2). Calculated in this way the spectrum normalization is directly related to a BH mass, source distance and geometry. This allows us to apply the BB normalization as a scaling variable and to impose a constraint on a BH mass and distance ratios. Thus, we used the index-disk normalization correlation to constrain a BH mass for NGC 4051. As our reference values for the scaling measurements, we used the previously measured BH masses, source distances and inclinations for Galactic sources, Cygnus X-1 and GRO J1550-564. We also used a previous estimate of a BH mass for NGC 4051 obtained by Denney et al. (2009), (1.730.55)x106 solar masses in order to compare with our evaluation of it.
The descriptions of XMM/Newton, Suzaku and RXTE data are given in §2. We provide the details of the spectral state transitions analysis in §3. We describe a scaling method technique and present the results of interpretation of the data using the scaling method in §4. We discuss our results and emphasize on a BH mass estimate in NGC 4051 in §4. We make our final conclusions in §5
2 Observations and data reduction
For the study presented in this paper we have analyzed data for spectral transitions in NGC 4051 observed using XMM/Newton, Suzaku and RXTE. We analyzed a set of data taken during years when the source showed a transition from the LHS to the HSS. We used the archival XMM/Newton, and RXTE data from the HEASARC111http://heasarc.gsfc.nasa.gov/. For XMM/Newton there are 15 observations, 40 ks each collected in May-June 2009, two 50 ks observations collected on May, 16 2001 and on November, 22 2002 (see Table 1). Data reduction was done using SAS software version 10.0.0. Four Chandra observations had much smaller observational time and thus, larger statistical errors and were used mainly to confirm the XMM/Newton results by an independent detector with different systematic errors. XMM/Newton and Chandra data have been extracted and analyzed in the 0.2-12 keV energy band.
We studied NGC 4051 using also the Suzaku data, for November 10 of 2005 as well as for November 6 and 23 of the 2008 observations (see Table 2). We also used HEASOFT software package (version 6.13) and calibration database (CALDB) released on February 10, 2012 for XIS. Since the background is dominant in the lower energy band, we used photons in the 1 – 10 keV (for XIS0, and 3) and 1 – 7 keV (for XIS 1) energy bands. The data reduction and spectral analysis are performed following the Suzaku Data Reduction Guide222http://heasarc.gsfc.nasa.gov/docs/suzaku/analysis/. We obtained cleaned event files by re-running the Suzaku pipeline implementing the latest calibration database (CALDB) available since January 20 of 2013, and also applied the associated screening criteria files. We extracted our spectra from the cleaned event files using XSELEC and we generated responses for each detector utilizing the XISRESP script with a medium resolution. The spectral and response files for the front-illuminated detectors (XIS0, 1 and 3) were combined using the FTOOL ADDASCASPEC, after confirmation of their consistency. In addition, we grouped the spectra in order to have a minimum of 20 counts per energy bin.
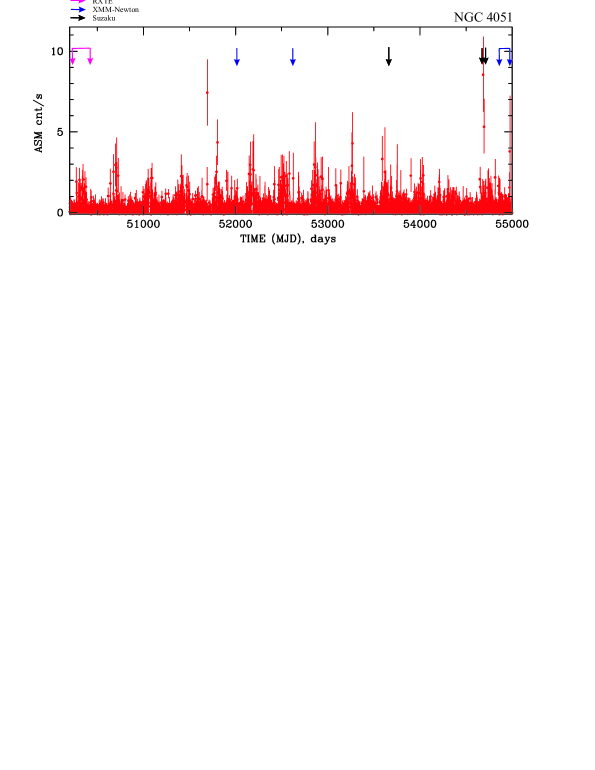
We analyzed available data using the public archive (Bradt et al., 1993) using the RXTE observations made from May, 1996 to May, 2001. In Figure 1 we show the light curve evolution for the RXTE 1996-2009 observations of NGC 4051. Standard tasks of the LHEASOFT/FTOOLS 6.21 software package were applied for data processing. For spectral analysis we used PCA Standard 2 mode data, collected in the 3 – 30 keV energy range, using PCA response calibration (ftool pcarmf v11.7). The standard dead time correction procedure was applied to the data. We subtracted a background corrected in off-source observations. Systematic error of 0.5% was applied to all analyzed RXTE spectra. In Table 3 we provide the necessary information on the RXTE observations. We modeled all energy spectra using the XSPEC astrophysical fitting software.
To fit XMM/Newton, and Suzaku () component, the Laor line component with the energies keV, which are presumably due to the iron emission line (see Fig. 2) and the recombination edge (redge) component modified by gabs absorption. All the RXTE spectra were fitted using our composite model consist of the BMC and Laor line components.
In particular, the BMC model describes the outgoing spectrum as a convolution of the seed BB spectrum where the model parameters are normalization , a color temperature , using the Comptonization Green’s function. Similarly to the ordinary BB XSPEC model the normalization is a ratio of source luminosity to square of the distance d
| (1) |
The resulting model spectrum is also characterized by a parameter related to a Comptonized (illumination) fraction, and the Green’s function spectral index , where is the photon index.
The two reasons for using the BMC model are firstly, the BMC, by the nature is a model which is applicable to a general case when soft (disk) photons gain energy not only due to the thermal Comptonization but also due to a dynamical or bulk motion Comptonization. Secondly, the BMC has normalization of the seed (disk) photons , which is proportional to the mass accretion rate in the disk.
The adopted spectral model well describes the most data sets used in our analysis. A value of the reduced , where is a number of degrees of freedom for a given fit, is always around 1.0 for all of XMM, Suzaku and RXTE observations (see Tables 4-6).
We incorporate the Laor-line profile to fit the line component. The line feature has a statistical significance of (3 – 10) depending on the spectral states. This line is variable and exhibits equivalent width (EW) in the range of 50 – 700 eV across the data , see Tables 4- 6. We found that an addition of the Laor-line component significantly improves the fit quality of the LHS and IS spectra.
We revealed absorption edges in the fits of the NGC 4051 spectra, which can be interpreted as an evidence of a clumpy, multi-temperature outflow around NGC 4051, particularly in the IS. We also applied the recombination edge emission model, redge333https://heasarc.gsfc.nasa.gov/xanadu/xspec/XspecManual.pdf for all and XMM- spectra, which considerably improves the fit quality of the LHS spectra. The parameters of the redge model are: threshold energy; plasma temperature (keV), and , normalization in photons/cm2/s in the line.
Thus, we identified a complete set of spectral transitions in a period when the source state changes from the LHS to the IS (or vice versa). We should establish that NGC 4051 does not reach the real HSS when the photon index of X-ray spectrum usually exceeds two (see e.g., ST09). The photon index saturation value is also determined by the electron temperature of the converging flow (see for example, Laurent & Titarchuk 1999, hereafter LT99). In Tables 4 – 6 we present the details of the model fits to the spectral data for each of the observations related to a paricular spectral state defined by a value of the spectral (or photon) index.
As seen above we used all available XMM-Newton and Suzaku archived observations of NGC4051, which are distributed accordingly to the specific observation schedule. We also used all particular well-monitored RXTE observations of NGC 4051 where we observe the spectral changes, particularly changes of the spectral (or photon) indices. In these cases we established the correlation of the photon index, vs normalization of the photon component which is identical to normalization of the soft (disk) component.
3 Correlations between the spectral (photon) index and mass accretion rate during spectral state transitions
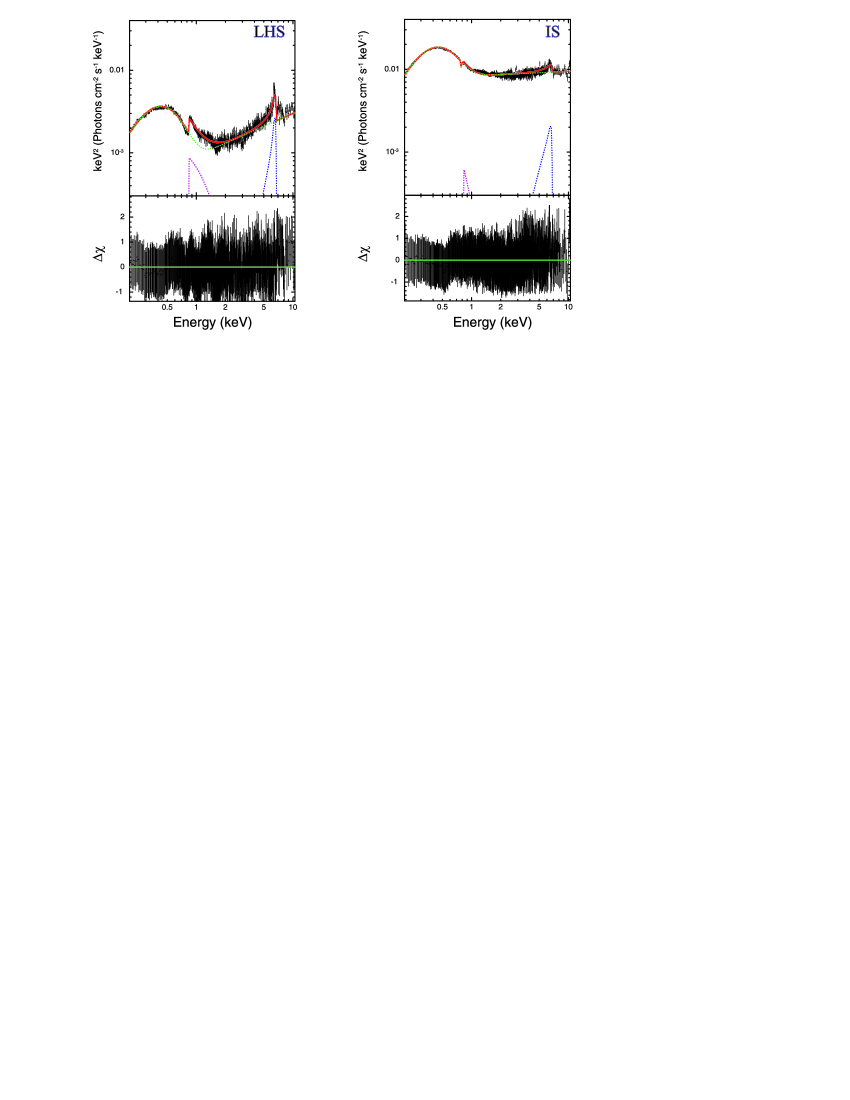
In Figure 2 we show two representative EF(E) spectral diagrams for the LHS and the IS states (red lines). Data were taken from XMM- observations 0157560101 (left panel, “X2” data set, LHS), and 0109141401 (right panel, “X1” data set, IS).
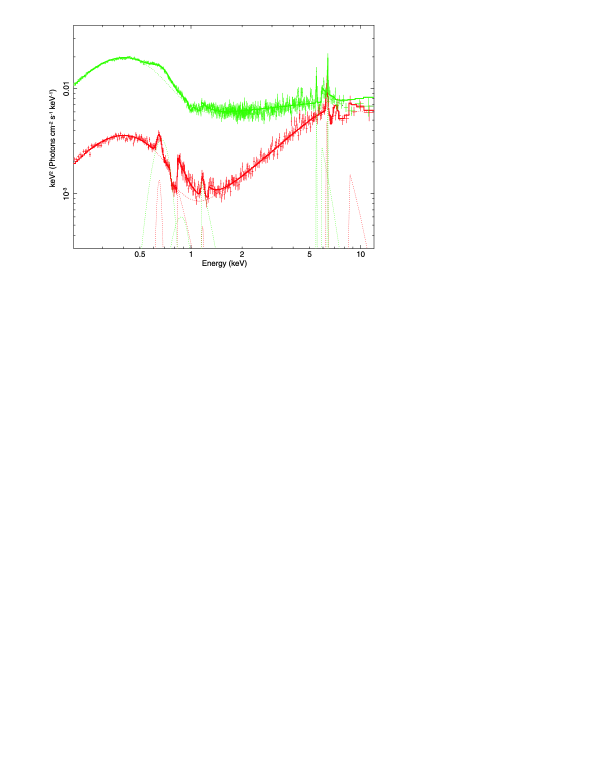
In Figure 3 we demonstrate a spectral evolution using XMM/Newton data for the LHS (red curve) and IS (green curve) states (2001, 2009). It is worth pointing out a strength of the low energy component at keV in the IS and its weakness in the LHS. The XMM- spectra, which are characterized by the highest energy resolution quality, clear demonstrate a number of additional emission and absorption features in the LHS (see Fig. 3, red line). However, these features are not well pronounced in the IS spectra (e.g., Figure 3, green line). Thus, in this Figure we show the complete set of the spectra, which were detected during the spectral evolution.
We should emphasize the presence of the Laor line component and the recombination edge emission component, redge near 6.4 keV in all XMM/ spectra (see Figs. 2-3). For all spectra we also applied a Gaussian absorption line model, gabs using as parameters, the line energy, , (in keV) the line width, (in keV) and the line optical depth at the line center. Our model for the data fits is .
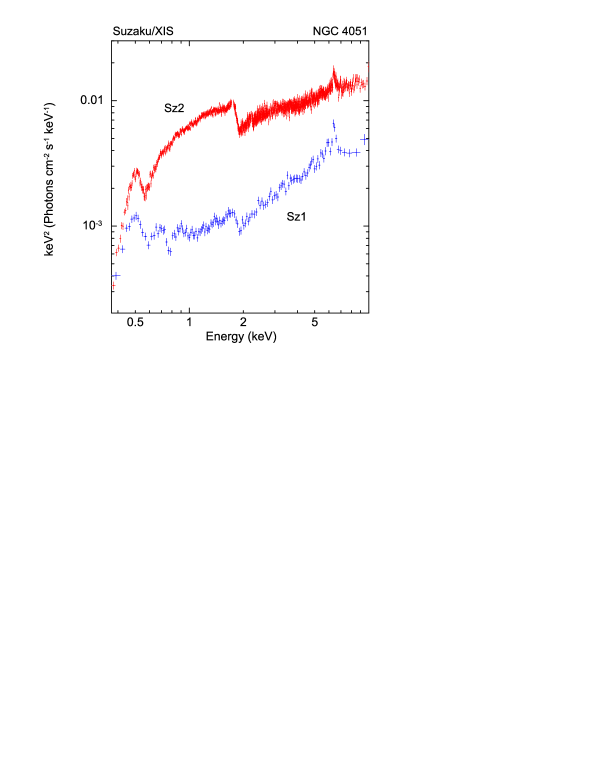
In Figure 4 we also show the spectra of NGC 4051 for the 2005 and 2008 outburst event epoches with another X–ray mission, . The data cover two spectral states of the source, in our classification: the LHS (blue), the IS (red).
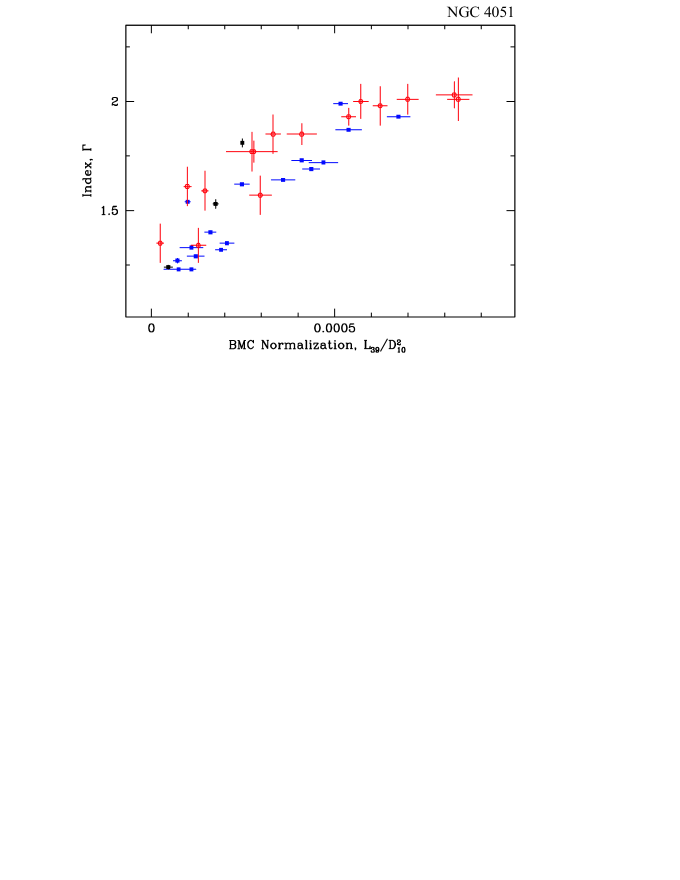
The normalization of the spectra (proportional to the mass accretion rate) positively correlates with the photon index. The correlation pattern for NGC 4051 presented in Figure 5 demonstrate a clear saturation of the photon index which is also identified in several Galactic and extragalactic BH sources [see ST09, Seifina & Titarchuk (2011); Seifina & Titarchuk (2012); Seifina, Titarchuk & Frontera (2013); Titarchuk, Seifina & Frontera (2013), Seifina et al. (2014), (2017); Titarchuk & Seifina (2016a),(2016b), (2017)].
On the other hand Farinelli & Titarchuk (2011) (hereafter FT11) and later Seifina & Titarchuk (2011), (2012), (2013); Seifina et al. (2013), (2015), (2016); Titarchuk et al. (2013), (2014), (2015), (2016) show that the index stays the same in a number of NS sources independently of a mass accretion rate. One sees almost no change of the index when a particular NS source evolves from the low to high luminosity states. Thus, even phenomenologically the index evolves for BHs and stays around two for NSs. ST09 and FT11 present the strong theoretical arguments for such particular behaviors of the index in BH and NS sources, respectively.
The index saturation level for the spectral transition in NGC 4051 has values close to two. It can be due to the fact that at lower accretion rates in the disk the cooling of X-ray emission area [Compton cloud (CC)] by the disk photons is less efficient than that at high disk mass accretion rate . As a result, the electron temperature of the converging flow (CF) is still relatively high (1015 keV, see LT99) even when the total mass accretion rate is greater than 1. As a result this temperature effect leads to more efficient upscattering in CF and harder spectra. The direct connection between the electron temperature of the CC and the hardness of the emergent spectrum were shown by Laurent & Titarchuk (1999), (2011) using Monte-Carlo simulations. This type of the index-mass accretion rate correlation is also seen in Cygnus X-1 and in a number of other BHCs (see details in ST09).
As one can see that our definition of the spectral state is not arbitrary. Indeed, normalization of the soft component in the LHS is one order of magnitude less than that in the IS (see Figs. 2-4). The photon indices are also different; at about 1.5 in the LHS and 2 in the IS (see Figs. 2-6).
3.1 Evolution of the spectral Index from the low-hard state to softer states in BHs: Analytical explanation
We then estimated a value of the spectral index in the low-hard state and its evolution to softer states. For this estimate we used the energy balance in the transition layer (TL) dictated by Coulomb collisions of protons (gravitational energy release), while inverse Compton and free-free emission are the main cooling channels [see a formulation of this problem in the pioneering work by Zel’dovich & Shakura (1969) and a similar consideration in Bisnovatyi et al. (1980)]. For the characteristic electron temperature (3 keV 50 keV) of these regions, Compton cooling dominates over free-free emission and the relation between the energy flux per unit surface area of the corona , the radiation energy density and electron temperature can be given by [see Zel’dovich & Shakura (1969) and Titarchuk, Lapidus & Muslimov (1998), hereafter TLM98]
| (2) |
where is the Thomson optical depth in the transition layer (TL). The distribution is obtained as a solution of the diffusion equation
| (3) |
where is a distribution of the sources in the corona due to the gravitational energy release of the accreted matter there and illumination of the corona by the soft flux of the disk. The parameter can be presented as
| (4) |
where is the sum of the corona (TL) and intercepted disk fluxes, respectively. Combination of Eq. (3) with two boundary conditions at the outer and inner TL boundaries
| (5) |
leads us to the formulation of the TL boundary problem.
The solution for is given by
| (6) |
We then rewrite the right-hand of Eq. (2) as
| (7) |
using the mean value theorem, where is the mean electron temperature.
The following integral of [see Eq. (6)] is
| (8) |
To evaluate how the spectral (photon) index changes with ratio we use a formula for the spectral index
| (10) |
where and parameter, defined in Titarchuk & Lyubarskij (1995). If we replace by its diffusion limit
| (11) |
for using we obtain the diffusion spectral index as
| (12) |
where . Using this formula for and Eq. (9) we obtain that
| (13) |
We can also rewrite Eq. (12) for in a more convenient form
| (14) |
from which the following two asymptotic behaviors of are obvious: When it follows that and then
| (15) |
While for (or with a rise of the mass accretion rate) increases which leads to an increase of :
| (16) |
Thus, using formulas (1316) one can see that rises when increases.
The index evolution including its saturation with the mass accretion rate were analyzed observationally and numerically by ST09 and Laurent & Titarchuk (2011) (hereafter LT11). Here we estimate analytically that the spectral index really rises from when and then the emergent spectrum becomes softer when the illumination of the innermost part of the accretion flow by the soft (disk) photons increases (see e.g., Fig. 5).
Indeed, in Figures 5-6 we demonstrate that the best-fit photon index really grows with a mass accretion rate, (or with , see below Eq. 20). But when increases the disk soft photon illumination of the transition layer, increases too and thus, formulas (1416) qualitatively describes the index rise with a mass accretion rate. The behavior of the photon index versus a mass accretion rate in the converging flow was studied in detail by LT99 and LT11 with taking into account all effects of General Relativity. Here, we describe the index increase qualitatively with the mass accretion rate.
4 Discussion
The accretion process onto a BH is far from being completely understood. Theoretical models which are available for astronomers to explain observational phenomena usually deal with only narrow aspects of a broad observational picture. However, in recent years a concept of the transitional layer (TL) in the accretion flow has emerged. In the framework of this model several major observational aspects of accreting BHs find the natural explanation. We argue that this concept is a strong candidate to provide a basis for a theory of accretion process onto compact objects which would account for the current observational picture of BH sources. Moreover, this paradigm may provide us with a first direct BH signature observationally confirmed in multiple sources.
The starting point in the development of the TL paradigm is the notion of the necessary deviation of the rotational profile in the innermost part of the disk set by the conditions at (or near) a compact object for which rotation is presumed to be much slower than the Keplerian frequency near the object. This problem was first considered by Titarchuk, Lapidus & Muslimov (1998) who showed that the adjustment of the Keplerian rotation in the accretion disk to the sub-Keplerian rotation of the central object leads to the formation of the inner hot Compton corona
Currently, BH identification in X-ray observational astronomy is based solely on a mass of compact object. Namely, a compact X-ray source is classified as a BH if it is well established that its mass exceeds the upper mass limit of a stable rotating neutron star, namely 3.2 M⊙ (see e.g., Rhoades & Ruffini, 1974). To the date there is only one widely accepted method for mass determination related to the measurement of the mass function based on optical spectroscopy (see above). But this method the mass determination used for binaries cannot be applicable for AGNs.
We have evaluated a BH mass in NGC 4051 using scaling relationships in correlations between the index and mass accretion rate observed during the state transitions in Galactic and extragalactic accreting BHs. We applied a previously proposed technique for BH mass determination using scaling the indexX-ray spectrum normalization (see ST09) which contains information on source distance and BH mass.
4.1 The scaling technique and BH mass evaluation in NGC 4051
One of the goals of this study is to apply X-ray observational data for NGC 4051 to infer its fundamental characteristics. To do this we used the BH spectral state paradigm combined with the scaling laws expected to be observed in spectral and timing data during state transitions.
The scaling law, which we have used as a basis for our mass determination analysis, relates a source flux detected by an observer on the Earth, a disk flux and distance , namely
| (17) |
where subscripts and denote reference and target sources respectively, and stands for the source flux detected by an observer on the Earth. The disk flux can be represented as
| (18) |
Here is an effective radius at which the main energy release takes place, is the Schwarzschild radius, , is dimensionless mass accretion rate in units of the critical mass accretion rate and is the Eddington luminosity.
We assume that both and are the same for two different sources in the same spectral state, which leads to . In our spectral analysis we determined the normalization of the seed photon radiation, which is supplied by an accretion flow (disk) prior to Comptonization. The ratio of these normalizations for target and reference sources in the same spectral state can be written as
| (21) |
Here, is a geometrical factor which takes into account the difference in viewing angles of the seed photon emission area (the inner disk) by the Earth observer for these given sources. Therefore, in the case of radiation coming directly from the disk it has the value , where is the inclination angle of the inner disk. This formula for , however, may not be accurate because the geometry of both the inner disk and the corona can be different from the plane (disk) geometry. In BH states of interest (the LHS and the IS) they can be described, for instance, by quasi-spherical configuration. Despite this uncertainty in the determination of , we adopted the above form in which if the information on the system inclination angle is available. In doing this we introduced an additional assumption that the inner accretion disk and the system inclination angles are the same. This assumption, however, proved to be in good agreement with this type of analysis.
Using Eq. (21) and a relation in hand, the task of BH mass measurement for a target source is reduced to the determination of scaling coefficients with respect to the data for a reference source. The appropriate technique has already been implemented in a number of BH sources [see ST09, Titarchuk & Seifina (2016a), (2016b), (2017) hereafter TS16a, TS16b, TS17].
4.2 Estimate of a black hole mass
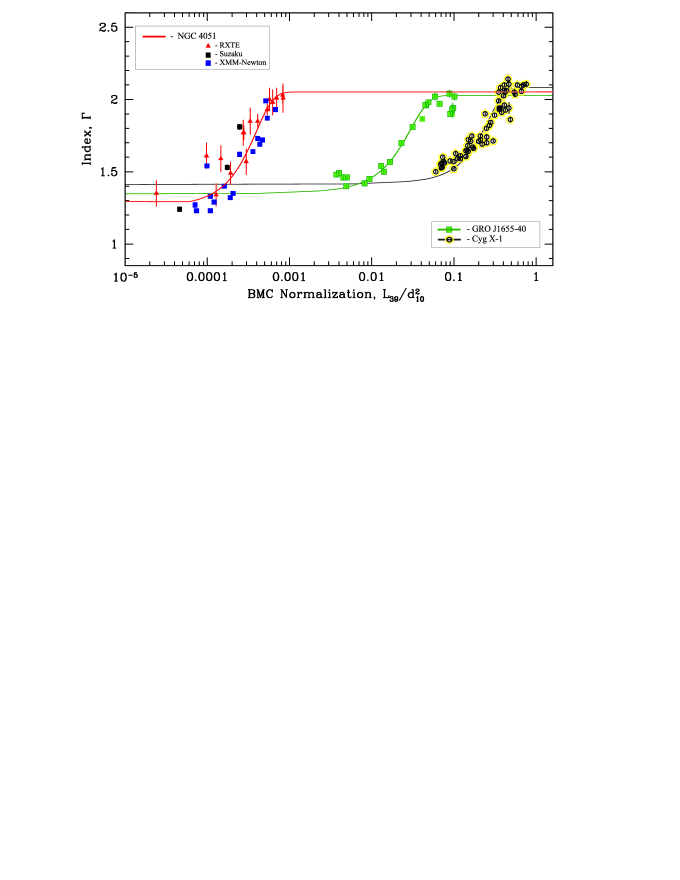
To estimate a BH mass, of NGC 4051, we chose Galactic sources [GRO J1655–40 and Cyg X–1 (see ST09)] as the reference sources for which BH masses and distances were well established now (see Table 7). For a BH mass estimate of NGC 4051 we used the BMC normalizations, of these reference sources.
Thus, we scaled the index vs correlations for these reference sources with that of the target source NGC 4051 (see Fig. 6). The value of the index saturation in NGC 4051, , is close to of GRO J1655–40 and to of Cyg X–1. The scaling procedure was implemented in a similar way as in ST09, TS16a, TS16b. We introduced an analytical approximation of the correlation, fitted by a formula
| (22) |
with . Fitting of the observed correlation by this function provide us a set of the best-fit parameters , , , , and . (see Table 8). More detailed description of these parameters is given in TS16a.
To implement this BH mass estimate for the target source one should rely on the same shape of the correlations for the target source and those for the reference sources. To estimate a BH mass, of NGC 4051 (target source) one should slide the reference source correlation along axis to that of the target source (see Fig. 6).
| (23) |
In Figure 6 we demonstrate the correlation for NGC 4051 using XMM- (blue squares), (black squares) and RXTE (red triangles) spectra (see Tables 4 – 6) along with those for the Galactic reference sources, Cyg X–1 (black circles) and GRO 1655–40 (green squares). BH masses and distances for this target-reference pair are presented in Table 7.
We used values of , , , , and from Table 7 and then calculated the lowest limit of the mass, using the best fit value of taken them at the beginning of the index saturation (see Fig. 6) and measured in units of erg s-1 kpc-2 [see Table 8 for values of the parameters of function (see Eq. 22)]. Finally, we obtained that () assuming 9.8 Mpc and . To determine the distance to NGC 4051 we used the formula
| (24) |
where the redshift for NGC 4051 (see Wright 2006), is the speed of light and km s-1 Mpc-1 is the Hubble constant. We summarize these results in Table 7.
Thus, we constructed the scaling which allowed us to obtain a BH mass of solar masses in NGC 4051 which is our final evaluation of BH mass using the scaling method. The obtained BH mass estimate is in agreement with estimates of a variability time in optical Hβ line (, Peterson et al., 2000). Furthermore, the lower limit of the BH mass for NGC 4051 from reverberation mapping method ( M⊙, Kaspi et al. 2000) is close to that found in this paper. We also refer to the BH mass estimate in NGC 4051, obtained by Denney et al. (2009) and this BH mass interval indicates that our estimate does not contradict to the Denney’s et al. evaluation.
Our scaling method was effectively applied to evaluate BH masses of Galactic (e.g., ST09, STS13) and extragalactic black holes (TS16a,b; Sobolewska & Papadakis 2009; Giacche et al. 2014). Recently the scaling method was also successfully implemented to estimate BH masses of two ultraluminous X-ray (ULX) sources M101 ULX–1 (TS16a) and ESO 243–49 HLX–1 (TS16b). These findings suggest BH masses of order of solar masses in these unique objects.
We then applied the scaling method and found the BH mass in another extragalactic source NGC 4051. Thus, the scaling technique provides a promising prospect for a BH mass evaluation for Galactic and extragalactic BHs, TDE, and ULX sources.
5 Conclusions
We performed a comprehensive study of a highly representative set of well observed spectral transitions in NGC 4051. The goal of the study is to explore the possibility of measuring the BH fundamental properties applying X-ray data and search for a BH signature in NGC 4051 . We used the correlation between spectral and mass accretion rate properties during the state transitions as a main tool to estimate BH mass in NGC 4051.
We established the spectral state transition in this source collecting X-ray data from the Newton XMM, and RXTE missions. We examined the correlation between the photon index of the Comptonized spectral component and its normalization. Analyzing the behavior of the correlation patterns we utilize three basic scaling laws: the observed disk flux is proportional to a BH mass, the mass accretion rate and inversely proportional to a square of distance to a particular source. We established that scalable correlation patterns do indeed contain information on BH mass.
Then we combined the correlation patterns in the normalization domain for Galactic X-ray BH binaries, Cygnus X-1, GRO 1655-40, for which BH masses and distances are known, and scaled them with that for NGC 4051. As a result we found that all of these correlations are self-similar for these three BHs. The application of the scaling technique for the high precision measurements of BH masses requires well sampled observations of the source evolution through the outbursts and careful consideration of scalability of correlation patterns.
We show that the photon index of the BH emergent spectra of NGC 4051, undergoes an evolution from small to high values depending on a mass accretion rate in the source. Using this correlation along with scaling technique gives us an estimate of a BH mass in NGC 4051, . We also note that the referee of this paper also emphasizes that NGC 4051 is one of the NLSy1s (narrow line Seyfert 1s), which are thought to have BHs with relatively low mass, of the order of solar masses. This is why the Earth observer could even see the disk emission in X-rays (and is thus highly relevant to our model) (see Figs. 23).
Acknowledgements.
E.S. acknowledges Pascal Chardonnet for useful discussions. L.T. thanks Filippo Frontera for wide discussion of the results of this paper and the referee for her/his interesting remarks on the content of the paper.| Set number | Obs. ID | Start time (UT) | End time (UT) | MJD interval | Mean count rate |
|---|---|---|---|---|---|
| (cts/s) | |||||
| X1 | 0109141401(1,2) | 2001 May 16 22:52:05 | 2001 May 17 20:22:31 | 52045.9 – 52046.8 | 33.000.02 |
| X2 | 0157560101(2) | 2002 Nov 22 06:09:51 | 2002 Nov 22 20:01:48 | 52600.2 – 52600.8 | 6.210.01 |
| X3 | 0606320101(3) | 2009 May 3 10:22:29 | 2009 May 3 23:03:02 | 54954.4 – 54954.9 | 6.210.01 |
| X4 | 0606320201(3) | 2009 May 5 10:15:55 | 2009 May 5 22:41:39 | 54956.4 – 54956.9 | 12.810.02 |
| X5 | 0606320301(3) | 2009 May 9 10:01:34 | 2009 May 9 18:49:22 | 54960.4 – 54960.7 | 24.790.04 |
| X6 | 0606320401(3) | 2009 May 11 10:00:35 | 2009 May 11 18:00:24 | 54962.4 – 54962.7 | 6.180.02 |
| X7 | 0606321301(3) | 2009 May 15 13:16:11 | 2009 May 15 21:38:31 | 54966.5 – 54966.9 | 31.150.04 |
| X8 | 0606321401(3) | 2009 May 17 09:41:17 | 2009 May 17 20:35:00 | 54968.4 – 54968.8 | 19.310.03 |
| X9 | 0606321501(3) | 2009 May 19 09:34:48 | 2009 May 19 09:28:43 | 54970.3 – 54970.4 | 19.410.03 |
| X10 | 0606321601(3) | 2009 May 21 09:27:52 | 2009 May 21 20:59:21 | 54972.3 – 54972.8 | 38.950.04 |
| X11 | 0606321701(3) | 2009 May 27 10:50:16 | 2009 May 27 21:29:10 | 54978.4 – 54978.8 | 8.130.02 |
| X12 | 0606321801(3) | 2009 May 29 09:15:27 | 2009 May 29 20:20:52 | 54980.3 – 54980.8 | 11.550.03 |
| X13 | 0606321901(3) | 2009 June 2 11:04:29 | 2009 June 2 21:11:35 | 54984.4 – 54984.8 | 6.510.02 |
| X14 | 0606322001(3) | 2009 June 4 10:41:05 | 2009 June 4 20:56:32 | 54986.4 – 54986.8 | 11.460.03 |
| X15 | 0606322101(3) | 2009 June 8 08:40:24 | 2009 June 8 19:08:04 | 54990.3 – 54990.7 | 3.810.02 |
| X16 | 0606322201(3) | 2009 June 10 08:21:42 | 2009 June 10 19:47:00 | 54992.3 – 54992.8 | 10.340.02 |
| X17 | 0606322301(3) | 2009 June 16 08:29:06 | 2009 June 16 20:13:36 | 54998.3 – 54998.8 | 10.350.02 |
(1) McHardy et al. (2004); (2) Haba et al. (2008); (3) Pounds& King (2013).
| Set number | Obs. ID | Start time (UT) | End time (UT) | MJD interval | Mean count rate |
|---|---|---|---|---|---|
| Sz1 ……………. | 700004010(1,2) | 2005 Nov 10 19:14:14 | 2005 Nov 13 10:21:24 | 53684.1 – 53687.0 | 0.4560.002 |
| Sz2 ……………. | 703023010(1) | 2008 Nov 6 07:39:03 | 2008 Nov 12 02:40:14 | 54776.6 – 54782.1 | 2.3310.003 |
| Sz3 ……………. | 703023020(1) | 2008 Nov 23 16:48:00 | 2008 Nov 25 13:43:43 | 54793.5 – 54795.4 | 1.5310.004 |
| Observational ID | Start time (UT) | MJD | Exposure |
|---|---|---|---|
| (sec) | |||
| 10301-01-04-00(1) | 1996-05-20 10:25:37.3 | 50223.4 | 943 |
| 10301-01-07-00(1) | 1996-05-21 22:13:33.3 | 50224.9 | 1610 |
| 10301-01-08-00(1) | 1996-05-22 04:06:53.3 | 50225.1 | 1210 |
| 10301-01-09-00(1) | 1996-05-23 03:13:26.1 | 50226.1 | 1323 |
| 10301-01-22-00(1) | 1996-05-29 07:18:46.1 | 50232.3 | 1045 |
| 10301-01-58-00(1) | 1996-10-19 19:16:43.4 | 50375.8 | 1232 |
| 10301-01-60-00(1) | 1996-10-21 19:17:42.1 | 50377.8 | 1292 |
| 10301-01-61-00(1) | 1996-10-22 13:20:24.6 | 50378.5 | 1026 |
| 20318-01-01-00(1) | 1996-12-13 10:16:22.7 | 50430.4 | 9250 |
| 20319-01-01-00(1) | 1996-11-10 17:37:05.4 | 50397.7 | 945 |
| 20319-01-03-00(1) | 1996-12-10 19:19:56.1 | 50427.8 | 1018 |
| 50153-01-01-01(1) | 2001-05-16 05:41:39.3 | 52045.2 | 18401 |
| 50153-01-01-02(1) | 2001-05-16 15:19:39.4 | 52045.6 | 1777 |
| 50153-01-01-03(1) | 2001-05-16 18:05:00.7 | 52045.7 | 12537 |
| 50153-01-01-05(1) | 2001-05-16 03:49:03.6 | 52045.1 | 4595 |
| 50153-01-01-06(1) | 2001-05-16 16:35:13.6 | 52045.6 | 2711 |
(1) McHardy et al. (2004)
| Observational | ||||||||||
|---|---|---|---|---|---|---|---|---|---|---|
| ID | (keV) | (keV) | (keV) | (keV) | (dof) | |||||
| 0109141401 | 0.10(1) | 0.99(4) | -0.16(1) | 5.16(5) | 6.42(8) | 2.8(1) | 0.78(3) | 0.29(8) | 2.1(1) | 0.95 (1976) |
| 0157560101 | 0.11(3) | 0.54(1) | -0.34(2) | 0.99(2) | 6.59(7) | 0.9(3) | 0.74(5) | 0.26(1) | 2.7(3) | 0.76 (1976) |
| 0606320101 | 0.09(1) | 0.62(2) | -0.49(2) | 2.47(5) | 6.46(6) | 1.1(2) | 0.75(4) | 0.30(5) | 1.3(2) | 0.87 (1976) |
| 0606320201 | 0.10(1) | 0.73(2) | -0.54(3) | 4.10(7) | 6.59(8) | 2.7(1) | 0.76(3) | 0.32(1) | 1.4(1) | 0.69 (1976) |
| 0606320301 | 0.10(2) | 0.72(2) | -0.49(1) | 4.7(1) | 6.51(4) | 2.5(4) | 0.77(2) | 0.35(4) | 1.6(3) | 0.96 (1976) |
| 0606320401 | 0.10(1) | 0.23(1) | -0.14(6) | 0.74(8) | 6.59(7) | 0.7(3) | 0.78(7) | 0.34(2) | 0.9(4) | 0.72 (2157) |
| 0606321301 | 0.10(3) | 0.87(3) | -0.51(2) | 5.38(9) | 6.41(5) | 3.2(2) | 0.74(5) | 0.33(1) | 2.3(2) | 0.85 (2157) |
| 0606321401 | 0.10(2) | 0.69(4) | -0.54(4) | 4.36(6) | 6.45(4) | 2.6(1) | 0.76(3) | 0.32(5) | 1.5(1) | 0.81 (1976) |
| 0606321501 | 0.10(1) | 0.64(2) | -0.52(3) | 3.59(8 | 6.48(3) | 1.2(1) | 0.77(4) | 0.33(1) | 0.9(4) | 0.74 (1976) |
| 0606321601 | 0.10(1) | 0.93(7) | -0.43(1) | 6.74(8) | 6.39(7) | 3.4(3) | 0.73(5) | 0.35(2) | 3.0(3) | 0.85 (1976) |
| 0606321701 | 0.09(2) | 0.40(2) | -0.49(4) | 1.61(4) | 6.59(8) | 0.9(2) | 0.78(3) | 0.34(4) | 2.2(1) | 0.73 (1976) |
| 0606321801 | 0.10(1) | 0.29(1) | -0.45(2) | 1.21(6) | 6.67(4) | 0.7(1) | 0.75(2) | 0.27(5) | 0.9(2) | 0.77 (1976) |
| 0606321901 | 0.10(1) | 0.23(2) | -0.42(2) | 1.09(3) | 6.59(6) | 0.6(3) | 0.78(4) | 0.21(1) | 0.8(3) | 0.78 (1976) |
| 0606322001 | 0.10(1) | 0.35(1) | -0.51(1) | 2.06(5) | 6.44(4) | 1.0(1) | 0.73(5) | 0.35(2) | 1.1(2) | 0.94 (1976) |
| 0606322101 | 0.10(2) | 0.27(2) | -0.53(2) | 0.71(3) | 6.70(7) | 0.8(2) | 0.78(3) | 0.18(5) | 0.7(1) | 0.83 (1976) |
| 0606322201 | 0.10(1) | 0.32(1) | -0.49(1) | 1.90(4) | 6.59(3) | 1.1(3) | 0.78(4) | 0.23(2) | 1.8(2) | 0.95 (1976) |
| 0606322301 | 0.11(2) | 0.33(2) | -0.54(2) | 1.09(8) | 6.58(7) | 1.0(4) | 0.76(5) | 0.20(1) | 0.9(1) | 0.74 (2157) |
| Observational | ||||||||||
|---|---|---|---|---|---|---|---|---|---|---|
| ID | (keV) | (keV) | (keV) | (keV) | (dof) | |||||
| 700004010 | 0.13(1) | 0.24(1) | 0.37(2) | 0.46(3) | 6.69(4) | 2.4(3) | 0.78(4) | 0.35(5) | 1.7(4) | 0.97 (1052) |
| 703023010 | 0.29(1) | 0.81(2) | 0.48(1) | 2.48(1) | 6.42(6) | 3.6(2) | 0.75(5) | 0.32(3) | 2.1(2) | 1.04 (2207) |
| 703023020 | 0.28(1) | 0.53(2) | 0.42(1) | 1.75(2) | 6.43(3) | 3.1(4) | 0.78(3) | 0.31(2) | 2.0(3) | 0.92 (1542) |
| Observational | |||||||
|---|---|---|---|---|---|---|---|
| ID | (keV) | (keV) | (dof) | ||||
| 10301-01-04-00 | 0.110.02 | 0.490.08 | -0.020.01 | 1.920.3 | 6.590.08 | 0.90.1 | 1.02 (93) |
| 10301-01-07-00 | 0.090.01 | 0.770.09 | 0.120.03 | 2.740.7 | 6.490.03 | 1.90.2 | 1.09 (62) |
| 10301-01-08-00 | 0.070.01 | 0.850.09 | 0.170.03 | 3.320.2 | 6.460.07 | 2.10.2 | 0.57 (62) |
| 10301-01-09-00 | 0.130.03 | 1.010.07 | 0.370.07 | 6.990.3 | 6.410.03 | 2.60.5 | 1.01 (57) |
| 10301-01-22-00 | 0.050.01 | 0.610.09 | -0.010.01 | 0.980.1 | 6.670.09 | 0.50.1 | 0.68 (57) |
| 10301-01-58-00 | 0.050.02 | 0.590.09 | -0.020.01 | 1.460.1 | 6.570.06 | 0.70.3 | 0.82 (57) |
| 10301-01-59-00 | 0.040.01 | 0.770.05 | 0.090.03 | 2.790.1 | 6.180.07 | 1.70.2 | 1.09 (57) |
| 10301-01-60-00 | 0.110.03 | 1.030.06 | 0.470.06 | 8.260.5 | 6.360.09 | 3.80.4 | 0.87 (57) |
| 10301-01-61-00 | 0.060.01 | 0.850.05 | 0.190.04 | 4.100.4 | 6.430.08 | 1.90.1 | 1.24 (57) |
| 20318-01-01-00 | 0.100.03 | 0.350.09 | 0.040.01 | 0.240.1 | 6.680.04 | 0.60.3 | 0.83 (57) |
| 50153-01-01-00 | 0.210.09 | 0.570.09 | -0.140.07 | 2.970.3 | 6.500.09 | 1.60.2 | 0.79 (79) |
| 50153-01-01-01 | 0.100.08 | 1.010.10 | 0.030.01 | 8.370.3 | 6.370.08 | 3.60.1 | 0.75 (50) |
| 50153-01-01-02 | 0.100.08 | 0.980.09 | 0.970.14 | 6.240.2 | 6.430.09 | 2.40.4 | 0.85 (50) |
| 50153-01-01-03 | 0.100.08 | 1.000.08 | 0.970.14 | 5.710.2 | 6.420.03 | 2.10.2 | 0.85 (50) |
| 50153-01-01-05 | 0.320.08 | 0.340.08 | 0.330.14 | 1.280.2 | 6.520.04 | 0.90.3 | 0.85 (50) |
| 50153-01-01-06 | 0.610.02 | 0.930.04 | 0.060.03 | 5.380.2 | 6.460.08 | 2.20.4 | 0.95 (50) |
| Source | M (M | i (deg) | db (kpc) | (M⊙) | Mscal (M⊙) |
|---|---|---|---|---|---|
| GRO J1655–40 | 6.30.3(1,2) | 701(1,2) | 3.20.2(3) | … | … |
| Cyg X–1 | 6.8 – 13.3(4,5) | 355(4,5) | 2.50.3(4,5) | … | 7.91.0 |
| NGC 4051(6,7,8,9,10) | … | … | 9800 | 3 |
| Reference source | ||||||
|---|---|---|---|---|---|---|
| Cyg X–1 | 2.090.01 | 0.520.02 | 1.0 | 0.40.1 | 3.50.1 | |
| GRO J1655–40 | 2.030.02 | 0.450.03 | 1.0 | 0.070.02 | 1.880.25 | |
| Target source | ||||||
| NGC 4051 | 2.050.07 | 0.610.08 | 1.0 | 9.560.07 | 0.520.09 |
References
- Belloni et al. (2005) Belloni, T., Homan, J., Casella, P., van der Klis, M., Nespoli, E., Lewin, W. H. G., Miller, J. M., & Méndez, M. 2005, A&A, 440, 207
- Belloni (2005) Belloni, T. 2005, Interacting Binaries: Accretion, Evolution, and Outcomes, 797, 197
- Belloni et al. (2006) Belloni, T., et al. 2006, MNRAS, 367, 1113
- Bisnovatyi et al. (1980) Bisnovatyi, G. S., Khlopov, M.Yu., Chechetkin, V.M. & Eramzhyan 1980, Sov. Astr., 24, 716
- Borozdin et al. (1999) Borozdin, K., Revnivtsev, M., Trudolyubov, S., Shrader, C. & Titarchuk, L. 1999, ApJ, 517, 367
- Bradt et al. (1993) Bradt, H. V., Rothschild, R. E., & Swank, J. H. 1993, A&AS, 97, 355
- Casella et al. (2004) Casella, P., Belloni, T., Homan, J., & Stella, L. 2004, A&A, 426, 587
- Denney et al. (2009) Dennee K.D. et al. 2009, ApJ, 702, 1353
- Dewangan, Titarchuk & Griffiths (2006) Dewangan, G. C., Titarchuk, L., Griffiths, R. E. 2006, ApJ, 637, L21
- Dickey & Lockman (1990) Dickey,J.M., & Lockman, F.J. 1990, ARAA, 28, 215
- Farinelli & Titarchuk (2011) Farinelli, R. & Titarchuk, L. 2011, A&A, 525, 102
- Farinelli et al. (2008) Farinelli, R., Titarchuk, L., Paizis, A. & Frontera, F. 2008, ApJ, 680, 602, (F08)
- Fiorito & Titarchuk (2004) Fiorito, R., Titarchuk, L. 2004, ApJ, 614, L113
- Green, Bailyn & Orosz (2001) Greene, J., Bailyn, C. D., & Orosz, J. A. 2001, ApJ, 554, 1290
- Haba et al. (2008) Haba, Y., Liebmann, A. C., Fukumura, K., 2008, Publ. Astron. Soc. Japan 60, 1257
- Herrero et al. (1995) Herrero, J., et al. 1995, A&A, 297, 556
- Hjellming & Rupen (1995) Hjellming, R.M.,& Rupen, M.P. 1995, Nature, 375,464
- Homan et al. (2006) Homan, J., Wijnands, R., Kong, A., Miller, J. M., Rossi, S., Belloni, T., & Lewin, W. H. G. 2006, MNRAS, 366, 235
- Hynes et al. (2004) Hynes, R. I., Steeghs, D., Casares, J., Charles, P. A., & O’Brien, K. 2004, ApJ, 609, 317
- Kalemci et al. (2005) Kalemci, E., Tomsick, J. A., Buxton, M. M., Rothschild, R. E., Pottschmidt, K., Corbel, S., Brocksopp, C., & Kaaret, P. 2005, ApJ, 622, 508
- Kaspi et al. (2000) Kaspi, S., Smith, P. S., Netzer, H., Maoz, D., Jannuzi, B. T., & Giveon, U. 2000, ApJ, 533, 631
- Klein-Wolt & van der Klis (2008) Klein-Wolt, M., & van der Klis, M. 2008, ApJ, 675, 1407
- Lang (1998) Lang, K. R., 1998, Astrophysical Formulae, (Berlin: Springer)
- Laurent & Titarchuk (2011) Laurent, P. & Titarchuk, L. 2011, ApJ, 727, 34
- Laurent & Titarchuk (1999) Laurent, P. & Titarchuk, L. 1999, ApJ, 511, 289 (LT99)
- Laurent & Titarchuk (2007) Laurent, P. & Titarchuk, L. 2007, ApJ, 656, 1056
- Lobban et al. (2011) Lobban, A. P., Reeves, J. N., Miller, L., 2011, MNRAS, 414, 1965
- McClintock et al. (2007) McClintock, J. E., Remillard, R. A., Rupen, M. P., Torres, M. A. P., Steeghs, D., Levine, A. M., & Orosz, J. A. 2007, ArXiv e-prints, 705, arXiv:0705.1034
- McHardy et al. (2004) McHardy, I. M., Papadakis, I. E., Uttley, P. et al. 2004, MNRAS, 348, 783
- Montanari et al. (2008) Montanari, E., Titarchuk, L. & Frontera, F. 2008, ApJ, accepted, (arXiv:0810.5720)
- Muñoz-Darias et al. (2008) Muñoz-Darias, T., Casares, J., & Martínez-Pais, I. G. 2008, MNRAS, 385, 2205
- Ninkov et al. (1987) Ninkov, Z., Walker, G. A. H., & Yang, S. 1987, ApJ, 321, 425
- Orosz (2003) Orosz, J. A. 2003, in IAU Symp. 212, A Massive Star Odyssey: From Main Sequence to Supernova, ed. K. van der Hucht, A. Herrero, & E. Cesar (San Francisco, CA: ASP), 365
- Orosz et al. (2002) Orosz, J. A., et al. 2002, ApJ, 568, 845
- Orosz et al. (2004) Orosz, J. A., McClintock, J. E., Remillard, R. A., & Corbel, S. 2004, ApJ, 616, 376
- Park et al. (2004) Park, S. Q., et al. 2004, ApJ, 610, 378
- Peterson et al. (2004) Peterson, B. M. et al. 2000 ApJ, 542, 161
- Park et al. (2004) Pounds, K. A. & King, A. R., 2013, MNRAS, 433, 1369
- Remillard & McClintock (2006) Remillard, R. A., & McClintock, J. E. 2006, ARA&A, 44, 49
- Revnivtsev, Gilfanov & Churazov (2000) Revnivtsev, M., Gilfanov, M.,& Churazov, E. 2000, A&A, 363, 1013
- Rhoades & Ruffini (1974) C. E. Rhoades, C.E. Jr. & Ruffini, R., 1974, Phys. Review Letters, 32, 324
- Rodriguez, Corbel & Tomsick (2003) Rodriguez, J., Corbel, S., & Tomsick, J. A. 2003, ApJ, 595, 1032
- Rodriguez et al. (2004) Rodriguez, J., Corbel, S., Kalemci, E., Tomsick, J. A., & Tagger, M. 2004, ApJ, 612, 1018
- Rossi et al. (2004) Rossi, S., Homan, J., Miller, J. M., & Belloni, T. 2004, Nuclear Physics B Proceedings Supplements, 132, 416
- Rybicki & Lightman (1979) Rybicki, G. B., & Lightman, A. P. 1979, Radiative processes in astrophysics, New York, Wiley-Interscience
- Sánchez-Fernández et al. (1999) Sánchez-Fernández, C., et al. 1999, A&A, 348, L9
- Seifina et al. (2017) Seifina, E., Titarchuk, L. & Virgilli, E. 2017, A&A in press
- Seifina et al. (2016) Seifina, E., Titarchuk, L. & Shaposhnikov, N. 2016, ApJ, 821, 23
- Seifina et al. (2015) Seifina, E., Titarchuk, L., Shrader, C. & Shaposhnikov, N. 2015, ApJ, 808, 142
- Seifina et al. (2014) Seifina, E., Titarchuk, L. & Shaposhnikov, N. 2014, ApJ, 789, 57
- Seifina, Titarchuk & Frontera (2013) Seifina, E., Titarchuk, L. & Frontera, F. 2013, ApJ, 766, 63
- Seifina & Titarchuk (2012) Seifina, E. & Titarchuk, L. 2012, ApJ, 747, 99
- Seifina & Titarchuk (2011) Seifina, E. & Titarchuk, L. 2011, ApJ, 738, 128
- Seifina & Titarchuk (2010) Seifina, E. & Titarchuk, L. 2010, ApJ, 722, 586
- Shakura & Sunyaev (1973) Shakura, N.I., & Sunyaev, R.A. 1973, A&A, 24, 337
- Shaposhnikov & Titarchuk (2009) Shaposhnikov, N., & Titarchuk, L. 2009, ApJ, 699, 453 (ST09)
- Shaposhnikov & Titarchuk (2006) Shaposhnikov, N., & Titarchuk, L. 2006, ApJ, 643, 1098 (ST06)
- Shaposhnikov & Titarchuk (2007) Shaposhnikov, N., & Titarchuk, L. 2007, ApJ, 663, 445 (ST07)
- Shaposhnikov & Titarchuk (2008) Shaposhnikov, N., & Titarchuk, L. 2008, AAS/High Energy Astrophysics Division, 10, #01.08
- Shimura & Takahara (1995) Shimura, T., & Takahara, F. 1995, ApJ, 445, 780
- Shrader & Titarchuk (2003) Shrader, C., & Titarchuk, L.G. 2003, ApJ, 598, 168
- Shrader & Titarchuk (1999) Shrader, C., & Titarchuk, L.G. 1999, ApJ, 521, L121
- Sunyaev & Titarchuk (1980) Sunyaev, R.A. & Titarchuk, L.G. 1980, A&A, 86, 121
- Sobczak et al. (1999) Sobczak, G. J., McClintock, J. E., Remillard, R. A., Levine, A. M., Morgan, E. H., Bailyn, C. D., & Orosz, J. A. 1999, ApJ, 517, L121
- Strohmayer et al. (2007) Strohmayer, T. E., Mushotzky, R, Winter, L., Soria, R., Uttley, P., Cropper, accepted for publication in ApJ, astro-ph/0701390
- Terashima et al. (2009) Terashima, Y., Gallo, L. C., Inoue, H., 2009, Publ. Astron. Soc. Japan, 61, S299
- Titarchuk et al. (2001) Titarchuk, L.& Bradshaw, C. F.& Wood, K.S. 2001, ApJ, 560, L55
- Titarchuk & Seifina (2017a) Titarchuk, L.& Seifina, E. 2017a, A&A, 602, A113
- Titarchuk & Seifina (2016a) Titarchuk, L.& Seifina, E. 2016a, A&A, 595, A101
- Titarchuk & Seifina (2016b) Titarchuk, L.& Seifina, E. 2016b, A&A, 585, A94
- Titarchuk et al. (2014) Titarchuk, L., Seifina, E. & Shrader, F. 2014, ApJ, 789, 98
- Titarchuk, Seifina & Frontera (2013) Titarchuk, L., Seifina, E. & Frontera, F. 2013, ApJ, 767, 160
- Titarchuk & Seifina (2009) Titarchuk, L. & Seifina, E. 2009, ApJ, 706, 1463
- Titarchuk, & Fiorito (2004) Titarchuk, L.G. & Fiorito, R. 2004, ApJ, 612, 988 (TF04)
- Titarchuk, Lapidus & Muslimov (1998) Titarchuk, L., Lapidus, I.I. & Muslimov, A. 1998, ApJ, 499, 315 (TLM98)
- Titarchuk & Lyubarskij (1995) Titarchuk, L., & Lyubarskij, Y. 1995, ApJ, 450, 876
- Titarchuk, Mastichiadis & Kylafis (1997) Titarchuk, L., Mastichiadis, A., & Kylafis, N. D., 1997, ApJ, 487, 834
- Titarchuk & Shaposhnikov (2008) Titarchuk, L. & Shaposhnikov, N. 2008, ApJ, 678, 1230
- Titarchuk & Zannias (1998) Titarchuk, L. & Zannias, T. 1998, ApJ, 493, 863
- Trudolyubov (2001) Trudolyubov, S. P. 2001, ApJ, 558, 276
- Trudolyubov, Borozdin & Priedhorsky (2001) Trudolyubov, S. P., Borozdin, K. N., & Priedhorsky, W. C. 2001, MNRAS, 322, 309
- Vaughan et al. (2011) Vaughan, S., Uttley, P., Pounds, K. A., Nandra, K., & Strohmayer, T. E. 2011, arXiv:1101.1802
- Vignarca et al. (2003) Vignarca, F., Migliari, S., Belloni, T., Psaltis, D., & van der Klis, M. 2003, A&A, 397, 729
- Zel’dovich & Shakura (1969) Zel’dovich, Ya. B. & Shakura N. I. 1969, Sov. Astr. 13, 175
- Zurita et al. (2002) Zurita, C., et al. 2002, MNRAS, 334, 999