Detection of a Millimeter Flare From Proxima Centauri
Abstract
We present new analyses of ALMA 12-m and ACA observations at 233 GHz (1.3 mm) of the Proxima Centauri system with sensitivities of 9.5 and 47 Jy beam-1, respectively, taken from 2017 January 21 through 2017 April 25. These analyses reveal that the star underwent a significant flaring event during one of the ACA observations on 2017 March 24. The complete event lasted for approximately 1 minute and reached a peak flux density of mJy, nearly a factor of brighter than the star’s quiescent emission. At the flare peak, the continuum emission is characterized by a steeply falling spectral index with frequency, with , and a lower limit on the fractional linear polarization of . Since the ACA observations do not show any quiescent excess emission, we conclude that there is no need to invoke the presence of a dust belt at AU. We also posit that the slight excess flux density of Jy observed in the 12-m observations compared to the photospheric flux density of Jy extrapolated from infrared wavelengths may be due to coronal heating from continual smaller flares, as is seen for AU Mic, another nearby, well-studied, M dwarf flare star. If this is true, then the need for warm dust at AU is also removed.
1 Introduction
Low mass (i.e., M-type stars) are the most common stars in the Galaxy (e.g., Henry et al., 2006) and have a high frequency of Earth-sized planets both overall and in the habitable zone (Dressing & Charbonneau, 2015). However, there is debate as to what extent planets around M dwarfs would be amenable to developing and sustaining life. Late M-type stars, in particular, have long pre-main sequence phases during which the stellar luminosity can change significantly, as well as high stellar activity throughout their entire lifetimes (e.g., Hawley et al., 1997; Shkolnik et al., 2014; France et al., 2016).
Proxima Centauri has garnered tremendous recent interest due to the radial velocity detection of a potentially Earth-mass planet within the habitable zone (Anglada-Escudé et al., 2016) and a new candidate transit event (Li et al., 2017). At a distance of only 1.3 pc (van Leeuwen, 2007), Proxima Centauri b (, AU) is the closest extrasolar planet to the Solar System. However, Proxima Centauri (spectral type M5.5V) has long been known as a flare star (e.g., Thackeray, 1950). Already, many studies have examined the effect that its variability may have on the properties of its planet (Garraffo et al., 2016; Dong et al., 2017; Lingam & Loeb, 2017; Ribas et al., 2017; Zahnle & Catling, 2017).
Here, we present a new analysis of 233 GHz (1.3 mm) observations using the ALMA 12-m array and Atacama Compact Array (ACA) that were originally published in Anglada et al. (2017). In §2 we briefly summarize the relevant observations, followed by the results of our analysis for the ALMA 12-m and ACA observations in §3.1 and §3.2, respectively. We discuss the implications of these results for stellar emission mechanisms in §4.1 and the dust belts proposed by Anglada et al. (2017) in §4.2. In §5, we present our conclusions.
2 Observations
Proxima Centauri was observed with ALMA at 233 GHz (1.3 mm) from 2017 January 21 through 2017 April 25 (PI: Anglada, 2016.A.00013.S), and the observations were published in Anglada et al. (2017). Between January and April, the target was observed a total of 15 times, 1.3 hour scheduling blocks (SBs) using the full 12-m array (41 antennas) and 1.6 hour SBs using the ACA (8–11 7-m antennas). During all of these observations, the target was observed in 6.58 minute integrations alternating with observations of a phase calibrator, either J1424–6807 or J1329–5608 ( and away from the target, respectively). Several sources were used for both absolute flux calibration (Ganymede, Callisto, Titan, J1427−4206, and J1517−2422) and bandpass calibration (J1427−4206 and J1924−2914). Overall, the weather was very good during these observations with precipitable water vapor (PWV) ranging between mm. The correlator was set-up to maximize continuum sensitivity with four spectral windows centered at 225, 227, 239 and 241 GHz. Each spectral window has an effective bandwidth of 1.875 GHz split into 120 channels for a total bandwidth of 7.5 GHz. Additional discussion of these observations can be found in Anglada et al. (2017). We obtained the raw data from the ALMA archive and generated calibrated measurement sets in CASA (Petry & CASA Development Team, 2012, version 4.7.0 for the ACA data, and 4.7.2 for the 12-m array) using the scripts provided. All continuum images were produced using the clean task in CASA, which inverts the millimeter visibilities to produce deconvolved images.
3 Results and Analysis
3.1 ALMA 12-m Observations
Figure 1 (leftmost panel) shows the natural weight continuum image produced by combining both ALMA 12-m array observations. With natural weighting, the rms noise in the image is Jy beam-1, and the beam size is ( AU, position angle ). An unresolved source is detected at the center of the image with a significance of . Fitting a point source model to the visibilities using the CASA task uvmodelfit yields a total flux density of Jy, consistent with the result of Jy reported by Anglada et al. (2017). Any difference in flux density likely results from the fact that we fit to the millimeter visibilities, while Anglada et al. (2017) perform all of their fits in the image domain. The two middle panels of Figure 1 show the images that result from imaging each observation individually. The rms noise is 13 Jy beam-1 and 14 Jy beam-1 for SB 1 and SB 2, respectively. Both images show a central point source with measured flux density of Jy and Jy, respectively, consistent with each other within the uncertainties. For comparison, the expected photospheric flux at 1.3 mm is Jy, obtained by extrapolating the emission model derived by Ribas et al. (2017) through a fit to the stellar Spectral Energy Distribution (SED).
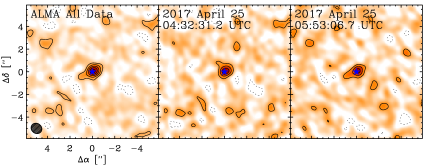
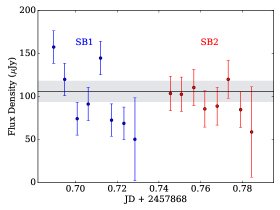
Both ALMA 12-m SBs were executed on 2017 April 25 between 04:32:31.2–06:50:33.4 UTC. A total of 16 (8 in each SB) on-source integrations or ‘scans’ were performed during this period, each with a duration of 6.58 minutes. We fit point source models to the millimeter visibilities in each scan independently to constrain any variability in the point source flux density. The resulting light curve is shown in Figure 1 (right panel). We note that the final scan in each SB was only 1.01 minutes in duration, resulting in substantially larger uncertainty. There is some variation in flux density between successive scans, ranging between Jy at maximum to Jy at minimum. The standard deviation for these data is Jy, and none of the individual scans have a flux density that differs from the mean by more than . We calculate the normalized ‘excess variance,’ following Nadra et al. (1997), where is the number of data points, is the unweighted mean, and are the measured flux densities for each scan with errors . For these data, .
The observations include two linear polarizations (XX and YY) and span GHz in total frequency between GHz, which allows us to determine a lower limit on the fractional linear polarization and a spectral index for the detected point source. Combining both observations together, but imaging the XX and YY polarizations separately, yields total flux densities of Jy and Jy. Given this, we can calculate the magnitude of the Stokes parameter as a fraction of the Stokes to be , consistent with zero. Since there are no polarization calibration and cross products available for these observations, provides only a lower limit on the fractional linear polarization. To calculate the spectral index, we determine the flux density of the point source detected in the combined image for the GHz and GHz spectral windows separately, yielding values of Jy and Jy, respectively. The resulting spectral index is , where . Within the significant errors, this result is consistent with blackbody emission in the Rayleigh-Jeans regime as expected for a quiescent stellar photosphere.
3.2 Atacama Compact Array (ACA) Observations
Figure 2 (leftmost panel) shows the natural weight continuum image resulting from combining all 13 observations taken with the ACA between 2017 January 21 and 2017 March 24. The rms noise is Jy beam-1, and the beam size is ( AU, position angle ). An unresolved point source with flux density Jy () is detected, in agreement with the value of Jy from Anglada et al. (2017), with the small difference again likely stemming from the choice in fitting to the visibilities rather than the image. As with the 12-m data, we examined all 13 observations individually to explore the possibility of variability in the point source flux. No sources above were detected in any of the first 12 observations (even when binned in 30 second intervals that should reveal short flares), and we show the natural weight image produced by averaging these datasets in Figure 2 (left middle panel). The image is essentially noise-like; however, the central peak could indicate the occurrence of small flares below the detection threshold of these observations. Given the rms noise in this image, Jy beam-1, a point source with the measured ALMA 12-m flux density of Jy would not have been detected. Figure 2 (right middle panel) shows an image of only the final observations executed on 2017 March 24 from 06:36:30.1–08:10:27.2 UTC with an rms noise level of Jy beam-1. In this final image, a bright central source is clearly seen at the stellar position with a flux density of mJy ().
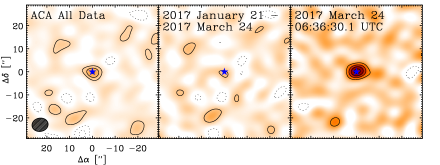
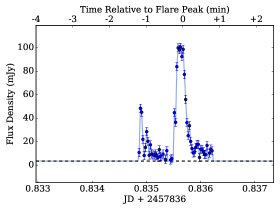
It is clear from this analysis that the point source seen in the combined ACA image is dominated by a transient event that occurred during the final observation on 2017 March 24. During this complete observation, a total of 7 on-source scans of 6.58 minutes each were executed. The central point source is only visible in the second to last scan. In order to better constrain the time variable nature of this observed source, we fit models to the visibilities in this scan in 2 second intervals using uvmodelfit in CASA. These fits are point-like with respect to the size of the synthesized beam, ( AU). The resulting light curve is shown in Figure 2 (right panel). Several small peaks in flux density occur starting at JD 2457836.8349 followed by a steep rise in brightness at JD 2457836.8355 and an exponential fall-off. This steep rise and more gradual fall-off is characteristic of flares from Proxima Centauri observed at other wavelengths (e.g., Kowalski et al., 2016). At peak brightness, the flux density reaches mJy or a luminosity of erg s-1 Hz-1 at 1.3 pc, a factor of nearly brighter than during quiescence as measured in the ALMA 12-m observations. The complete transient event lasts for approximately 1 minute in total (FWHM of 30 seconds) before the source fades away below the noise level. We do not detect any variability in the calibrator flux densities when imaged on similar timescales.
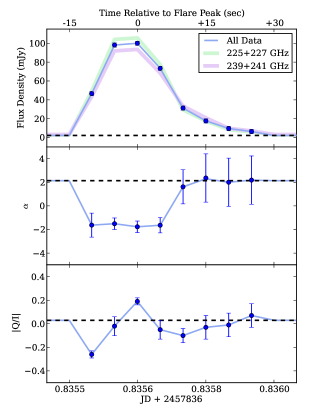
As with the 12-m data, we can examine whether there is any change in the spectral index and polarization during the detected flare. Figure 3 shows the flux density, spectral index as a function of frequency (), and lower limit on the fractional linear polarization () during the course of the flare binned in 5 second intervals to improve signal-to-noise. As above, we calculate the spectral index between the GHz and GHz spectral windows (plotted separately in Figure 3 as the green and purple thick lines, respectively). During the flare, the spectral index becomes negative, with a minimum value of and an average value of . During the initial steep rise in flux density, the lower limit on the fractional linear polarization given by . At the peak, the sign flips to positive values, , before returning to zero as the flux density declines. Both and differ significantly from the ‘quiescent’ values determined from the 12-m ALMA data by , indicating a change in the source of the emission during the flaring event. Since we only have a lower limit, the origin of the changing value is unclear from these observations. Slee et al. (2003) detected significant right circular polarization during a flare from Proxima Centauri at 1.38 GHz, which they attribute to either plasma emission or electron–cyclotron maser emission. The signal-to-noise of the ‘pre-flare’ at JD 2457836.8349 is not high enough to allow us to do the same analysis for this smaller event.
4 Discussion
4.1 Nature of the Detected Stellar Flare
Proxima Centauri is known to undergo frequent X-ray flares at the rate of one large event ( quiescent level) every few days (Haisch et al., 1983; Güdel et al., 2002, 2004; Fuhrmeister et al., 2011; Kowalski et al., 2016). Güdel et al. (2004) observed the star for 65 ks with XMM-Newton and caught a large X-ray flare with a peak luminosity of erg s-1 and total X-ray energy of erg that lasted for minutes. Low-level X-ray variability from small flares is observed continually. Visual wavelength flares occur at a similar rate of several per day (Davenport et al., 2016). By extrapolating the flare energy frequency distribution, Davenport et al. (2016) estimate that Proxima Centauri might display visual flares each year with energy erg.
Stellar flares are typically associated with magnetic reconnection events. Late type stars such as Proxima Centauri are fully convective and have high surface magnetic fields (Reiners & Basri, 2008). X-ray observations suggest that Proxima Centauri’s coronal flares are similar in temperature and density to those on the Sun, while also exhibiting the Neupert effect (Fuhrmeister et al., 2011). In the standard model of solar and stellar flares, a release of magnetic energy accelerates electrons that then impinge on hot ionized gas in the surrounding plasma. The flare produces emission across the entire electromagnetic spectrum: thermal X-rays from gas at 107 K, thermal bremsstrahllung (free-free) radiation at optical to radio wavelengths, and gyrosynchrotron emission in the radio. The observed slow decay depends on the cooling mechanism, and the timescale is typically set by the optical depth of the flare region. In principle, the shape and energy of the flare can be used to measure the emission mechanism, electron density, and size/optical depth of the emitting region.
Flares from M dwarf stars have not previously been well-studied at (sub)millimeter wavelengths. However, RS CVn binaries have been known to exhibit large millimeter flares (Brown & Brown, 2006; Beasley & Bastian, 1998; Massi et al., 2006). Millimeter emission has also been detected in solar flares. These events are associated with extreme X-ray emission (class X6 and above), have durations of minutes, and have positive spectral indices with frequency that range from 0.3–5 (Krucker et al., 2013). Even for the Sun, the origin of this emission is unclear since both free-free and gyrosynchrotron emission fail to reproduce the correct slope and X-ray fluxes given reasonable assumptions for the size and optical depth of the emission region. Two possible emission mechanisms are synchrotron emission from ultra-relativistic electrons or an extreme-IR thermal extension of the heated chromosphere at 10,000 K. The maximum (sub)millimeter flux density of a solar flare observed by Krucker et al. (2013) is Jy corresponding to a luminosity of erg s-1 Hz-1. The peak luminosity of the observed Proxima Centauri flare, erg s-1 Hz-1, is a factor of larger. Furthermore, the observed spectral index, , is quite steep (modulo the significant uncertainty) and contradictory to the observations of solar flares that instead suggest a rising (positive) spectral index (). This spectral index may indicate that we are seeing the optically thin part of the gyrosynchrotron spectrum, where the power-law index of non-thermal electrons, , can be inferred from : (Dulk, 1985; Osten et al., 2016). From the observed spectral index, we can determine , within the range of expected for relatively hard radio spectra. Given the anomalous nature of this flaring event and the fact that observations are only available in a narrow wavelength range, it is difficult to definitively constrain the nature of the emission mechanism. Future observations at longer radio ( cm) wavelengths, near the expected peak of gyrosynchrotron emission, with the frequency resolution possible with the Australia Telescope Compact Array (ATCA) or ACA along with coincident X-ray measurements are needed to better understand this new flaring regime.
4.2 New Constraints on Dust Emission
Anglada et al. (2017) propose a system of three dust belts to explain the ALMA 12-m and ACA observations of Proxima Centauri: (1) warm dust at AU, (2) a cold belt from AU, and (3) an outer belt at AU. They note that the warm dust (1) and outer belt (3) are marginal detections, while only the cold belt (2) is detected with confidence. The warm dust is inferred from the Jy difference between the stellar photosphere and the total flux density of the 12-m image. The cold belt is inferred from the Jy apparent flux difference between the expected photospheric contribution and the total flux density measured in the ACA image. The outer belt position and geometry are determined by averaging the observed millimeter emission in elliptical annuli centered on the star. Given that our reanalysis of the data reveals that Proxima Centauri experienced a significant flaring event during the ACA observations, the hypothesis of dust emission from at least belts (1) and (2) must be re-examined.
It is clear from our analysis that the entirety of the 1.3 mm emission detected by the ACA results from the short duration stellar flare. No emission is detected above a level during quiescence (see Figure 2). This flare reaches a peak flux density of mJy, but lasts for only minute. When averaged together with the remaining hours of non-detections, this transient event appeared as the Jy source detected by Anglada et al. (2017). Without the detection of a quiescent excess, there is no need to posit the cold belt at AU.
Given the high level of stellar activity displayed by Proxima Centauri, the Jy excess detected by the 12-m observations could also be plausibly explained by stellar emission. The quiescent X-ray luminosity of the star varies by at least a factor of a few, and small X-ray and optical flares are observed frequently (Fuhrmeister et al., 2011; Güdel et al., 2004). Thus, it is reasonable to assume that Proxima Centauri may also undergo many small radio flares. If we assume that small flares have a flat spectrum at millimeter wavelengths, which likely overestimates the luminosity of the emission if it has the spectral index of thermal bremsstrahlung, then the 1.3 mm excess of Jy measured by the 12-m array yields a quiescent millimeter luminosity of 1021 erg s-1 or less than the bolometric luminosity of the star. The peak seen in the first 12 ACA observations (Figure 2) at the expected stellar position could also indicate some weak flare emission during these observations. If the observed 12-m array excess is indeed due to low-level flaring activity, then there is no evidence for any warm dust emission at AU. Coronal emission at millimeter wavelengths has been observed for other M dwarf stars including AU Mic, which hosts a resolved cold debris disk at AU and exhibits continual quiescent 1.3 mm emission in excess of expected photospheric levels and variable 9 mm emission (MacGregor et al., 2016). Models of time-averaged turbulent coronal heating (which exhibits flare-like bursts in simulations) result in thermal bremsstrahlung sufficient to explain both the 9 mm variability and 1.3 mm emission, as well as the observed X-ray emission (Cranmer et al., 2013; MacGregor et al., 2016). The quiescent millimeter emission from AU Mic is considerably larger, however, with a 1.3 mm flux density 6 the photospheric level and 10 the excess observed from Proxima Centauri (MacGregor et al., 2013). To support the claim of an inner warm disk, Anglada et al. (2017) also note a slight elongation of the 12-m central source along a position angle of . Our fits to the millimeter visibilities using uvmodelfit in CASA are consistent with a point source, and do not suggest that this source is spatially resolved. Any elongation of the central source is at a level in our natural weight images and varies between the two observations (see Figure 1).
The outer disk at AU is posited by Anglada et al. (2017) from several additional peaks in the ACA image that contribute to an azimuthally summed flux density of mJy. We find that the ACA visibilities do not adequately cover the short spatial frequencies needed to measure the total disk flux density and make it impossible to robustly constrain the disk geometry. Additional observations are needed to test the veracity of this detection. The possibility of contamination must also be considered. Each of the peaks that contribute to the putative disk have a flux density of Jy. Deep ALMA surveys at millimeter wavelengths have placed strong constraints on the expected number of faint background sources in an image (Carniani et al., 2015) that agree with results from cosmological simulations (Shimizu et al., 2012; Cai et al., 2013). Given the differential source counts at 1.3 mm, the number of sources with flux density Jy that are expected within the ACA primary beam (FWHM) is , a not insignificant number. In addition, Proxima Centauri sits close to the Galactic plane (latitude ) in a region of high background cirrus, which made it impossible for Spitzer to provide an upper limit on the source flux density at 60 m (Gautier et al., 2007). Between possible extragalactic background and Galactic sources, it will be difficult to detect or image the proposed extended disk.
5 Conclusions
We present new analyses of ALMA 12-m and ACA observations at 233 GHz (1.3 mm) of the Proxima Centauri system. The ALMA 12-m observations reveal a central emission peak consistent with a point source with flux density Jy. During the ACA observations, the star underwent a significant flaring event, reaching a peak flux density of mJy, nearly a factor of brighter than during the 12-m observations. At the flare peak, the 1.3 mm continuum emission is characterized by a steeply falling spectral index with frequency, with , and a lower limit on the fractional linear polarization, . This detection of an M dwarf flare at millimeter wavelengths, opens a new observational window on the mechanisms responsible for stellar flares. Additional observations at radio through X-ray wavelengths of M dwarf flares from Proxima Centauri and other systems are needed to better understand the properties of such flares and their implications for the habitability of exoplanets in these systems.
The quiescent emission detected by the sensitive 12-m array observations lies below the detection threshold of the ACA observations, and the only ACA detection of Proxima Centauri is during a series of small flares followed by a stronger flare of minute duration. Due to the clear transient nature of this event, we conclude that there is no need to invoke the presence of an inner dust belt at AU. It is also likely that the slight excess above the expected photosphere observed in the 12-m observations is due to coronal heating from continual smaller flares, as is seen for AU Mic, another active M dwarf that hosts a well-resolved debris disk. If that is the case, then the need to include warm dust emission at AU is removed. Although the detection of a flare does not immediately impact the claim of an outer belt at AU, the significant number of background sources expected in the image and known high level of background cirrus suggest that caution should be used in over-interpreting this marginal result.
The authors thank the anonymous referee for helpful suggestions that improved this manuscript. M.A.M. acknowledges support from a National Science Foundation Astronomy and Astrophysics Postdoctoral Fellowship under Award No. 1701406. This paper makes use of the following ALMA data: ADS/JAO.ALMA #2016.A.00013.S. ALMA is a partnership of ESO (representing its member states), NSF (USA) and NINS (Japan), together with NRC (Canada) and NSC and ASIAA (Taiwan) and KASI (Republic of Korea), in cooperation with the Republic of Chile. The Joint ALMA Observatory is operated by ESO, AUI/NRAO and NAOJ. The National Radio Astronomy Observatory is a facility of the National Science Foundation operated under cooperative agreement by Associated Universities, Inc.
References
- Anglada et al. (2017) Anglada, G., Amado, P. J., Ortiz, J. L., et al. 2017, ApJL, 850, L6
- Anglada-Escudé et al. (2016) Anglada-Escudé, G., Amado, P. J., Barnes, J., et al. 2016, Nature, 536, 437
- Beasley & Bastian (1998) Beasley, A. J. & Bastian, T. S. 1998, in Astronomical Society of the Pacific Conference Series, Vol. 144, IAU Colloq. 164: Radio Emission from Galactic and Extragalactic Compact Sources, ed. J. A. Zensus, G. B. Taylor, & J. M. Wrobel, 321
- Brown & Brown (2006) Brown, J. M. & Brown, A. 2006, ApJL, 638, L37
- Cai et al. (2013) Cai, Z.-Y., Lapi, A., Xia, J.-Q., et al. 2013, ApJ, 768, 21
- Carniani et al. (2015) Carniani, S., Maiolino, R., De Zotti, G., et al. 2015, A&A, 584, A78
- Cranmer et al. (2013) Cranmer, S. R., Wilner, D. J., & MacGregor, M. A. 2013, ApJ, 772, 149
- Davenport et al. (2016) Davenport, J. R. A., Kipping, D. M., Sasselov, D., Matthews, J. M., & Cameron, C. 2016, ApJL, 829, L31
- Dong et al. (2017) Dong, C., Lingam, M., Ma, Y., & Cohen, O. 2017, ApJL, 837, L26
- Dressing & Charbonneau (2015) Dressing, C. D. & Charbonneau, D. 2015, ApJ, 807, 45
- Dulk (1985) Dulk, G. A. 1985, ARA&A, 23, 169
- France et al. (2016) France, K., Parke Loyd, R. O., Youngblood, A., et al. 2016, ApJ, 820, 89
- Fuhrmeister et al. (2011) Fuhrmeister, B., Lalitha, S., Poppenhaeger, K., et al. 2011, A&A, 534, A133
- Garraffo et al. (2016) Garraffo, C., Drake, J. J., & Cohen, O. 2016, ApJL, 833, L4
- Gautier et al. (2007) Gautier, T. N., Rieke, G. H., Stansberry, J., et al. 2007, ApJ, 667, 527
- Güdel et al. (2004) Güdel, M., Audard, M., Reale, F., Skinner, S. L., & Linsky, J. L. 2004, A&A, 416, 713
- Güdel et al. (2002) Güdel, M., Audard, M., Skinner, S. L., & Horvath, M. I. 2002, ApJL, 580, L73
- Haisch et al. (1983) Haisch, B. M., Linsky, J. L., Bornmann, P. L., et al. 1983, ApJ, 267, 280
- Hawley et al. (1997) Hawley, S. L., Gizis, J. E., & Reid, N. I. 1997, AJ, 113, 1458
- Henry et al. (2006) Henry, T. J., Jao, W.-C., Subasavage, J. P., et al. 2006, AJ, 132, 2360
- Kowalski et al. (2016) Kowalski, A. F., Mathioudakis, M., Hawley, S. L., et al. 2016, ApJ, 820, 95
- Krucker et al. (2013) Krucker, S., Giménez de Castro, C. G., Hudson, H. S., et al. 2013, A&A Rv, 21, 58
- Li et al. (2017) Li, Y., Stefansson, G., Robertson, P., et al. 2017, ArXiv e-prints, arXiv:1712.04483
- Lingam & Loeb (2017) Lingam, M. & Loeb, A. 2017, ApJL, 846, L21
- MacGregor et al. (2013) MacGregor, M. A., Wilner, D. J., Rosenfeld, K. A., et al. 2013, ApJ, 762, L21
- MacGregor et al. (2016) MacGregor, M. A., Wilner, D. J., Chandler, C., et al. 2016, ApJ, 823, 79
- Massi et al. (2006) Massi, M., Forbrich, J., Menten, K. M., et al. 2006, A&A, 453, 959
- Nadra et al. (1997) Nadra, K., George, I. M., Mushotzky, R. F., et al. 1997, ApJ, 476, 70
- Osten et al. (2016) Osten, R. A., Kowalski, A., Drake, S. A., et al. 2016, ApJ, 832, 174
- Petry & CASA Development Team (2012) Petry, D. & CASA Development Team. 2012, in Astronomical Society of the Pacific Conference Series, Vol. 461, Astronomical Data Analysis Software and Systems XXI, ed. P. Ballester, D. Egret, & N. P. F. Lorente, 849
- Reiners & Basri (2008) Reiners, A. & Basri, G. 2008, A&A, 489, L45
- Ribas et al. (2017) Ribas, I., Gregg, M. D., Boyajian, T. S., & Bolmont, E. 2017, A&A, 603, A58
- Shkolnik et al. (2014) Shkolnik, E. L. & Barman, T. S. 2014, AJ, 148, 64
- Shimizu et al. (2012) Shimizu, I., Yoshida, N., & Okamoto, T. 2012, MNRAS, 427, 2866
- Slee et al. (2003) Slee, O. B., Willes, A. J., & Robinson, R. D. 2003, PASA, 20, 257
- Thackeray (1950) Thackeray, A. D. 1950, Monthly Notes of the Astronomical Society of South Africa, 9, 9
- van Leeuwen (2007) van Leeuwen, F. 2007, A&A, 474, 653
- Zahnle & Catling (2017) Zahnle, K. J. & Catling, D. C. 2017, ApJ, 843, 122