From Octopus to Dendrite - Semiflexible Polyelectrolyte Brush Condensates in Trivalent Counterion Solution
Abstract
Interplay between counterion-mediated interaction and stiffness inherent to polymer chain can bring substantial complexity to the morphology and dynamics of polyelectrolyte brush condensates. Trivalent counterions induce collapse of flexible polyelectrolyte brushes, over a certain range of grafting density, into octopus-like surface micelles; however, if individual chains are rigid enough, the ion-mediated local nematic ordering assembles the brush chains into fractal-like dendritic condensates whose relaxation dynamics is significantly slower than that in the surface micelles. Notably, the trivalent ions condensed in the dendritic condensates are highly mobile displaying quasi-one-dimensional diffusion in parallel along the dendritic branches. Our findings in this study are potentially of great significance to understanding the response of cellular organization such as chromosomes and charged polysaccharides on membranes to the change in ionic environment.
I Introduction
Responses of polyelectrolytes (PEs) to the changes in ionic environment and chain stiffness have been extensively studied in polymer sciences Oosawa (1971); Skolnick and Fixman (1977); Barrat and Joanny (1993); Ha and Thirumalai (1995); Schiessel (1999). However, new discoveries on the properties of PE are still being made through studies on biopolymers Caliskan et al. (2005); Moghaddam et al. (2009); Liu and Hyeon (2016); Emanuel et al. (2009). Also under active investigation are the effects of other variables and constraints on the higher order organization and dynamics of PE found in biological systems Needleman et al. (2004); Hud and Vilfan (2005); Kang et al. (2015).
Demonstrated in both experiments and computational studies Martin et al. (2000); Vilfan et al. (2006); Stevens (2001); Lee and Thirumalai (2001); Ou and Muthukumar (2005); Seaton et al. (2013); Hoang et al. (2014), even the conformational adaptation of a single PE chain can be highly complex. Whereas flexible PE chains form compact globules in the presence of counterions Schiessel (1999), the same condition drives semiflexible PE chains (e.g., dsDNA) to toroidal conformations or metastable rod-like bundles comprised of varying number of racquet structures. Geometrical constraints such as confinement Morrison and Thirumalai (2009); Spakowitz and Wang (2003) and increasing density of PE could add another level of complexity to the system. For example, DNA chain in a viral capsid or nuclear envelope adopts a densely packed structure with the swelling due to the volume exclusion being suppressed by the confinement and counterions Hud and Downing (2001); Leforestier (2013); Berndsen et al. (2014); Kang et al. (2015). Further, statistically distinct conformations of DNA emerge depending on the amount and type of counterions being added Allahverdi et al. (2015); Yoo et al. (2016).
PE brush Pincus (1991); Israels et al. (1994), a spatial organization with one end of many PE chains densely grafted to 2D surface, is another system of interest to be studied. In particular, the novel functions and adaptability discovered in biopolymer brush Zappone et al. (2007) deserve much attention. For example, brush layer of hyaluronic acid, a negatively charged flexible polysaccharide molecule serving as a main component of the extracellular matrix Attili, Borisov, and Richter (2012), modulates the interaction between cells and their environment Cohen et al. (2004). The brush of Ki-67, a disordered protein bearing a large positive net charge, found on the surface of mitotic chromosomes prevents aggregation of chromosomes Cuylen et al. (2016).
Morphology of a polymer brush condensed in poor solvent has been studied by using theories and simulations for decades Lai and Binder (1992); Grest and Murat (1993); D.R.M. Williams (1993); Zhulina, Singh, and Balazs (1998); Pattanayek, Pham, and Pereira (2005); Carrillo and Dobrynin (2009); Tagliazucchi, de la Cruz, and Szleifer (2010); He, Merlitz, and Sommer (2014); Lappala, Mendiratta, and Terentjev (2015). Depending on the chain stiffness, brush condensates adopt diverse morphological patterns that vary from semi-spherical octopus-like micelle domains to cylindrical bundles of rigid chains which protrude from the grafting surface. It was shown that when the grafting density is in a proper range, multivalent counterions can collapse flexible PE brush even in good solvent into octopus-like surface micelles displaying substantial lateral heterogeneity Brettmann et al. (2016); Liu, Pincus, and Hyeon (2017); Jackson et al. (2017), which has recently been confirmed experimentally for polystyrene sulfonate brush condensates in \ceY(NO_3)_3 solution Yu et al. (2017).
However, we note that the aforementioned studies on the formation of surface micelles from ion-induced collapse of PE brush are still at odds with the findings by Bracha et al. Bracha and Bar-Ziv (2014) which reported fractal-like dendrite domains as a result of multivalent counterion (\ceSpd^3+) induced collapse of DNA brush. Although the previous studies on flexible PE brush Brettmann et al. (2016); Liu, Pincus, and Hyeon (2017); Jackson et al. (2017) captured a number of essential features reported by Bracha et al. Bracha and Bar-Ziv (2014), qualitative difference in the morphology of brush condensate still exists, thus requiring further investigation. To our knowledge, PE brush condensates with dendritic morphology remain unexplored both in theory and computation. To this end, we extended our former work Liu, Pincus, and Hyeon (2017) to scrutinize the effect of semiflexibility of PE chain on the brush morphology and dynamics in trivalent counterion solution.
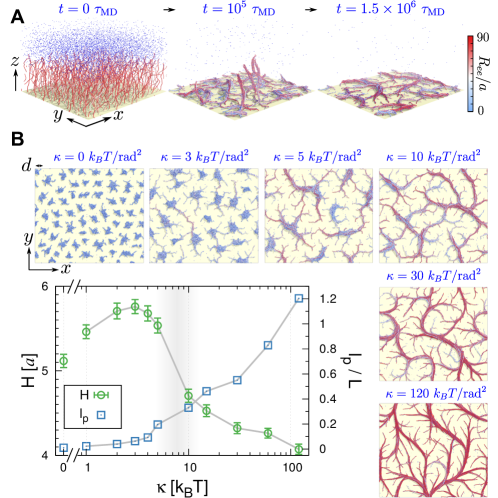
In this study, we adapted a well tested coarse-grained model of strong polyelectrolyte PE brush Csajka and Seidel (2000); Crozier and Stevens (2003); Guptha and Hsiao (2014); Liu, Pincus, and Hyeon (2017). As shown in Fig. 1A, total PE chains were grafted to the triangular lattice on uncharged surface. Each PE chain consists of negatively charged monomers and a neutral terminal monomer grafted to the surface. The lattice spacing was selected to ensure the lateral overlap between neighboring chains. The rigidity of PE chains was adjusted by varying the bending rigidity parameter . We added trivalent salts to the pre-equlibrated PE brush in salt-free condition, and induced the collapse into brush condensate. Details of the model and simulation methods are given in Model and Methods. The results of this work are organized such that we first address the overall morphology of brush condensate under 1:3 stoichiometric condition of trivalent counterion with respect to a monovalent charge on each monomer. Next, the local structure of brush chain is characterized by exploiting the liquid crystal order parameters. Finally, we investigate the dynamics of brush condensates and of condensed counterion at varying by calculating the intermediate scattering function.
II Results
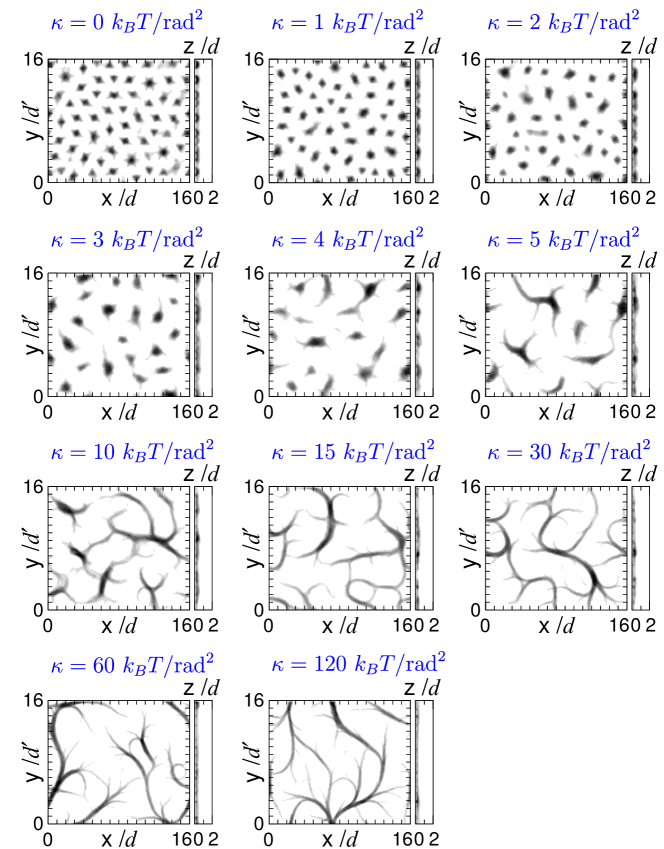
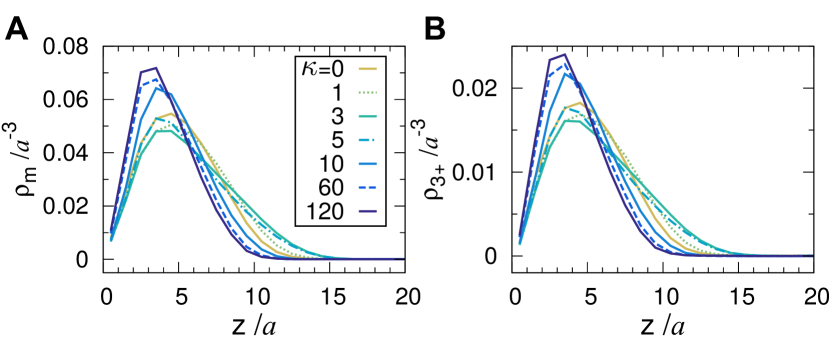
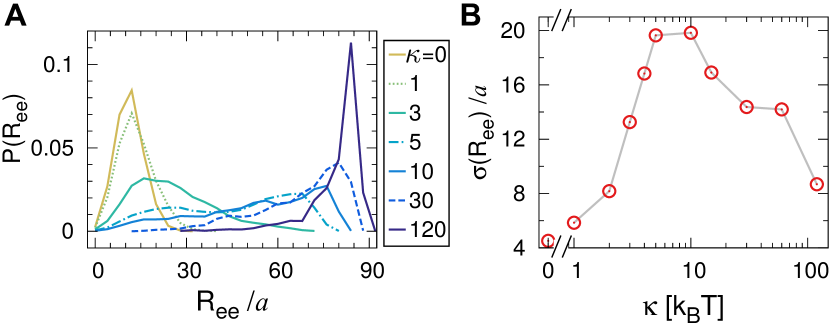
Morphology of brush condensates. Regardless of the value of , the PE brush fully collapses onto the grafting surface due to the osmotic pressure of ions, which differs from neutral semiflexible polymer brushes or salt-free PE brushes in poor solvent where the aggregated bundles protrude out of the grafting surface Benetatos, Terentjev, and Zippelius (2013); Carrillo and Dobrynin (2009); He, Merlitz, and Sommer (2014). The morphology of the condensate depends critically on (Fig. 1B). (i) For small ( , ), the PE brush forms octopus-like surface micelle domains demarcated by the chain-depleted grain boundaries. The average height of the brush increases with ( ). So does the surface area of the domain projected onto the -plane (see also Fig. S1). (ii) For large ( , ), the condensed chains are organized into a dendritic assembly. Neighboring chains are assembled together, forming axially coaligned branches of varying thickness. The density of chain monomer slightly increases as the chain gets stiffer (see Fig. S2A), which reduces brush height. It is also noted that the end-to-end distance of the collapsed polymers, color-coded from blue to red for individual chains, displays the broadest distribution at an intermediate stiffness , which indicates that the conformational ensemble displays the most heterogeneous distribution in this range of (see also Fig. S3A,B).
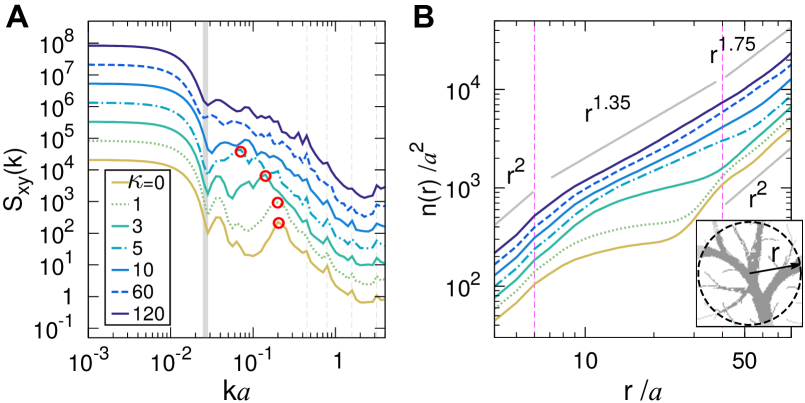
To quantify the in-plane lateral configuration of the brush, we calculated the 2D static structure factor
| (1) |
where is the total number of non-grafted chain monomers, is the position of the -th monomer, and is a 2D wave vector in the plane. is evaluated by first integrating over the space of , followed by averaging over the ensemble of MD trajectories. exhibits distinct profiles when is varied (Fig. 2A). For octopus-like micelles, there is a primary peak (indicated by red circles) characterizing the size (area) of the domain, whose position shifts to a smaller wave number as increases, indicating that the domain size grows with . However, this peak gradually vanishes as the stiffness of chain is increased. The absence of the peak in is due to the morphological transition from the finite-sized surface micelles to the scale-free dendritic assembly.
To quantify the dendritic patterns in 2D, we further analyzed their fractal dimensions . We divide the grafting surface into square lattices with each cell size of . When at least one chain monomer is present in a cell, the cell contributes to the “area” of the condensate. The area of dendritic pattern within a radius is , where is the Heaviside step function, , and is the distance of the cell from a center of high monomer density. was obtained by averaging over the cells with the five highest monomer density in each snapshot.
scales as , and the value of the scaling exponent varies at different length scale (Fig. 2B). (i) In the range of , for brushes of rigid chains, whereas for flexible brushes. The transition from micelle domain with finite size () to scale-free dendritic assembly () is observed at (see Fig. 1B). (ii) At , for rigid brushes ( ), and for flexible brushes ( ). The scaling exponent arises when the monomer is uniformly distributed on the surface such that the density of condensates is constant with respect to . Unlike the octopus-like micelles surrounded by the chain-depleted zone, the dendritic condensate percolates over the entire surface. Analyzing fluorescence images of dendritic condensate of dsDNA brush through a similar method Bracha and Bar-Ziv (2014), Bracha et al. reported .
Another quantity often being used to address the fractality is the 2D version of radial distribution function,
defined as .
scales as in a fractal aggregate of dimension Sander (1986); Nicolás-Carlock, Carrillo-Estrada, and Dossetti (2016, 2017).
Consistent with the analysis of ,
of chain monomers indeed follows a scaling in the intermediate range of when is large (Fig. S4C).
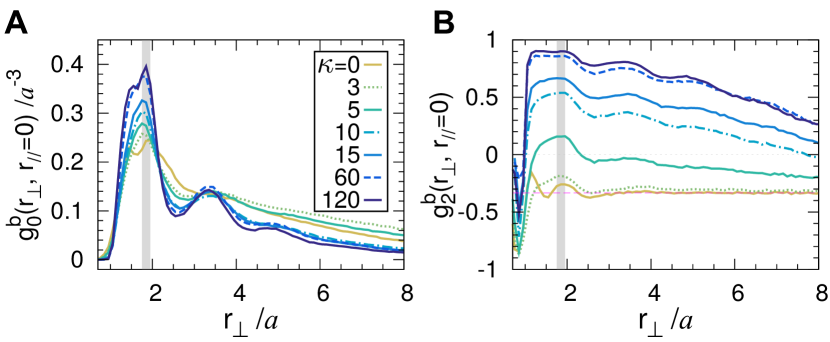
Local chain organization. The local structure of chains in the brush condensates also changes with (see the insets of Fig. 3A). When chains are flexible, the adjacent chains condensed to the same micelle appear highly entangled. It is not visually clear whether two monomers close in space are in the same chain or in different chains. In contrast, when chains are rigid, they are parallelly aligned, and the strong orientational correlation between consecutive bonds allows us to easily discern one chain from another. To characterize the local ordering of polymer segments in the collapsed brush, we employed the liquid crystal order parameter Frenkel and Eppenga (1985); Bates and Frenkel (2000). For any two consecutive monomers in the same chain, a unit bond vector is defined by its orientation , and its position . The radial distribution of such two bond vectors can be evaluated as
| (2) |
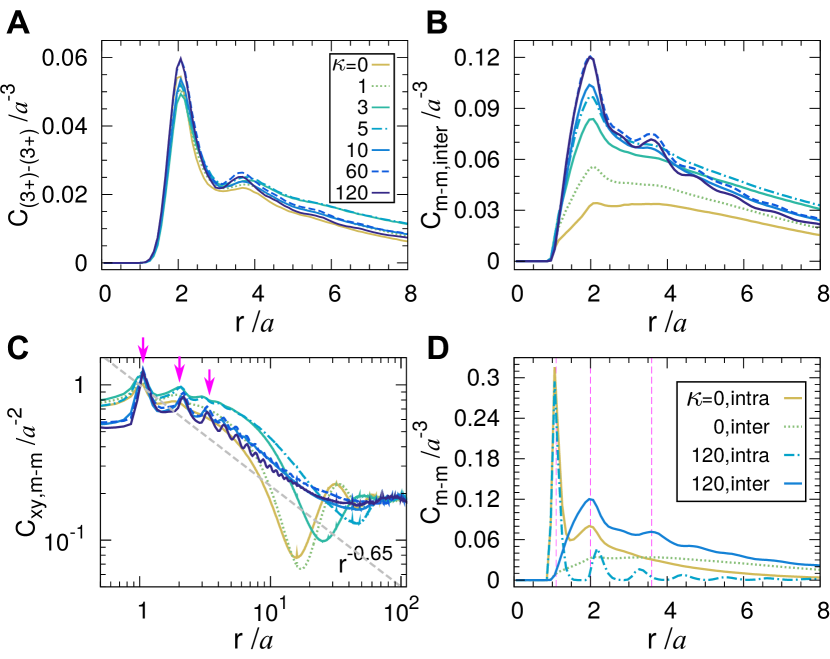
where , , , and is the total number of bonds in the brush. The vector , pointing from bond to another bond , was decomposed into the parallel and perpendicular components ( and ) with respect to the orientation of . The heat map of in Fig. 3A, indicates that the bonds of flexible chains in a micelle are isotropically distributed. As increases, density correlation first rises along the axis of . Because the effective attraction between monomers from neighboring chains increases with (Fig. S4B), bond density correlation also appears on the axis when .
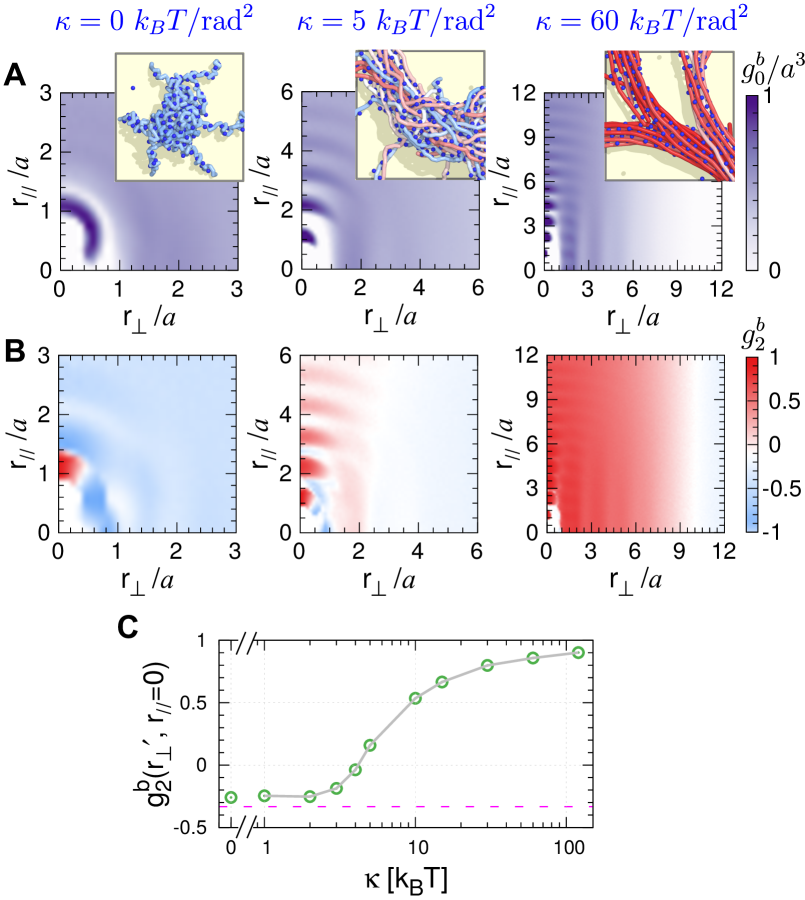
The relative orientational correlation between bond vectors, which cannot be described by alone, is quantified by calculating Frenkel and Eppenga (1985); Bates and Frenkel (2000)
| (3) |
where is the angle between and , thus . if . In the case of an isotropic distribution, . For flexible chains with (Fig. 3B left), the positive correlation arises only from their nearest neighboring bond along the chain, and converges to within a very short range (). At , intra-chain bonds are well ordered, but on the axis when , which suggests that except for the nearest neighbors, the bonds from different chains are still poorly aligned. Lastly, at , in both and directions with , , in agreement with the observation that rigid chains are bundled together forming the branches of the condensate.
To highlight the effect of on the local inter-chain organization in the condensate,
we plotted (Fig. 3C) against , by considering it as a single-valued estimate of the inter-chain bond alignment,
where is position of the highest peak of (see also Fig. S5).
In the brush condensate, chains are randomly entangled with each other when ,
but they display nearly perfect alignment when .
This disorder-to-order “transition” takes place around (Fig. 3C).
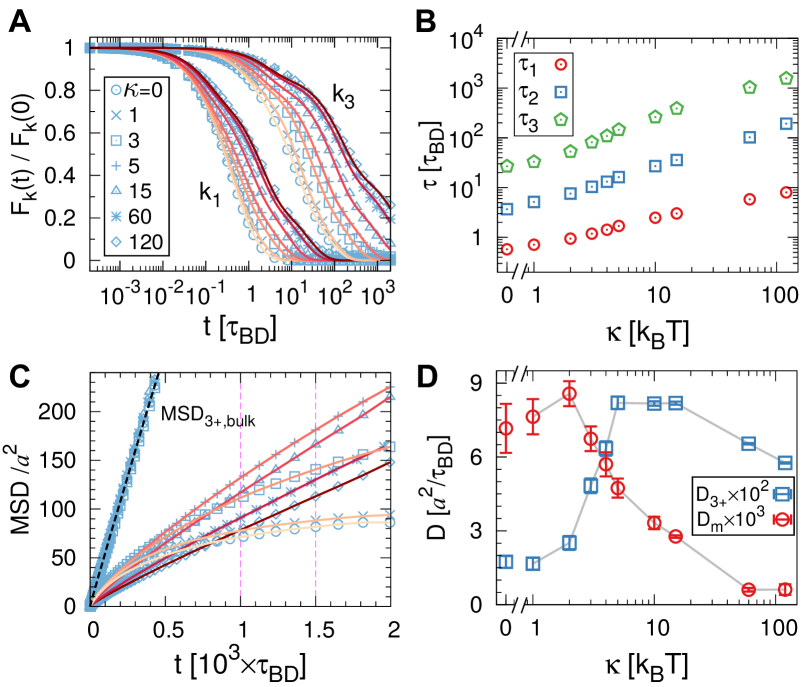
Dynamics of brush condensates. In order to quantify the dynamics of PE brush, we calculated the intermediate scattering function, which is the density-density time correlation function (van Hove correlation function) in Fourier domain,
| (4) |
where is an average over time and over the direction of a 2D wave vector of magnitude . The dynamics of brush chain at different length scales can be probed in terms of evaluated at different ( where , 2, 3 and , 2.0, 3.6 are the positions of the three highest peaks in the radial distribution function of chain monomers (see Fig. S4C,D)). The normalized function , with and , are shown in Fig. 4A, and the corresponding mean relaxation time is presented in Fig. 4B. At a small length scale , decays to zero within the timescale of , which implies that chain monomers are fluidic beyond this time scale. But, compared to octopus-like micelle with , the dendritic assembly made of brush chains with displays -fold slower relaxation profile of . The relaxation becomes much slower at larger length scale , and for rigid chain comprising the dendritic assembly is as long as our total simulation time (). We also notice that the ratio of relaxation times, at the three position of (with , 2, 3) takes an order of . This is expected because the contribution from inter-chain relaxation to the total relaxation time is higher at than at . A tight and well aligned chain organization at further increases in comparison to . For the most rigid dendrite, is -fold greater than that of the surface micelle formed by flexible PE brush.
Next, the mobility of trivalent cations, either trapped in the condensate (within from the chains) or free in the bulk solution, were quantified using an ensemble- and time-averaged mean squared displacement, , as shown in Fig. 4C. When , although trapped ions are mobile, MSD shows a long-time subdiffusive behavior because ions are confined in individual micelles Yu et al. (2017) (Supplementary Movie 1). By contrast, for , condensed ions can freely diffuse along the dendritic branches. As a result, MSD grows linearly with time.
The diffusion coefficient of trapped trivalent cation, estimated using for to , is non-monotonic with . This change agrees with the change of the brush morphology where ions are confined. In the micelle phase, micelle size grows with , which provides larger space for the trapped ions to navigate. In the dendrite phase, the effective attraction between neighboring chains, mediated by the counterions, increases with (see Figs. S2A, S4B) and tightens the bundling of PE, which in turn reduces the mobility of the condensed ions. The trapped trivalent ions diffuse 10-fold slower than those in the bulk, but still 100-fold faster than chain monomers in the dendritic assembly, even though the same value of bare diffusion coefficient was assumed for all ions and chain monomers. The bundles of rigid chains form a network of “highway”, on which the condensed trivalent ions freely diffuse (Supplementary Movie 2).
III Discussion
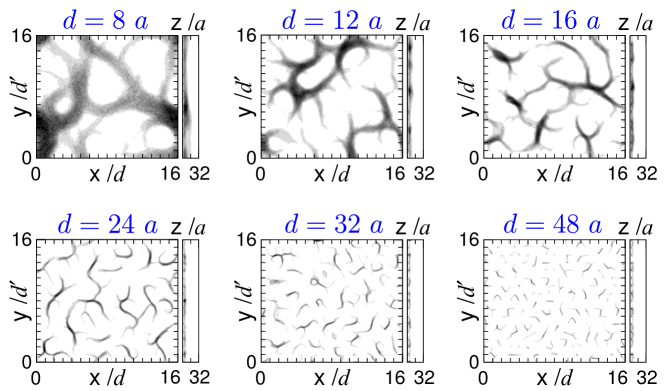
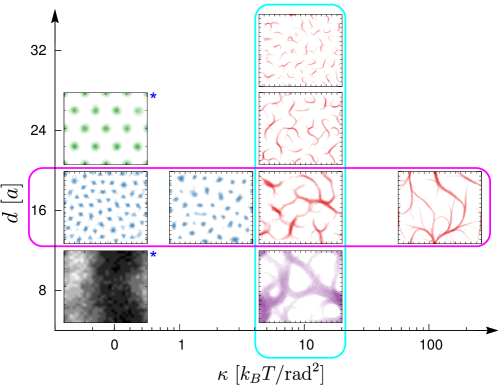
Effect of grafting density on the morphology of brush condensates. The morphological transitions from the octopus-like surface micelles to the dendritic condensates are reminiscent of sol-to-gel transition. Analogous to gelation transition, the “bond probability” can be tuned by changing either the chain stiffness () or grafting distance (). Below the gelation point () isolated domains are observed; and above the gelation point () the domains are all connected together, covering the entire space. We further performed simulations of a semiflexible brush, at , by varying the inter-chain spacing (see Fig. 5 and Fig. S6). Time-averaged monomer density heat maps of PE brushes (Fig. 5) visualize how the morphology of brush condensates changes as a function of the chain bending rigidity parameter and the inter-chain spacing .
Notably, changes in and display qualitatively different effects on the morphologies below and above the “gelation point.”
At with increasing (panels enclosed by the magenta boundary in Fig.5), the initially sol-like micelles domain are percolated into gel-like dendritic pattern whose branches span the entire surface.
In contrast, when the chain stiffness is fixed to and grafting distance is varied from a large value () to a small one () (panels enclosed by the cyan boundary in Fig.5),
the initial sol-like isolated domains are characterized by the heterogeneous condensates made of semiflexible chains, collapsed into toroids or rod-like bundles on site, not by the tadpole or octopus-like micelle condensates; and with decreasing the chains collapse and further assemble into a dendritic pattern and a non-uniform fractal-like meshwork layer.
Size of octopus-like surface micelle. For octopus-like surface micelle, a scaling argument is developed based on equilibrium thermodynamics Liu, Pincus, and Hyeon (2017). The domain size is determined by the balance between the surface tension resulting from the counterion-mediated attraction and the elastic penalty to stretch the grafted chains to form a surface micelle. When , is small enough to approximate the individual PE as a flexible chain with Kuhn length . For an octopus-like domain containing chains within a surface area , the surface energy is , where sets the scale of attraction between chain segments and is the Flory exponent. Meanwhile, the elastic penalty is , where is the number of statistical segments in each chain to be stretched to reach the micelle, and is the chain grafting density. The total free energy per area in the octopus-like condensate with arms is
| (5) |
Minimization of with respect to provides the micelle size corresponding to a minimum free energy
.
For , increases as (thus with ), until neighboring micelles is about to overlap.
Beyond this overlap point, the picture of isolated semispherical micelles no longer holds.
Fractal dimension of dendritic condensate. In the case of dendritic condensate, we found that . In particular, , observed at large () was also reported in Bracha et al.’s experiment Bracha and Bar-Ziv (2014). Incidentally, the morphology of aggregate changes depending on how trivalent salt is added Bracha and Bar-Ziv (2014). Thus, the formation of dendritic morphologies are effectively made under kinetic gelation rather than equilibrium one.
The premise that the process of dendritic assembly is kinetically controlled guides the direction of our theoretical analysis. Since the collapse is effectively irreversible and the bundles grow preferentially from the “active front” of the preexisting domain Ha and Liu (1999), we use the principle underlying the diffusion-limited aggregation Witten and Sander (1981) (DLA) to explain the observed fractal dimension. DLA describes a far-from-equlibrium growth phenomenon, where each particle diffuse with a fractal dimension until it binds irreversibly to any particles of the aggregate. A generalized Honda-Toyoki-Matsushita mean-field approximation Tokuyama and Kawasaki (1984); Matsushita et al. (1986) suggests that, the fractal dimension of the aggregate is
| (6) |
where in the presence of long-range attractive interactions the probability of growth at a certain position is assumed to be proportional to the gradient of a scalar field (e.g. monomer density) as . For DLA (, ) in 2 dimension (), Eq.6 gives . Numerical simulations report Nicolás-Carlock, Carrillo-Estrada, and Dossetti (2016, 2017).
DLA has also been exploited to explain the dynamics and aggregation of a 3D gel-like network formed by rigid PE chains in a poor solvent Mima et al. (2017).
The fractal nature of the dendritic pattern may well be an outcome of premature quenching of brush configuration to condensates during the competition
between the gain in energy upon aggregation and the entropic gain of chain fluctuations.
IV Concluding Remarks
Collapse of the brush condensate into either surface micelles Yu et al. (2017) or a dendritic pattern Bracha and Bar-Ziv (2014) is controlled by the chain flexibility. Fundamental differences are found in the the dynamics of chains and condensed ions as well as in the microscopic chain arrangement. The new insights into the link between the micro-scale details and brush morphology will be of great use to design material properties and understand biological functions of PE brushes.
V Model and Methods
Model and energy potential. As in our previous study Liu, Pincus, and Hyeon (2017), we used a well tested coarse-grained model of strong polyelectrolyte (PE) brush Csajka and Seidel (2000); Crozier and Stevens (2003); Guptha and Hsiao (2014). Total polymer chains were grafted to the uncharged surface of a 2D triangular lattice (Fig. 1A). The lattice spacing was set to , which is small enough to ensure the lateral overlap between neighboring chains, where is the diameter of chain monomers and ions. Each chain consists of negatively charged monomers and a neutral terminal monomer grafted to the surface. The simulation box has a dimension of . Periodic boundary conditions were applied along the and axes, and impenetrable neutral walls were placed at and .
We considered the following energy potentials to model a semiflexible PE brush in good solvents with multivalent salts. First, the distance between the neighboring chain monomers was constrained by a finite extensible nonlinear elastic bond potential
| (7) |
with a spring constant and a maximum extensible bond length . Second, the chain stiffness was modulated with an angular potential
| (8) |
where is the bending rigidity parameter and is the angle between three consecutive monomers along the chain. Third, the excluded volume interaction was modeled in between ions and chain monomers by using the Weeks-Chandler-Andersen potential
| (9) |
in which and denotes a Heaviside step function. Fourth, the Columbic interactions were assigned between charged particles , , which include both chain monomers and ions,
| (10) |
where is the valence of charge. The Bjerrum length is defined as , where is the vacuum permittivity and is the relative dielectric constant of the solvent. Lastly, the confinement of the wall was considered to repel any monomer, that approaches the wall closer than such that
| (11) |
with .
For simplicity, we assume the same diameter for all the ions and chain monomers.
For dsDNA, the mean bond length in our model maps to
the effective charge separation ( Å) along the chain.
Considering Å in water at room temperature, we set .
Since the focus of this study is on the effects of the bending rigidity of PE chain, in Eq.8 was adjusted in the range, .
Simulation. For conformational sampling of the brush, we integrated the Langevin equation at underdamped condition Honeycutt and Thirumalai (1992),
| (12) |
using a small friction coefficient and a time step , with the characteristic time scale . We started from an initial configuration where polymer chains were vertically stretched, and monovalent counterions were homogeneously distributed in the brush region. This salt-free brush was first equilibrated for the time of , then trivalent cations at a 1:3 stoichiometric concentration ratio with respect to the polyelectrolyte charges Liu, Pincus, and Hyeon (2017) were randomly added together with its monovalent coions (anions) into the brush-free zone (see Fig. 1A). Depending on the value of , trivalent cations induce an immediate collapse or bundling of neighboring chains in the brush. In the latter case, an intermediate bundle either merges into a thicker one with other bundles nearby, or collapses onto the grafting surface irreversibly. For stiff chains with or , it takes longer than before the whole brush collapses and the mean height of chains reaches the steady state. Production runs was generated further for . Brush configurations were collected every for the analysis of static properties. Unless stated otherwise, all the conformational properties reported here were averaged over the ensemble of trajectories.
To probe the dynamics of condensates, we performed Brownian dynamics (BD) simulations by integrating the following equation of motion
| (13) |
where is the bare diffusion coefficient of the -th particle,
and is the Gaussian noise satisfying and
.
was estimated via , where Pas is the viscosity of water
and is the hydration radius of all the particles.
We chose an integration time step
with the Brownian time ( ns, assuming that Å).
Starting from the last configuration of brush in MD simulations, the BD simulation was performed for .
Simulations were all carried out by using ESPResSo 3.3.1 package Limbach et al. (2006); Arnold et al. (2013). More details can be found in Ref.Liu, Pincus, and Hyeon (2017).
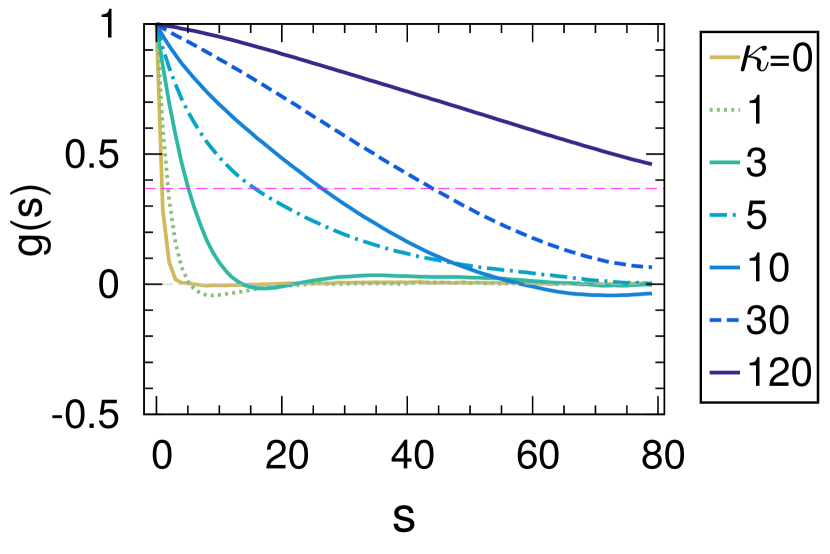
Apparent persistence length of brush chain. By using a simplifying assumption that as an isolated semiflexible chain the correlation between bond vectors exponentially decays with the their separation along the chain (, where ) (Fig. S7), we quantified an “apparent” persistent length .
VI Supplementary Material
Supplementary material contains the Supplementary Figures S1 – S7 and Supplementary Movies 1 and 2.
Acknowledgements.
We thank the Center for Advanced Computation in KIAS for providing computing resources.References
- Oosawa (1971) F. Oosawa, Polyelectrolytes (Marcel Dekker, Inc., 1971).
- Skolnick and Fixman (1977) J. Skolnick and M. Fixman, “Electrostatic persistence length of a wormlike polyelectrolyte,” Macromolecules 10, 944–948 (1977).
- Barrat and Joanny (1993) J. L. Barrat and J. F. Joanny, “Persistence length of polyelectrolyte chains,” Europhys. Lett. 24, 333 (1993).
- Ha and Thirumalai (1995) B.-Y. Ha and D. Thirumalai, “Electrostatic persistence length of a polyelectrolyte chain,” Macromolecules 28, 577–581 (1995).
- Schiessel (1999) H. Schiessel, “Counterion condensation on flexible polyelectrolytes: dependence on ionic strength and chain concentration,” Macromolecules 32, 5673–5680 (1999).
- Caliskan et al. (2005) G. Caliskan, C. Hyeon, U. Perez-Salas, R. M. Briber, S. A. Woodson, and D. Thirumalai, “Persistence Length Changes Dramatically as RNA Folds,” Phys. Rev. Lett. 95, 268303 (2005).
- Moghaddam et al. (2009) S. Moghaddam, G. Caliskan, S. Chauhan, C. Hyeon, R. Briber, D. Thirumalai, and S. Woodson, “Metal ion dependence of cooperative collapse transitions in RNA,” J. Mol. Biol. 393, 753–764 (2009).
- Liu and Hyeon (2016) L. Liu and C. Hyeon, “Contact statistics highlight distinct organizing principles of proteins and rna,” Biophys. J. 110, 2320–2327 (2016).
- Emanuel et al. (2009) M. Emanuel, N. H. Radja, A. Henriksson, and H. Schiessel, “The physics behind the larger scale organization of DNA in eukaryotes,” Phys. Biol. 6, 025008 (2009).
- Needleman et al. (2004) D. J. Needleman, M. A. Ojeda-Lopez, U. Raviv, H. P. Miller, L. Wilson, and C. R. Safinya, “Higher-order assembly of microtubules by counterions: from hexagonal bundles to living necklaces,” Proc. Natl. Acad. Sci. U. S. A. 101, 16099–16103 (2004).
- Hud and Vilfan (2005) N. V. Hud and I. D. Vilfan, “Toroidal dna condensates: unraveling the fine structure and the role of nucleation in determining size,” Annu. Rev. Biophys. Biomol. Struct. 34, 295–318 (2005).
- Kang et al. (2015) H. Kang, Y.-G. Yoon, D. Thirumalai, and C. Hyeon, “Confinement-induced glassy dynamics in a model for chromosome organization,” Phys. Rev. Lett. 115, 198102 (2015).
- Martin et al. (2000) A. Martin, M. Davies, B. Rackstraw, C. Roberts, S. Stolnik, S. Tendler, and P. Williams, “Observation of DNA-polymer condensate formation in real time at a molecular level,” FEBS Letters 480, 106 – 112 (2000).
- Vilfan et al. (2006) I. D. Vilfan, C. C. Conwell, T. Sarkar, and N. V. Hud, “Time study of DNA condensate morphology: Implications regarding the nucleation, growth, and equilibrium populations of toroids and rods,” Biochemistry 45, 8174–8183 (2006).
- Stevens (2001) M. J. Stevens, “Simple simulations of DNA condensation,” Biophys. J. 80, 130 – 139 (2001).
- Lee and Thirumalai (2001) N. Lee and D. Thirumalai, “Dynamics of collapse of flexible polyelectrolytes in poor solvents,” Macromolecules 34, 3446–3457 (2001).
- Ou and Muthukumar (2005) Z. Ou and M. Muthukumar, “Langevin dynamics of semiflexible polyelectrolytes: Rod-toroid-globule-coil structures and counterion distribution,” J. Chem. Phys. 123, 074905 (2005).
- Seaton et al. (2013) D. T. Seaton, S. Schnabel, D. P. Landau, and M. Bachmann, “From flexible to stiff: Systematic analysis of structural phases for single semiflexible polymers,” Phys. Rev. Lett. 110, 028103 (2013).
- Hoang et al. (2014) T. X. Hoang, A. Giacometti, R. Podgornik, N. T. T. Nguyen, J. R. Banavar, and A. Maritan, “From toroidal to rod-like condensates of semiflexible polymers,” J. Chem. Phys. 140, 064902 (2014).
- Morrison and Thirumalai (2009) G. Morrison and D. Thirumalai, “Semiflexible chains in confined spaces,” Phys. Rev. E. 79, 011924 (2009).
- Spakowitz and Wang (2003) A. J. Spakowitz and Z.-G. Wang, “Semiflexible polymer confined to a spherical surface,” Phys, Rev. Lett. 91, 166102 (2003).
- Hud and Downing (2001) N. V. Hud and K. H. Downing, “Cryoelectron microscopy of phage DNA condensates in vitreous ice: The fine structure of DNA toroids,” Proc. Natl. Acad. Sci. USA 98, 14925–14930 (2001).
- Leforestier (2013) A. Leforestier, “Polymorphism of DNA conformation inside the bacteriophage capsid,” J. Biol. Phys. 39, 201–213 (2013).
- Berndsen et al. (2014) Z. T. Berndsen, N. Keller, S. Grimes, P. J. Jardine, and D. E. Smith, “Nonequilibrium dynamics and ultraslow relaxation of confined DNA during viral packaging,” Proc. Natl. Acad. Sci. U. S. A. 111, 8345–8350 (2014).
- Allahverdi et al. (2015) A. Allahverdi, Q. Chen, N. Korolev, and L. Nordenskiöld, “Chromatin compaction under mixed salt conditions: Opposite effects of sodium and potassium ions on nucleosome array folding,” Sci. Rep. 5, 8512 (2015).
- Yoo et al. (2016) J. Yoo, H. Kim, A. Aksimentiev, and T. Ha, “Direct evidence for sequence-dependent attraction between double-stranded dna controlled by methylation,” Nat. Commun. 7, 11045 (2016).
- Pincus (1991) P. Pincus, “Colloid stabilization with grafted polyelectrolytes,” Macromolecules 24, 2912–2919 (1991).
- Israels et al. (1994) R. Israels, F. A. M. Leermakers, G. J. Fleer, and E. B. Zhulina, “Charged polymeric brushes: Structure and scaling relations,” Macromolecules 27, 3249–3261 (1994).
- Zappone et al. (2007) B. Zappone, M. Ruths, G. W. Greene, G. D. Jay, and J. N. Israelachvili, “Adsorption, lubrication, and wear of lubricin on model surfaces: Polymer brush-like behavior of a glycoprotein,” Biophys. J. 92, 1693–1708 (2007).
- Attili, Borisov, and Richter (2012) S. Attili, O. V. Borisov, and R. P. Richter, “Films of end-grafted hyaluronan are a prototype of a brush of a strongly charged, semiflexible polyelectrolyte with intrinsic excluded volume,” Biomacromolecules 13, 1466–1477 (2012).
- Cohen et al. (2004) M. Cohen, D. Joester, B. Geiger, and L. Addadi, “Spatial and temporal sequence of events in cell adhesion: From molecular recognition to focal adhesion assembly,” ChemBioChem 5, 1393–1399 (2004).
- Cuylen et al. (2016) S. Cuylen, C. Blaukopf, A. Z. Politi, T. Müller-Reichert, B. Neumann, I. Poser, J. Ellenberg, A. A. Hyman, and D. W. Gerlich, “Ki-67 acts as a biological surfactant to disperse mitotic chromosomes,” Nature 535, 308–312 (2016).
- Lai and Binder (1992) P. Lai and K. Binder, “Structure and dynamics of polymer brushes near the point: A monte carlo simulation,” J. Chem. Phys. 97, 586–595 (1992).
- Grest and Murat (1993) G. S. Grest and M. Murat, “Structure of grafted polymeric brushes in solvents of varying quality: a molecular dynamics study,” Macromolecules 26, 3108–3117 (1993).
- D.R.M. Williams (1993) D.R.M. Williams, “Grafted polymers in bad solvents: octopus surface micelles,” J. Phys. II France 3, 1313–1318 (1993).
- Zhulina, Singh, and Balazs (1998) E. Zhulina, C. Singh, and A. C. Balazs, “Behavior of tethered polyelectrolytes in poor solvents,” J. Chem. Phys. 108, 1175–1183 (1998).
- Pattanayek, Pham, and Pereira (2005) S. K. Pattanayek, T. T. Pham, and G. G. Pereira, “Morphological structures formed by grafted polymers in poor solvents,” J. Chem. Phys. 122, 214908 (2005).
- Carrillo and Dobrynin (2009) J.-M. Y. Carrillo and A. V. Dobrynin, “Morphologies of planar polyelectrolyte brushes in a poor solvent: Molecular dynamics simulations and scaling analysis,” Langmuir 25, 13158–13168 (2009).
- Tagliazucchi, de la Cruz, and Szleifer (2010) M. Tagliazucchi, M. O. de la Cruz, and I. Szleifer, “Self-organization of grafted polyelectrolyte layers via the coupling of chemical equilibrium and physical interactions,” Proc. Natl. Acad. Sci. USA 107, 5300–5305 (2010).
- He, Merlitz, and Sommer (2014) G.-L. He, H. Merlitz, and J.-U. Sommer, “Molecular dynamics simulations of polyelectrolyte brushes under poor solvent conditions: Origins of bundle formation,” J. Chem. Phys. 140, 104911 (2014).
- Lappala, Mendiratta, and Terentjev (2015) A. Lappala, S. Mendiratta, and E. M. Terentjev, “Arrested spinodal decomposition in polymer brush collapsing in poor solvent,” Macromolecules 48, 1894–1900 (2015).
- Brettmann et al. (2016) B. K. Brettmann, N. Laugel, N. Hoffmann, P. Pincus, and M. Tirrell, “Bridging contributions to polyelectrolyte brush collapse in multivalent salt solutions,” J. Polym. Sci., Part A: Polym. Chem. 54, 284–291 (2016).
- Liu, Pincus, and Hyeon (2017) L. Liu, P. A. Pincus, and C. Hyeon, “Heterogeneous Morphology and Dynamics of Polyelectrolyte Brush Condensates in Trivalent Counterion Solution,” Macromolecules 50, 1579–1588 (2017).
- Jackson et al. (2017) N. E. Jackson, B. K. Brettmann, V. Vishwanath, M. Tirrell, and J. J. de Pablo, “Comparing solvophobic and multivalent induced collapse in polyelectrolyte brushes,” ACS Macro Letters 6, 155–160 (2017).
- Yu et al. (2017) J. Yu, N. E. Jackson, X. Xu, B. K. Brettmann, M. Ruths, J. J. de Pablo, and M. Tirrell, “Multivalent ions induce lateral structural inhomogeneities in polyelectrolyte brushes,” Science Advances 3, eaao1497 (2017).
- Bracha and Bar-Ziv (2014) D. Bracha and R. H. Bar-Ziv, “Dendritic and nanowire assemblies of condensed DNA polymer brushes,” J. Am. Chem. Soc. 136, 4945–4953 (2014).
- Csajka and Seidel (2000) F. S. Csajka and C. Seidel, “Strongly charged polyelectrolyte brushes: A molecular dynamics study,” Macromolecules 33, 2728–2739 (2000).
- Crozier and Stevens (2003) P. S. Crozier and M. J. Stevens, “Simulations of single grafted polyelectrolyte chains: ssDNA and dsDNA,” J. Chem. Phys. 118, 3855–3860 (2003).
- Guptha and Hsiao (2014) V. S. Guptha and P.-Y. Hsiao, “Polyelectrolyte brushes in monovalent and multivalent salt solutions,” Polymer 55, 2900 – 2912 (2014).
- Benetatos, Terentjev, and Zippelius (2013) P. Benetatos, E. M. Terentjev, and A. Zippelius, “Bundling in brushes of directed and semiflexible polymers,” Phys. Rev. E 88, 042601 (2013).
- Sander (1986) L. M. Sander, “Fractal growth processes,” Nature 322, 789–793 (1986).
- Nicolás-Carlock, Carrillo-Estrada, and Dossetti (2016) J. R. Nicolás-Carlock, J. L. Carrillo-Estrada, and V. Dossetti, “Fractality à la carte: a general particle aggregation model,” Sci. Rep. 6, 19505 (2016).
- Nicolás-Carlock, Carrillo-Estrada, and Dossetti (2017) J. R. Nicolás-Carlock, J. L. Carrillo-Estrada, and V. Dossetti, “Universal fractality of morphological transitions in stochastic growth processes,” Sci. Rep. 7, 3523 (2017).
- Frenkel and Eppenga (1985) D. Frenkel and R. Eppenga, “Evidence for algebraic orientational order in a two-dimensional hard-core nematic,” Phys. Rev. A 31, 1776–1787 (1985).
- Bates and Frenkel (2000) M. A. Bates and D. Frenkel, “Phase behavior of two-dimensional hard rod fluids,” J. Chem. Phys. 112, 10034–10041 (2000).
- Ha and Liu (1999) B. Y. Ha and A. J. Liu, “Kinetics of bundle growth in DNA condensation,” EPL (Europhysics Letters) 46, 624–630 (1999).
- Witten and Sander (1981) T. A. Witten and L. M. Sander, “Diffusion-limited aggregation, a kinetic critical phenomenon,” Phys. Rev. Lett. 47, 1400–1403 (1981).
- Tokuyama and Kawasaki (1984) M. Tokuyama and K. Kawasaki, “Fractal dimensions for diffusion-limited aggregation,” Phys. Lett. A 100, 337 – 340 (1984).
- Matsushita et al. (1986) M. Matsushita, K. Honda, H. Toyoki, Y. Hayakawa, and H. Kondo, “Generalization and the fractal dimensionality of diffusion-limited aggregation,” J. Phys. Soc. Japan 55, 2618–2626 (1986).
- Mima et al. (2017) T. Mima, T. Kinjo, S. Yamakawa, and R. Asahi, “Study of the conformation of polyelectrolyte aggregates using coarse-grained molecular dynamics simulations,” Soft Matter 13, 5991–5999 (2017).
- Honeycutt and Thirumalai (1992) J. D. Honeycutt and D. Thirumalai, “The nature of folded states of globular proteins,” Biopolymers 32, 695–709 (1992).
- Limbach et al. (2006) H. J. Limbach, A. Arnold, B. A. Mann, and C. Holm, “ESPResSo – an extensible simulation package for research on soft matter systems,” Comput. Phys. Commun. 174, 704–727 (2006).
- Arnold et al. (2013) A. Arnold, O. Lenz, S. Kesselheim, R. Weeber, F. Fahrenberger, D. Roehm, P. Košovan, and C. Holm, “ESPResSo 3.1 — Molecular Dynamics Software for Coarse-Grained Models,” in Meshfree Methods for Partial Differential Equations VI, Lecture Notes in Computational Science and Engineering, Vol. 89, edited by M. Griebel and M. A. Schweitzer (Springer, 2013) pp. 1–23.
Appendix A Supplementary Figures