SPIRITS 16tn in NGC 3556: A heavily obscured and low-luminosity supernova at 8.8 Mpc
Abstract
We present the discovery by the SPitzer InfraRed Intensive Transients Survey (SPIRITS) of a likely supernova (SN) in NGC 3556 (M108) at only 8.8 Mpc, which, despite its proximity, was not detected by optical searches. A luminous infrared (IR) transient at mag (Vega), SPIRITS 16tn is coincident with a dust lane in the inclined, star-forming disk of the host. Using observations in the IR, optical, and radio, we attempt to determine the nature of this event. We estimate – mag of extinction, placing it among the three most highly obscured IR-discovered SNe to date. The [4.5] light curve declined at a rate of mag day-1, and the color grew redder from to mag by 184.7 days post discovery. Optical/IR spectroscopy shows a red continuum, but no clearly discernible features are evident, preventing a definitive spectroscopic classification. Deep radio observations constrain the radio luminosity of SPIRITS 16tn to erg s-1 Hz-1 between 3–15 GHz, excluding many varieties of radio core-collapse SNe. A type Ia SN is ruled out by the observed red IR color, and lack of features normally attributed to Fe-peak elements in the optical and IR spectra. SPIRITS 16tn was fainter at [4.5] than typical stripped-envelope SNe by mag. Comparison of the spectral energy distribution (SED) to SNe II suggests SPIRITS 16tn was both highly obscured, and intrinsically dim, possibly akin to the low-luminosity SN 2005cs. We infer the presence of an IR dust echo powered by an initial peak luminosity of the transient of erg s erg s-1, consistent with the observed range for SNe II. This discovery illustrates the power of IR surveys to overcome the compounding effects of visible extinction and optically sub-luminous events in completing the inventory of nearby SNe.
1 Introduction
The discovery and characterization of core-collapse supernovae (CC SNe), bursts of light heralding the explosive deaths of stars with initial mass , has been largely driven in recent years by several large optical time-domain surveys, many specifically dedicated to the identification of transients. While such searches have been hugely successful, now discovering hundreds of SNe every year, a primary limitation is the susceptibility of visible photons to extinction by intervening dust. CC SNe in particular, often associated with the dense and dusty star-forming regions of late-type galaxies, may be subject to significant host extinction.
The measurement of the CCSN rate from optical surveys is an important probe of star formation and the fate of massive stars. However, these measurements only yield lower limits, as some SNe are missed due to obscuration (e.g., Grossan et al., 1999; Maiolino et al., 2002; Cresci et al., 2007). In particular, Horiuchi et al. (2011) claim that half of all supernovae are missing across redshifts from , termed the “supernova rate problem” and possibly indicating a large population of hidden or intrinsically dim SNe. Cappellaro et al. (2015) have challenged this claim, however, finding full agreement between CC SN rates and revised measurements of the cosmic star formation history. Still, Mattila et al. (2012) find empirically that % of SNe locally, growing to % by , may be missed by optical searches due only to obscuration by dust. The deep, galaxy-targeted Mpc (DTL40) supernova search recently reported, for example, the discovery of the obscured type II SN DLT16am (SN 2016ija) in the nearby, edge-on galaxy NGC 1532 with mag (Tartaglia et al., 2018). Further confounding the debate, recent studies suggest that CC SNe may even be overproduced in the local 11 Mpc volume (Horiuchi et al., 2013; Botticella et al., 2012; Xiao & Eldridge, 2015) compared to H and UV inferred star formation rates. Any CC SNe missed in the nearest galaxies only increase this tension.
Transient surveys at infrared (IR) wavelengths can overcome the limitations of optical searches introduced by the effects of extinction. A number searches in the near-IR have focused specifically on the dense, highly star-forming, heavily extinguished environments of luminous and ultra-luminous infrared galaxies (LIRGs and ULIRGs), where the SN rates are expected to be high, of order one per year (Mattila & Meikle, 2001). Such surveys, using seeing-limited imaging (e.g., Mannucci et al., 2003; Miluzio et al., 2013), or high-resolution imaging from space or with ground-based adaptive optics to probe the densest nuclear regions of these galaxies (e.g., Cresci et al., 2007; Mattila et al., 2007; Kankare et al., 2008, 2012; Kool et al., 2018) have now uncovered 16 CC SNe in (U)LIRGs.
The InfraRed Array Camera (IRAC; Fazio et al., 2004) aboard the Spitzer Space Telescope (Spitzer; Werner et al., 2004; Gehrz et al., 2007), in the 3.6 and 4.5 m imaging bands (hereafter [3.6] and [4.5]) where the effects of extinction are minimal, is sensitive to even the most highly obscured events, up to mag at 20 Mpc. Since December 2014, the SPitzer InfraRed Intensive Transients Survey (SPIRITS; PIDs 11063, 13053; PI M. Kasliwal, Kasliwal et al., 2017) has been conducting an ongoing monitoring campaign of nearby galaxies ( Mpc) for transients with Spitzer/IRAC at [3.6] and [4.5]. An example of the importance of IR surveys was demonstrated in Jencson et al. (2017), where we reported the discovery of two obscured SNe in IC 2163, SPIRITS 14buu and SPIRITS 15C, missed by optical searches despite their proximity to Earth and only moderate level of extinction (– mag).
Beyond the ability to discover CC SNe hidden by dust, mid-IR observations offer important diagnostics of the explosions and their circumburst environments. Mid-IR emission may be produced in SNe as thermal emission from the photosphere of the explosions, and also traces the presence of warm dust in the system. This dust may be newly formed in the ejecta or in the rapidly cooling, post-shock material of the explosion. Alternatively, pre-existing, circumburst dust, possibly formed in the pre-SN stellar wind or an eruptive mass loss event of the progenitor star, may be heated by the luminous SN peak, producing an “IR echo” due to light travel time effects (e.g., Bode & Evans, 1980; Dwek, 1983; Mattila et al., 2008). The multi-faceted effects of dust, either newly formed or pre-existing, on the mid-IR emission of SNe has been studied in numerous works (see, e.g., Kotak et al., 2009; Fox et al., 2010, 2011; Szalai & Vinkó, 2013). Most recently, Tinyanont et al. (2016) presented a systematic study of CC SNe observed in the mid-IR with SPIRITS, finding remarkable diversity in the growing sample of well characterized events at these wavelengths.
Here, we report the discovery of SPIRITS 16tn, a likely highly obscured CC SN at only 8.8 Mpc in the nearby spiral galaxy NGC 3556 (M108). In Section 2, we describe the discovery and follow-up observations of this event using both space and ground-based facilities in the optical, IR, and radio. In Section 3, we describe our analysis of the data, including constraints on the progenitor luminosity from archival, pre-explosion Hubble Space Telescope (HST) imaging (Section 3.1), analysis of the light curves and color evolution (Section 3.2), evolution of the spectral energy distribution (SED) and constraints on the extinction and dust emission (Section 3.3). In Section 4, we discuss of the overall properties of SPIRITS 16tn and our interpretation of the observations in the context of well-studied SNe and other types of luminous IR transients. We present our conclusions in Section 5.
2 SPIRITS discovery and follow-up observations
2.1 Spitzer/IRAC Discovery in NGC 3556
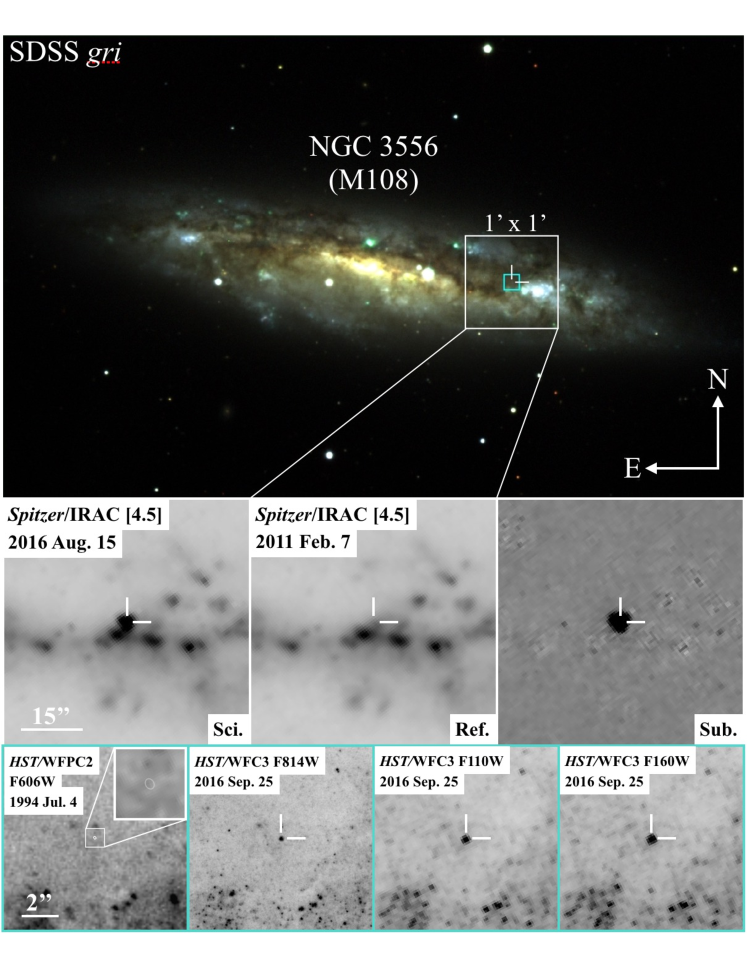
During the ongoing monitoring campaign of nearby galaxies with SPIRITS, we observed the star-forming galaxy NGC 3556 with Spitzer/IRAC at [3.6] and [4.5] at 8 epochs between UT 2014 January 18.4 and 2016 August 15.0. Image subtraction was performed using archival images from 2011 February 7.6 as references (observed as part of the Spitzer Survey of Stellar Structure in Galaxies, S4; PID 61065; PI K. Sheth; Sheth et al., 2010). For details on our image subtraction pipeline see Kasliwal et al. (2017). A new transient source, designated SPIRITS 16tn, was detected in both the [3.6] and [4.5] images on 2016 August 15.0 (MJD = 57615.0; Jencson et al., 2016). Throughout this paper, we refer to the phase as the number of days since the earliest detection of SPIRITS 16tn on this date. We detect no significant variability at the location of SPIRITS 16tn in any of the prior Spitzer/IRAC images compared to the reference frame. We show the [4.5] discovery images in the center row of Figure 1, along with mosaicked imaging of the field from the Sloan Digital Sky Survey Date Release 12 (SDSS-DR12; Eisenstein et al., 2011; Alam et al., 2015) in the top panel showing the location of SPIRITS 16tn in a dust lane in the disk of NGC 3556. This galaxy was also the host of the probable type II SN 1969B (Ciatti & Barbon, 1971).
2.1.1 Host distance and Galactic extinction
SPIRITS 16tn was discovered at a right ascension and declination of (J2000). Located arcsec from the center of the star-forming galaxy NGC 3556, the position of SPIRITS 16tn is coincident with a dust lane in the disk.
NED111The NASA/IPAC Extragalactic Database (NED) is operated by the Jet Propulsion Laboratory, California Institute of Technology, under contract with the National Aeronautics and Space Administration. lists 17 individual distance estimates to NGC 3556 with a median value of mag and standard deviation of mag. Throughout this work, we adopt the most recent value from Sorce et al. (2014) of mag ( Mpc). This estimate is based on the mid-IR Tully-Fisher relation using the [3.6] micron flux with color and selection bias corrections. The redshift of NGC 3556 is ( km s-1; Shostak, 1975).
We assume Galactic extinction along the line of sight to NGC 3556 of mag from the Schlafly & Finkbeiner (2011) recalibration of the Schlegel et al. (1998) IR-based dust map assuming a Fitzpatrick (1999) extinction law with . Furthermore, for all other considerations of the possible extinction to SPIRITS 16tn throughout this work, including any foreground host extinction, we assume the Fitzpatrick (1999) Milky Way extinction curve with unless otherwise noted.
2.2 Follow-up Imaging
In this section, we describe our space and ground-based imaging follow-up efforts to characterize SPIRITS 16tn.
2.2.1 Space-based
Since its discovery, we continued to monitor SPIRITS 16tn with Spitzer/IRAC at [3.6] and [4.5] as part of the SPIRITS program. Image subtraction was performed on all subsequent epochs, as described in Section 2.1. Photometry was performed on the reference subtracted images using a 4-mosaicked-pixel (2.4 arcsec) aperture and a background annulus from 4–12 pixels (2.4–7.2 arcsec). The extracted flux was multiplied by aperture corrections of 1.215 and 1.233 for [3.6] and [4.5], respectively, as described in the IRAC instrument handbook222http://irsa.ipac.caltech.edu/data/SPITZER/docs/irac/iracinstrumenthandbook/. Fluxes then were converted to Vega system magnitudes using the handbook-defined zero magnitude fluxes for each IRAC channel. At discovery, our photometry gives mag ( mag; ).
We triggered observations with the Ultra-Violet/Optical Telescope (UVOT; Roming et al., 2005) on board the Neil Gehrels Swift Observatory (Swift; Gehrels et al., 2004; Nousek, 2004) on 2016 August 29.1. No source was detected in the , , and -band images with integration times of 540, 580, and 540 s, respectively (Adams et al., 2016a). We derived 5- limiting magnitudes of , , and mag. The extreme mag color indicates SPIRITS 16tn is likely highly obscured.
We observed SPIRITS 16tn on 2016 September 25, days, with the Wide Field Camera 3 (WFC3) on the Hubble Space Telescope (HST) in the UVIS channel with the F814W filter, and the IR channel with the F110W and F160W filters. These observations were part of our Cycle 23 Target of Opportunity program to observe SPIRITS transients (GO-14258, PI: H. Bond). All three images are shown in the bottom row of Figure 1. The photometry and limits from our space-based follow-up effort are listed in Table 1 and shown in Figure 2.
| UT Date | MJD | PhaseaaPhase is number of days since the earliest detection of this event on 2016 August 15.0 (). | Tel./Inst. | Band | Apparent Magnitudeb,cb,cfootnotemark: | Absolute Magnitudec,dc,dfootnotemark: |
|---|---|---|---|---|---|---|
| (days) | (mag) | (mag) | ||||
| 1999 Jul 04 | 51363 | -6252 | HST/WFPC2 | F606W | ||
| 2016 Mar 03.6 | 57450.6 | -164.4 | Spitzer/IRAC | |||
| 2016 Mar 03.6 | 57450.6 | -164.4 | Spitzer/IRAC | |||
| 2016 May 25.0 | 57533.0 | -82.0 | KPNO-4m | |||
| 2016 Aug 15.0 | 57615.0 | 0.0 | Spitzer/IRAC | |||
| 2016 Aug 15.0 | 57615.0 | 0.0 | Spitzer/IRAC | |||
| 2016 Aug 29.0 | 57629.0 | 14.0 | Swift/UVOT | |||
| 2016 Aug 29.0 | 57629.0 | 14.0 | Swift/UVOT | |||
| 2016 Aug 29.0 | 57629.0 | 14.0 | Swift/UVOT | |||
| 2016 Sep 25.9 | 57656.9 | 41.9 | HST/WFC3 | F814W | ||
| 2016 Sep 25.9 | 57656.9 | 41.9 | HST/WFC3 | F110W | ||
| 2016 Sep 25.9 | 57656.9 | 41.9 | HST/WFC3 | F160W | ||
| 2016 Oct 11.5 | 57672.5 | 57.5 | P200/WIRC | |||
| 2016 Oct 13.5 | 57674.5 | 59.5 | P60/SEDM | |||
| 2016 Oct 31.6 | 57692.6 | 77.6 | Keck/LRIS | |||
| 2016 Oct 31.6 | 57692.6 | 77.6 | Keck/LRIS | |||
| 2016 Nov 09.4 | 57701.4 | 86.4 | 1.5m/RATIR | |||
| 2016 Nov 09.4 | 57701.4 | 86.4 | 1.5m/RATIR | |||
| 2016 Nov 09.4 | 57701.4 | 86.4 | 1.5m/RATIR | |||
| 2016 Nov 09.4 | 57701.4 | 86.4 | 1.5m/RATIR | |||
| 2016 Nov 09.4 | 57701.4 | 86.4 | 1.5m/RATIR | |||
| 2016 Nov 09.4 | 57701.4 | 86.4 | 1.5m/RATIR | |||
| 2016 Nov 10.4 | 57702.4 | 87.4 | 1.5m/RATIR | |||
| 2016 Nov 10.4 | 57702.4 | 87.4 | 1.5m/RATIR | |||
| 2016 Nov 10.4 | 57702.4 | 87.4 | 1.5m/RATIR | |||
| 2016 Nov 10.4 | 57702.4 | 87.4 | 1.5m/RATIR | |||
| 2016 Nov 10.4 | 57702.4 | 87.4 | 1.5m/RATIR | |||
| 2016 Nov 10.4 | 57702.4 | 87.4 | 1.5m/RATIR | |||
| 2016 Dec 14.7 | 57736.7 | 121.7 | UKIRT | |||
| 2016 Dec 22.7 | 57744.7 | 129.7 | UKIRT | |||
| 2016 Dec 23.6 | 57745.6 | 130.6 | UKIRT | |||
| 2017 Jan 17.4 | 57770.4 | 155.4 | P200/WIRC | |||
| 2017 Jan 17.4 | 57770.4 | 155.4 | P200/WIRC | |||
| 2017 Jan 17.4 | 57770.4 | 155.4 | P200/WIRC | |||
| 2017 Feb 15.7 | 57799.7 | 184.7 | Spitzer/IRAC | |||
| 2017 Feb 15.7 | 57799.7 | 184.7 | Spitzer/IRAC | |||
| 2017 Mar 07.4 | 57819.4 | 204.4 | P200/WIRC | |||
| 2017 Apr 09.8 | 57852.8 | 237.8 | Spitzer/IRAC | |||
| 2017 Apr 09.8 | 57852.8 | 237.8 | Spitzer/IRAC | |||
| 2017 May 03.3 | 57876.3 | 261.3 | P200/WIRC | |||
| 2017 May 03.3 | 57876.3 | 261.3 | P200/WIRC | |||
| 2017 May 03.3 | 57876.3 | 261.3 | P200/WIRC | |||
| 2017 Jul 10.3 | 57944.3 | 329.3 | Spitzer/IRAC | |||
| 2017 Jul 10.3 | 57944.3 | 329.3 | Spitzer/IRAC |
2.2.2 Ground-based
At the time of its discovery, SPIRITS 16tn was inaccessible for ground-based observing except at high latitudes. We began ground-based follow-up of SPIRITS 16tn from Palomar Observatory in 2016 October, approximately 2 months after discovery. We obtained near-IR images of SPIRITS 16tn in with the Wide Field Infrared Camera (WIRC; Wilson et al., 2003) on the Palomar 200-in. Hale Telescope (P200) at several epochs, employing large dithers approximately every minute to allow for accurate subtraction of the bright near-IR sky background. Flat-fielding, background subtraction, astrometric alignment, and final stacking of images in each filter were performed using a custom pipeline.
Additional near-IR and -band imaging was obtained with the Wide Field Camera (WFCAM; Casali et al., 2007) on the United Kingdom Infrared Telescope (UKIRT) at Mauna Kea Observatory. We obtained simultaneous optical/near-IR with the Reionization and Transients InfraRed camera (RATIR; Butler et al., 2012) on the 1.5 m Johnson Telescope at the Mexican Observatorio Astronomico Nacional on the Sierra San Pedro Martir in Baja California, Mexico (Watson et al., 2012).
We obtained one epoch of optical (-band) imaging with the Spectral Energy Distribution Machine (SEDM; Blagorodnova et al., in prep) on the fully-automated Palomar 60-in. Telescope (P60; Cenko et al., 2006), and an epoch of and band imaging with the Low-Resolution Imaging Spectrometer (LRIS; Oke et al., 1995) on the Keck I Telescope on Mauna Kea.
Photometry was performed by simultaneously fitting the point-spread function of the transient, measured using field stars, and background, modeled using low-order polynomials. The photometric zero point in each image was obtained by performing photometry on stars of known magnitude in the field. For the near-IR images, we selected 10 bright, isolated 2MASS stars, and for -band we adopt the conversion from 2MASS used for WFCAM/UKIRT from Hodgkin et al. (2009). For optical images, we used 12 SDSS stars, adopting the conversions of Jordi et al. (2006) to convert from the Sloan system to magnitudes where necessary.
We examined the location of SPIRITS 16tn in a deep -band image of NGC 3556 from 2017 May 25.0, taken with the CCD Mosaic imager on the 4-m Mayall Telescope at Kitt Peak National Observatory (KPNO) as part of the Mayall z-band Legacy Survey (MzLS). We derive a limit on the flux from the transient of mag, providing our most stringent constraint on the explosion date of SPIRITS 16tn at 82.0 days before the first detection.
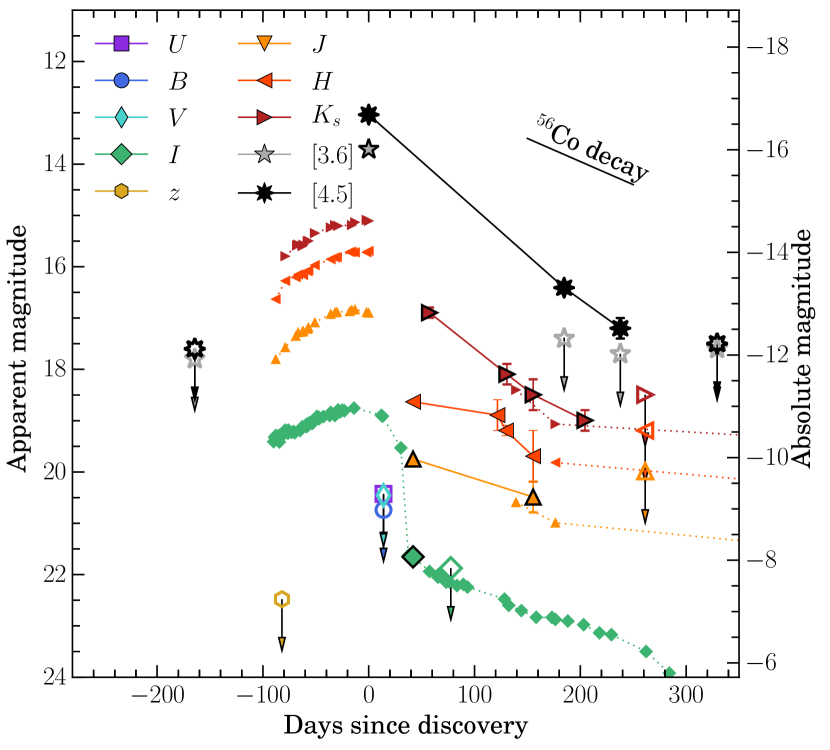
We list all of our photometry of SPIRITS 16tn in Table 1. For non-detections we list 5- upper limits, where we estimated as the standard deviation of the pixel values near the transient position to account for uncertain variations in the background flux from the host galaxy. Our light curves of SPIRITS 16tn are shown in Figure 2.
2.3 Spectroscopy
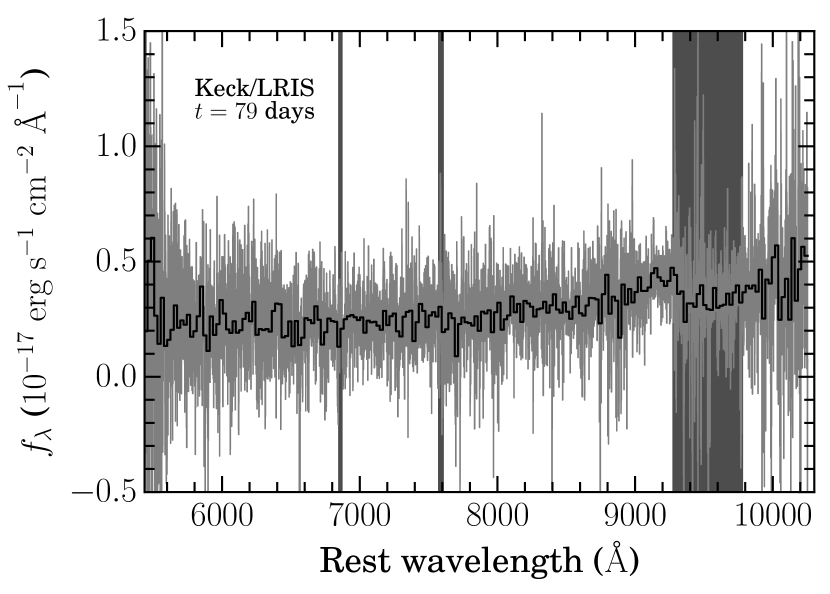
We obtained optical spectroscopy of SPIRITS 16tn with Keck/LRIS on 2017 November 2 ( days post discovery). We used the D560 dichroic to split the light between the red and blue sides, and used the 400/8500 grating on the red side and 300/3400 grism on the blue side. We obtained one 1800 s integration on the blue side, and two 860 s integrations on the red side. Spectroscopic reductions were performed using the analysis pipeline LPIPE333Software available at: http://www.astro.caltech.edu/~dperley/programs/lpipe.html. A weak trace is visible at the position of the transient on the red-side camera. The low signal-to-noise ratio (S/N) 1D extracted spectrum was flux calibrated using observations of the standard star Feige 34 from the same night. The Keck/LRIS optical spectrum is shown in Figure 3.
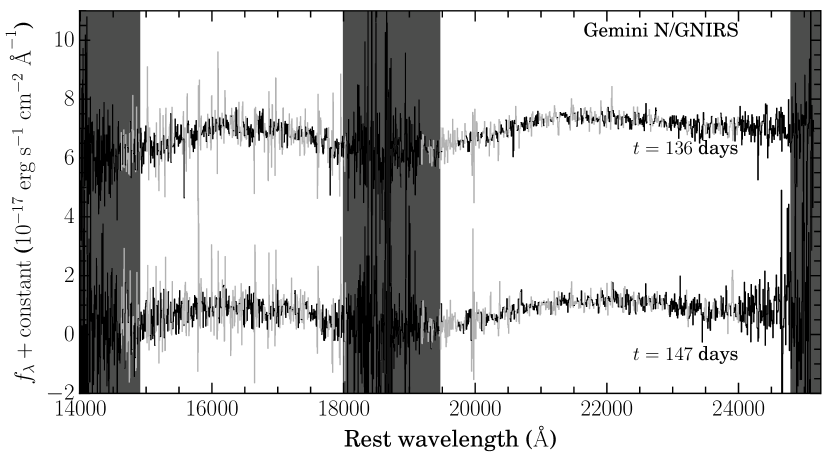
We observed SPIRITS 16tn with the Gemini Near-Infrared Spectrograph (GNIRS) on the 8.1-m Gemini North Telescope on the summit of Mauna Kea in Hawaii through Gemini Fast Turnaround program GN-2016B-FT-25. We obtained two epochs444Our observations were submitted as a single observation to the Gemini queue, but the execution of our program was split between two separate dates instead, possibly due to deteriorated weather conditions. of near-IR cross-dispersed (XD; multi-order) spectroscopy on 2016 December 29 ( days) and 2017 January 9 ( days) using a 0.45 arcsec wide slit with the 32 l/mm grating and the short blue camera with its cross-dispersing prism for a spectra resolution of . In this configuration, a spectrum of the entire near-IR region (0.85–2.5 m) is obtained at once. The observations were carried out using 300 s exposures, with the target nodded along the slit between frames to allow for accurate subtraction of the sky background. We obtained a total of 70 min of integration during the first epoch, and 50 min during the second. Baseline calibrations were also obtained, including observations of A0V stars at similar airmass immediately before/after the science observations as near-IR standards for flux calibration and telluric corrections.
Reductions, including detector pattern noise cleaning, radiation event removal, flat-fielding, background subtraction, spatial distortion corrections, wavelength calibration, and 1D extractions, were perform using standard tasks in the Gemini IRAF555IRAF is distributed by the National Optical Astronomy Observatory, which is operated by the Association of Universities for Research in Astronomy (AURA) under a cooperative agreement with the National Science Foundation. package following the procedures outlined on the Gemini webpage666Procedures for reducing GNIRS XD spectra here:
http://www.gemini.edu/sciops/instruments/gnirs/data-format-and-reduction/reducing-xd-spectra. In the reduced 2D spectra, a faint trace was visible at the position of SPIRITS 16tn in spectral orders 3 and 4, corresponding to the and spectral regions, respectively.
Corrections for the strong near-IR telluric absorption features and flux calibrations were performed using the IDL tool xtellcor developed by Vacca et al. (2003). For the first epoch, a detector bias fault occurred during the science target observations, after which the target had to be reacquired. We reduced the two groups of data separately, using the star HIP53735, observed immediately preceding SPIRITS 16tn, as the A0V flux standard for the first group, and HIP56147, observed immediately after, for the second. The two telluric-corrected, flux calibrated spectra were then averaged. For the second epoch we again used HIP53735. Our Gemini/GNIRS spectra of SPIRITS 16tn are shown in Figure 4.
We note that we did not attempt to subtract the contribution from the host-galaxy background from our optical/near-IR spectra, which may be significant for our late-time observations as the transient fades.
2.3.1 Host spectroscopy
The Palomar Cosmic Web Imager (PCWI; Matuszewski et al., 2010) is an integral field spectrograph mounted on the Cassegrain focus of the 200-inch Hale telescope at Palomar observatory. The instrument has a field of view of 40 by 60 arcsec divided across 24 slices with dimensions of 40 by 2.5 arcsec each. The spectrograph uses a R volume phase holographic grating (in the red filter) to achieve an instantaneous bandwidth of Å. A complete description of the instrument, observing approach and data analysis methodology can be found in Martin et al. 2014.
We observed the host region of SPIRITS 16tn with PCWI (centered at the location of the transient) on 2017 October 18 in order to characterize the star formation rate in the transient environment. The instrument was configured to a central wavelength of 6630 Å, covering the wavelength range from approximately 6400 Å to 6900 Å. We obtained one 600 s exposure of the transient region with the instrument oriented to a position angle of 270∘ (slices oriented in the North-South direction) followed by one 600 s background sky exposure of a nearby field with no bright sources.
We also obtained calibration images including arc lamp spectra, dome flats and a standard star spectrum. The two dimensional spectra were sliced, rectified, spatially aligned and wavelength calibrated using the calibration images to produce data cubes for each sky exposure, sampled at (RA, Dec., ) intervals of (2.6 arcsec, 0.6 arcsec, 0.22 Å). The sky background cube was subtracted from the source cube to remove the sky emission lines, followed by flux calibration using the standard star Feige 15. This produces the final flux calibrated spectral cube of the 40 by 60 arcsec region centered at the location of the transient.
2.4 Radio observations
We observed SPIRITS 16tn in the radio with the Karl G. Jansky Very Large Array (JVLA) at two epochs on 2016 September 9.0 ( days) in the S, C, and X-bands (3, 6, and 10 GHz, respectively) and 2017 January 12.4 ( days) in the C and Ku-bands (10 and 15.5 GHz, respectively). The data were reduced using standard imaging techniques for the JVLA in CASA. We also obtained radio imaging at GHz with the Arcminute Microkelvin Imager Large Array (AMI-LA) on 2017 September 2–5 ( days). The AMI-LA data were processed (RFI excision and calibration) with a fully-automated pipeline, AMI-REDUCE (e.g., Davies et al., 2009; Perrott et al., 2013), and later imported and imaged in CASA. SPIRITS 16tn was undetected at all epochs and frequencies in the radio, and we provide a summary our limits on the observed fluxes and radio luminosities of the source in Table 2. 5- limits are calculated as 5 times the RMS noise at the position of the transient in the final radio images.
| UT Date | MJD | PhaseaaPhase is number of days since the earliest detection of this event on 2016 August 15.0 (). | Inst. | Frequency | FluxbbVega magnitudes, except for the -bands which are AB magnitudes on the SDSS system. 1- uncertainties are given in parentheses. | Luminosityb,cb,cfootnotemark: |
|---|---|---|---|---|---|---|
| (days) | (GHz) | (mJy) | (erg s-1 Hz-1) | |||
| 2016 Sept 2–5 | 57633 - 57636 | 17–20 | AMI-LA | 15.0 | ||
| 2016 Sept. 4.0 | 57635.0 | 19.0 | JVLA | 10.0 | ||
| 2016 Sept. 4.0 | 57635.0 | 19.0 | JVLA | 6.0 | ||
| 2016 Sept. 4.0 | 57635.0 | 19.0 | JVLA | 3.0 | ||
| 2017 Jan. 12.4 | 57765.4 | 149.4 | JVLA | 15.5 | ||
| 2017 Jan. 12.4 | 57765.4 | 149.4 | JVLA | 6.0 |
3 Analysis
Here, we describe our analysis of the both archival imaging data at the position of the transient and our photometric and spectroscopic measurements of SPIRITS 16tn obtained as part of our follow-up effort.
3.1 Progenitor constraints and host environment
We examined the Spitzer/IRAC pre-explosion images of NGC 3556 from 2011 February 7, which we also used as references for image subtraction as described in Section 2.1, for the presence of a possible IR progenitor star. No clear point source is detected in either IRAC channel to 5- limiting magnitudes of mag and mag, where the depth is primarily limited by bright, spatially varying background emission from the host. At the assumed distance to NGC 3556 and correcting only for Galactic extinction, the limits on the absolute magnitudes of the progenitor are mag and mag.
Images of NGC 3556 were obtained with the HST on 1994 July 4 in program SNAP-5446 (PI: G. Illingworth). These observations used the Wide Field Planetary Camera 2 (WFPC2) with the F606W filter, and covered the site of SPIRITS 16tn, approximately 22 years before its outburst. To determine the precise location of SPIRITS 16tn in the archival WFPC2 F606W image, we registered this frame with the WFC3 F814W detection image of the active transient described above in Section 2.2.1. Using centroid measurements for 10 bright stars detected in both frames, we determined the geometric transformation from WFPC2 to WFC3 using the STSDAS777STSDAS (Space Telescope Science Data Analysis System) is a product of STScI, which is operated by AURA for NASA. geomap task. By applying the geotran task to the WFPC2 frame, and blinking this transformed image against the WFC3 image, we verified the quality of the registration. The rms error of the geometric fits for the reference stars were 0.15 and 0.20 pixels in the x and y coordinates, respectively, corresponding to and arcsec. We did not detect a source consistent with the position of SPIRITS 16tn to a 5- limiting magnitude of mag in the archival WFPC2 F606W image. We show the location of SPIRITS 16tn in the WFPC2 F606W image in the bottom left panel of Figure 1.
At the distance to NGC 3556 and correcting for only Galactic extinction, this corresponds to an upper limit on the absolute magnitude of the progenitor star of . Assuming a bolometric correction for an intermediate red supergiant (RSG) spectral type M0 of mag from Levesque et al. (2005), and adopting a solar bolometric magnitude of mag, we obtain a limit on the luminosity of the progenitor of . However, if we assume mag, as inferred to SPIRITS 16tn below in Section 3.3, our limit on the progenitor luminosity becomes far less constraining at .
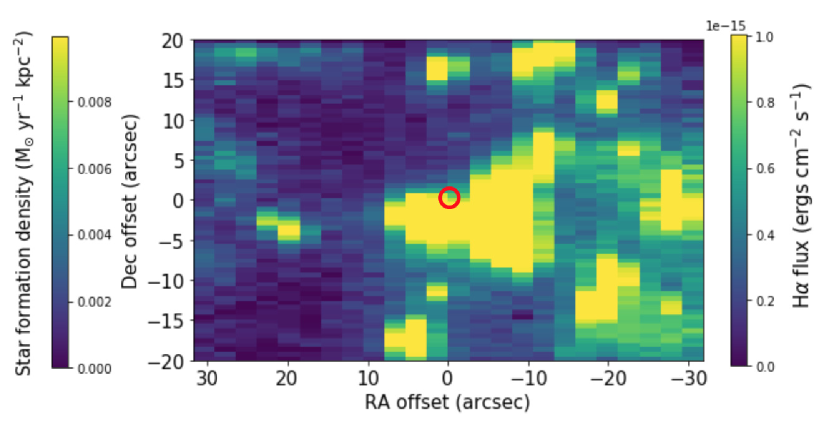
We use our PCWI observations to constrain the environment of the progenitor of SPIRITS 16tn. For each pixel in the processed data cube, we fit a simple polynomial to remove the continuum emission from the galaxy. We then measured the H flux in each pixel by integrating over the H emission line at the known velocity of the galaxy ( km s-1), to produce a two dimensional map of H flux near the location of the transient (Figure 5). The fluxes were then transformed to an equivalent luminosity using the distance to the galaxy, followed by conversion to an estimated star formation rate using the relations in Kennicutt (1998). The star formation rates in each pixel were then converted to an equivalent star formation surface density using an angular scale of 0.052 kpc arcsec-1. As shown, SPIRITS 16tn is coincident with a dense star forming environment with star formation rate densities of M⊙ yr-1 kpc-2.
3.2 Light curves and color evolution
SPIRITS 16tn was discovered at mag ( mag; ), as shown in the light curves in Figure 2. The high IR luminosity suggests an explosive event, likely an SN. At [4.5] the flux is observed to fade at a rate of mag day-1 between and days. In the near-IR -band, SPIRITS 16tn is observed to fade more slowly at a rate of mag day-1. These are faster than the expected bolometric decline rates of mag day-1 for light curves powered by the radioactive decay of 56Co (see, e.g., Gehrz, 1988; Gehrz & Ney, 1990). In the - and -bands, the observed decline rates are somewhat slower at and mag day-1, respectively.
At discovery, the IR color is mag. This corresponds to an effective blackbody temperature of K, possibly indicating that emission from warm dust is a significant contributor to the IR luminosity. At days, SPIRITS 16tn is observed to have faded more rapidly at [3.6] than [4.5], and evolves to a redder IR color of mag ( K).
3.3 SED
From our photometry, we constructed quasi-contemporaneous SEDs of SPIRITS 16tn at two epochs. For the first, we adopt the time of the HST/WFC3 detections at days as the nominal phase. We use a linear (in magnitudes) interpolation of the [4.5] light curve, and for the -band we extrapolate the observed decline back from the detection at days. We include the earlier Swift/UVOT non-detections as upper limits. As we only have one detection at [3.6] and cannot interpolate an observed decline rate, we consider this point as an upper limit under the assumption that the transient faded in this band between and days. For the second epoch, we adopt the time of the second [4.5] detection (and non-detection at [3.6]) at days as the nominal phase, using extrapolations of and -band decline rates and interpolating the -band light curve. The photometric magnitudes were converted to band-luminosities () at the assumed distance to the host and correcting only for Galactic reddening. To convert the optical points, we adopt Vega flux zero points and broadband effective wavelengths for the Bessell et al. (1998) Johnson-Cousins-Glass system. We adopt 2MASS system values from Cohen et al. (2003) for our photometry. For Spitzer [3.6] and [4.5] points, we use the flux zero points and effective wavelengths listed in the IRAC instrument handbook. We show the SED evolution of SPIRITS 16tn in Figure 6.
3.3.1 Estimating the extinction
The observed SED at days is remarkably red. It is likely that SPIRITS 16tn suffers from a high degree of host extinction given its location along an obvious dust lane in a highly-inclined, late-type host galaxy. The photometry of SPIRITS 16tn cannot directly constrain the extinction parameters without some assumptions about the intrinsic SED of the source. We attempt to estimate the extinction to SPIRITS 16tn by comparing the optical/near-IR SEDs to the SEDs of well-studied SNe.
Type II-Plateau SNe (SNe IIP) are the most common of all CC SN subtypes, and we use the light curves of the type IIP SN 2004et from Maguire et al. (2010) as a template for comparison. Following Maguire et al. (2010), we adopt an explosion date of UT 2004 September 22.0 (), a distance of Mpc, and a total (Galactic and host) extinction parametrized by mag for SN 2004et. The light curves of SN 2004et are well-sampled during each of the canonical phases of SN IIP light curve evolution: the day photospheric plateau phase, the rapid fall-off of the plateau, and the subsequent radioactive decline phase. The absolute phase of SPIRITS 16tn is highly uncertain as our most constraining pre-explosion upper limit is at 82 days before discovery. Using a linear interpolation of the light curves, we find the host extinction parameter which best reproduces the color of SN 2004et between 50 and 150 days in increments of 1 day. Even across this wide range of possible phases, the color evolution of SN 2004et is such that we find a range of , with a mean value of mag.
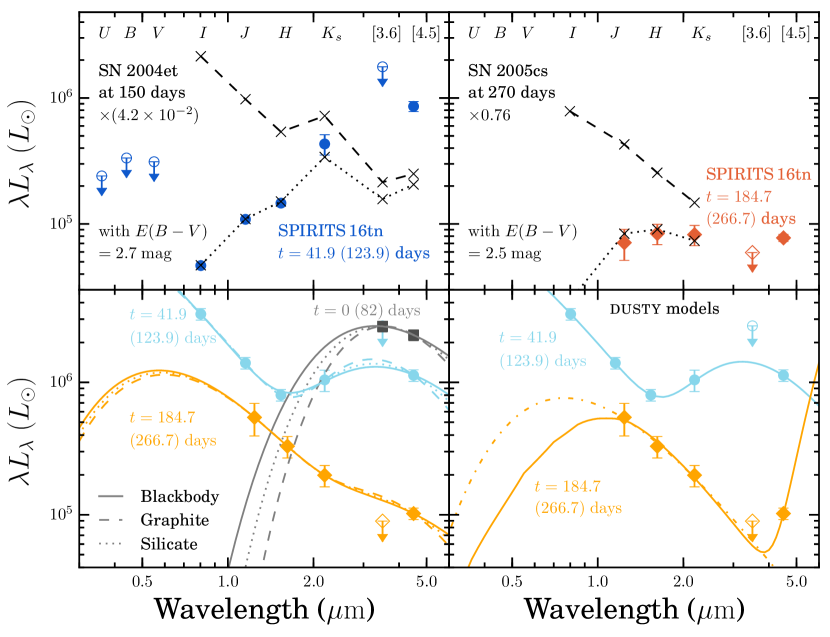
In the top-left panel of Figure 6, we show the observed SED of SPIRITS 16tn at days (maximum age 123.9 days) compared to the SED of SN 2004et at days post explosion, just after the start of radioactive decline phase, but scaled down by a factor of . Applying mag then provides a good match between the , and -band measurements to those of SPIRITS 16tn.
We performed a similar analysis using the light curves of SN 2005cs in nearby galaxy M51, a prototypical and well-observed low-luminosity SN IIP explosion (Pastorello et al., 2006, 2009). With a peak bolometric luminosity erg s-1, SN 2005cs was times fainter than SN 2004et. We adopt a distance to SN 2005cs of Mpc (Takáts & Vinkó, 2006), a total foreground extinction (Milky Way and host) of mag (Baron et al., 2007), and an explosion date of UT 2005 June 27.5 (MJD = 53548.5) as in Pastorello et al. (2009). While the -band light curve is well sampled throughout the plateau, fall-off, and decline-tail, the available near-IR and -band photometry is more limited. We compare the SED of SN 2005cs at a phase of 270 days to the late time SED of SPIRITS 16tn at days (maximum age 266.7 days) in the top-right panel of Figure 6. We find a suitable match with mag and scaling the SED of SN 2005cs by a factor of 0.76.
We find that assuming a SN II-like SED for SPIRITS 16tn indicates a high degree of foreground host extinction in the range of – mag (– mag assuming ), regardless of the absolute phase since explosion. This estimate is high compared to interstellar extinction for typical lines of sight in disk galaxies ( – mag kpc-1), but given high inclination of NGC 3556 and the coincidence of SPIRITS 16tn with a clear dust lane, it is not unreasonable. A direct comparison of the luminosity of SPIRITS 16tn is not possible in this analysis because of the large uncertainty in absolute phase. The inferred luminosity of SPIRITS 16tn at days is comparable, however, to a late-phase, low-luminosity, SN 2005cs-like explosion, suggesting SPIRITS 16tn is likely both heavily obscured and intrinsically faint.
3.3.2 Blackbody and dust component SED models
The bright IR emission associated with SPIRITS 16tn likely indicates the presence of warm dust. To model the dust emission, we assume an optically thin distribution of dust of total mass , composed of spherical grains of radius , radiating thermally at a single, equilibrium temperature . This idealized model is described in more detail by, e.g., Hildebrand (1983), Dwek (1985), and Fox et al. (2010).
The expected flux from the warm dust is
| (1) |
where is the Planck blackbody function, is the distance from the source, and is the dust mass absorption coefficient. In what follows, we assume a grain size of m, and use broken power law approximations to the dust mass absorption coefficients for dust composed entirely of either graphite or silicate (derived from Mie theory, see Figure 4 of Fox et al., 2010). To account for host extinction, we assume mag based on our comparison with SN 2005cs above888Here, we use a (Cardelli et al., 1989) extinction to deredden the photometry to match our analysis using the dust radiative code dusty below in Section 3.3.3..
We fit the IR photometric data for the Spitzer discovery epoch ( days) with this simple dust model for both graphite and silicate compositions to infer and . Under the assumption of optically thin dust, the IR luminosity is not sensitive to the size of the dust cloud. In the optically thick case, however, the radius corresponding to blackbody emission provides a lower bound on the dust radius, . We repeat the procedure for the quasi-contemporaneous optical–IR SEDs at and days, including an additional, hotter blackbody component of temperature and radius . We note that for , our optica/near-IR data do not cover the peak of the hotter SED component, and furthermore, the values inferred for and strongly depend on the choice of extinction. We do not attempt to make strong statements about the properties of the hotter component of the SED for these reasons, and focus our analysis on the properties of the dust component. The results are shown in the bottom-left panel of Figure 6 and summarized in Table 3.
| PhaseaaPhase is number of days since the earliest detection of this event on 2016 August 15.0 (). | Dust type | |||||
|---|---|---|---|---|---|---|
| (days) | (K) | (K) | ( ) | |||
| 0.0 | 1100 | 15.6 | blackbody | |||
| 680 | 1.1 | graphite | ||||
| 880 | 1.5 | silicate | ||||
| 41.9 | 17000 | 13.7 | 1100 | 15.4 | blackbody | |
| 14000 | 13.7 | 730 | 0.4 | graphite | ||
| 15000 | 13.7 | 900 | 0.7 | silicate | ||
| 187.4 | 6400 | 13.9 | 960 | 14.9 | blackbody | |
| 6100 | 13.9 | 660 | 0.04 | graphite | ||
| 6300 | 13.9 | 810 | 0.07 | silicate |
At days, our best fitting results to the IR SED give K (880 K) and () for graphite (silicate) dust. The blackbody fit to the data gives a higher temperature of K and sets a lower bound on the dust radius of cm.
At days, we find similar results for the dust temperature for each model, but infer a somewhat lower mass of () for graphite (silicate) dust, and a smaller bound on the dust radius from the blackbody fit of cm. We note, however, that the uncertainties in interpolating the [4.5] and -band light curves to construct the SED days may have artificially lowered these values.
At days, the data are no longer well fit by a hot source component and warm dust. The best-fitting results find – K, but are notably inconsistent with the upper limit at [3.6]. The blackbody dust radius is smaller by a factor of 3–5 compared to the earlier epochs, and the inferred dust masses are lower by at least a factor of 10. As discussed below in the context of a CC SN, the flux at [4.5] at this phase is likely enhanced by emission from the fundamental vibrational transition of CO and is not attributable solely to thermal emission from warm dust. The lack of evidence for a warm dust component at this phase may indicate the dust has cooled, shifting the flux to longer wavelengths not probed by our data. Alternatively, as discussed below in Section 4.2.2, the early presence and subsequent disappearance of the warm dust component may be interpreted as a evidence for an IR echo, i.e., the reprocessing of the UV/optical emission from the luminosity peak of the transient into the thermal IR by a shell of pre-existing circumstellar dust.
3.3.3 SED modeling with dusty
In addition to the simple dust models described above, we modeled the SED of SPIRITS 16tn using the dust radiative transfer code dusty (Ivezic & Elitzur, 1997; Ivezic et al., 1999; Elitzur & Ivezić, 2001). To find best-fitting models and allowed parameter ranges, we use a Markov Chain Monte Carlo (MCMC) wrapper around dusty. Here, we use a spherically symmetric distribution of graphite dust from Draine & Lee (1984) with a standard MRN grain size distribution (, m; Mathis et al., 1977). For the central luminosity source, we assume a simple blackbody spectrum, and allow the model to find best-fitting values for the source temperature, , and luminosity, , the optical depth in -band due to circumstellar dust, , the dust temperature, , and inner dust radius, . The source temperature and luminosity depend strongly on the assumed foreground extinction, but for simplicity, we again fix the extinction at mag as above. Our implementation of dusty uses a Cardelli et al. (1989) extinction law with , but the differences from the Fitzpatrick (1999) law assumed throughout the majority of this work are small at the wavelengths of interest in the optical and near-IR.
In this model, the dust is heated by the central source, i.e., the inferred properties of the dust are not independent of and . As is constrained strongly by the shape of the IR SED, we do not expect it to vary strongly with the other model parameters. Furthermore, it is fairly robust to the choice of extinction, as the effects of reddening are small in the IR. We expect, however, and to vary strongly with the central source properties, namely a hotter, more luminous central source will force dust at a given temperature to larger radii and correspondingly lower optical depths. This model also does not account for light travel time effects inherent to dust at large radii from an evolving, transient source.
The results of our dusty modeling at both epochs are given in Table 4, including both the values for each parameter for the best-fitting model, i.e., the model that minimizes , and the median value and 90% confidence interval limits from the MCMC posterior distributions. We note the the best-fitting values are sometimes near the extrema of the posterior distributions. The best fitting SEDs are also shown in the bottom-right panel of Figure 6 in comparison to the observations.
| Phasebb5- limiting magnitudes are given for non-detections. | ||||||||||
|---|---|---|---|---|---|---|---|---|---|---|
| (days) | (K) | (K) | ||||||||
| cc5- limiting magnitudes are given for non-detections.Luminosities calculated assuming a distance to NGC 3556 from NED of Mpc. | ||||||||||
At days, there is a clear IR excess requiring a warm dust component in addition to the interior, hotter source component. The MCMC results for this model have a dust temperature of K, consistent with the best-fitting value from our simple, optically thin graphite dust model at this epoch in Section 3.3.2, and an inner dust radius of cm at 90% confidence. As expected, is well constrained by the -band and [4.5] fluxes and does not vary strongly with the other parameters of the model. While producing a significant IR excess, the dust is optically thin at . Because our photometry does not cover the peak of the hot blackbody component, our measurements can only place a lower limit on the temperature and luminosity of the source, and the upper confidence limits found by the MCMC are not physically meaningful. We infer K and , but note that these limits are highly dependent on our choice of foreground host extinction, i.e., for mag, a lower blackbody temperature and luminosity would be consistent with the data.
At days, the hot component has faded by a factor of in the and bands. Again, our photometric measurements do not cover the peak of this component, and thus, the results of the MCMC modeling only allow us to estimate a lower limit on the source temperature of K. The flux in the redder bands, however, has faded more quickly. The dusty model fits a dust component to the excess flux at [4.5] with constraints from the MCMC at K, but there is a strong degeneracy between the cooler dust temperatures at smaller radii ( cm), and warmer dust at large radii ( cm). Again, it is likely that the flux at [4.5] is enhanced by emission from the fundamental vibrational mode of CO, and therefore, is probably not attributable to thermal emission from dust. Treating the measurement at [4.5] instead as an upper limit, we find that the SED of SPIRITS 16tn at days can be adequately modeled with a single blackbody component with K and .
3.4 The optical and near-IR spectra
At days after first detection, the optical spectrum of SPIRITS 16tn is characterized by a faint, red continuum. There are no clearly discernible features. The apparent dip in the spectrum near Å is coincident with a strong telluric absorption band, and is probably not intrinsic to the source.
The near-IR spectra of SPIRITS 16tn are shown in Figure 4. Though the Gemini N/GNIRS spectra covered the entire near-IR spectral range from 8500–25000 Å, we detect emission from SPIRITS 16tn only in the and regions of the spectrum. Due to uncertainty in the age of SPIRITS 16tn at discovery, the phase of SPIRITS 16tn is only constrained to be between 136 and 229 days since explosion at the time the spectra were taken.
As in the optical spectrum, we detect a red continuum associated with SPIRITS 16tn, but there are no unambiguous features in the near-IR. Though the spectra appear to peak near the centers of the and spectral windows, we suspect this may an artifact of low S/N and poor flux calibration, particularly near the edges of the bands where little flux is received through the atmosphere. As expected given the high degree of reddening inferred from the SED, we detect the strongest continuum emission in the spectral region, with an overall decrease in flux toward the blue.
4 Discussion
Here, we compare the observed properties of SPIRITS 16tn to those of various SNe subtypes to inform our interpretation of the observations.
4.1 Comparison to SNe Ia
The deep radio non-detections of SPIRITS 16tn (Section 2.4) may be easily explained if it is an SN of Type Ia. No SN Ia has been detected as a radio source to deep limits in radio luminosity as far down as erg s-1 Hz-1 for the nearest events (e.g. Panagia et al., 2006; Chomiuk et al., 2016). To test the hypothesis that SPIRITS 16tn is an SN Ia, we compare its IR color evolution and near-IR spectrum to well-studied events.
In the upper-right panel of Figure 7, we show the [4.5] light curve of SPIRITS 16tn compared to several SNe Ia from Johansson et al. (2017), who found that SN Ia form a homogenous class of objects at these wavelengths. The phases of the SPIRITS 16tn observations are shown as days since maximum, with assumed to be at the time of the Spitzer discovery observations and where the uncertainty in the time of maximum light is indicated by the horizontal error bars. SPIRITS 16tn shows a similar decline in luminosity at [4.5] to the sample of SNe Ia, but the color evolution, shown in the bottom-right panel of Figure 7, is notably inconsistent. At discovery, SPIRITS 16tn had a very red color of mag, and evolved to an even redder color of mag over a period of 185 days. In contrast, SNe Ia, which may be somewhat red at early times, evolve quickly to the blue reaching mag at a phase of days. SNe Ia may evolve again to redder colors at very late times, but the observed color of SPIRITS 16tn is too extreme for SNe Ia across the entire range of phases relevant here.
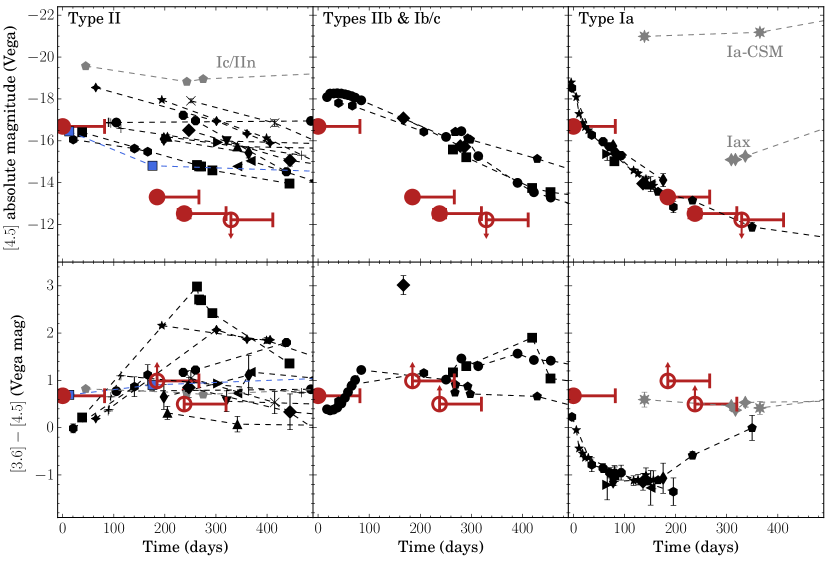
Redder colors have been observed during the first days in some thermonuclear SNe, e.g., the interaction powered type Ia-CSM SN 2005gj (Fox & Filippenko, 2013) and the unusual, dusty type Iax SN 2014dt (Fox et al., 2016). We show these SNe as the the gray symbols in the upper-right panel of Figure 7. Both events have an observed late-time, IR flux excess at [4.5] over a normal SN Ia light curve extending past 200 days, indicative of emission from warm dust. In the context of SNe Ia light curves, SPIRITS 16tn does not show such a late-time excess despite its red color.
We have not considered the effects of extinction from the host galaxy or local environment of the SN, e.g., from circumstellar dust. To produce a color excess of mag between [3.6] and [4.5] would require an additional mag of extinction, using the empirically derived broadband extinction parameters for [3.6] and [4.5] from Chapman et al. (2009), much higher than the inferred extinction to SPIRITS 16tn from the SED of mag.
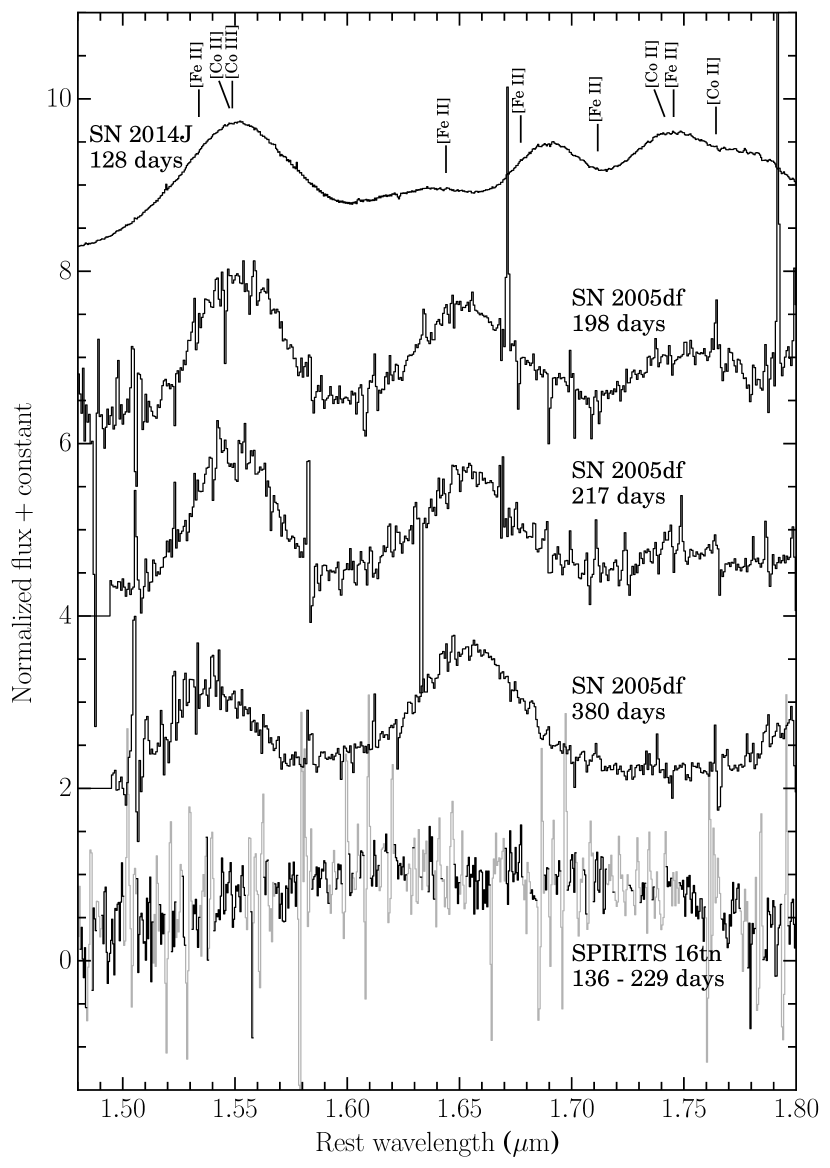
Furthermore, the featureless spectrum of SPIRITS 16tn is wholly inconsistent with normal SNe Ia at comparable phases. In Figure 8, we show the m region (-band) of the spectrum of SPIRITS 16tn, along with the late-time spectra of type Ia SN 2014J at a phase of 128 days (post -band maximum) from Johansson et al. (2017), and the type Ia SN 2005df at 198, 217, and 380 days (Diamond et al., 2015). The phase of our near-IR spectrum is constrained to be between 136–229 days. The late-time spectra of SNe Ia are dominated by blended, nebular emission features, primarily forbidden transitions of Fe-peak elements (Bowers et al., 1997; Spyromilio et al., 2004). In the -band region, Diamond et al. (2015) specifically identified transitions of [Fe ii], [Co ii], and [Co iii] in the spectra of type Ia SN 2005df, as labeled in Figure 8. They noted that the spectrum became Fe-dominated as the Co features faded between – days, however the strong, broad emission lines of [Fe ii] persisted to very late phases. These features are completely absent from the near-IR spectrum of SPIRITS 16tn, and thus, we definitively rule out a reddened SN Ia in this case.
4.2 Comparison to CC SNe
We compare the light curve at [4.5] of SPIRITS 16tn to CC SNe of type II and stripped-envelope types IIb and Ib/c the upper left and center panels of Figure 7. Among the hydrogen-rich type II SNe, we do not distinguish between the photometric subtypes IIP and IIL, defined by the presence of a light curve plateau or linear decline, respectively. Our dataset for SPIRITS 16tn is insufficient to make such a distinction. Furthermore, the existence of the two truly distinct subclasses is debated and recent studies of large SN II samples have suggested that type IIP and IIL SNe may instead form a continuous distribution in their observed properties (e.g., Anderson et al., 2014; Sanders et al., 2015; Rubin & Gal-Yam, 2016).
The observed [4.5] luminosity peak of SPIRITS 16tn at mag is in the range of type II SNe, but is mag fainter than is observed for the sample of stripped-envelope events. Notably, SPIRITS 16tn fades more rapidly at [4.5] at mag day-1 than any of the CC SNe for which comparable data were available. The fastest event in the comparison sample is the type II SN 2013ej (black octagons in the upper-left panel of Figure 7) fading at a rate of mag day-1. Although the sample of stripped-envelope SNe is small, they appear relatively more homogeneous at [4.5] compared to SNe II, with typical decline rates between – mag day-1. Given the larger degree of variation in both peak luminosity at [4.5] and the observed decline rate for SNe II, it is easier to reconcile the lower [4.5] peak and faster decline of SPIRITS 16tn with the sample of SNe II.
As shown in the bottom panels of Figure 7, SPIRITS 16tn develops a very red color by days of mag. Similarly red colors have been observed at comparable phases for several CC SNe including the type IIP events SN 2005af (Szalai & Vinkó, 2013, and reference therein), SN 2004et (Kotak et al., 2009), and SN 2014bi (Tinyanont et al., 2016), and for the type IIb/Ib event SPIRITS 15C (Jencson et al., 2017). While a red mid-IR color may be a signature of thermal emission from warm dust ( K for mag), emission from the 1–0 vibrational transition of CO at m can produce excess flux at [4.5] compared to the other mid-IR bands. This emission feature has been directly identified in the mid-IR spectra of several type II SNe including SN 1987A (e.g., Meikle et al., 1989; Wooden et al., 1993), SN 2004dj (Kotak et al., 2005), and SN 2005af (Kotak et al., 2006). Corroborating the identification of this feature, the bandheads of the vibrational overtones of CO, which produce excess emission beyond 2.3 m at the end of the -band, have also been observed in, e.g., SN 1987A (Meikle et al., 1989), SN 2004dj (Kotak et al., 2005), and the stripped-envelope events SN 2011dh (Ergon et al., 2015) and SPIRITS 15C (Jencson et al., 2017). We do not clearly detect this feature in our near-IR spectra from – days, but note that the vibrational overtones may be significantly weaker than the fundamental band at [4.5] and hidden in our low S/N spectra. Furthermore, the spectra were obtained at an earlier epoch, possibly before CO formed in the ejecta. In the context of CC SNe, we consider CO emission to be the most likely explanation for the observed mid-IR color evolution of SPIRITS 16tn, indicating the presence of CO in the ejecta by days.
In Figure 2, we compare the multi-band light curves of SPIRITS 16tn to those of the low-luminosity type IIP SN 2005cs. The light curves of SN 2005cs are shifted to the distance of SPIRITS 16tn and reddened with mag, as inferred from our SED comparison in Section 3.3. For the relative phase offset shown, and with an additional offset in apparent magnitude of mag (factor of in flux), the late-time light curves can be reasonably well-matched to those of SPIRITS 16tn. In this scenario, our HST observations of SPIRITS 16tn at days would have occurred just after the transition to the nebular phase and require a plateau duration days to be consistent with our -band pre-explosion non-detection. Given our lack of early-time date for SPIRITS 16tn and the notable gap in near-IR photometric coverage of SN 2005cs during the transition to the nebular phase, we cannot perform a more detailed light curve comparison. Still, we find the optical–near-IR light curve evolution of SPIRITS 16tn to be largely consistent with a SN 2005cs-like, low-luminosity type IIP event.
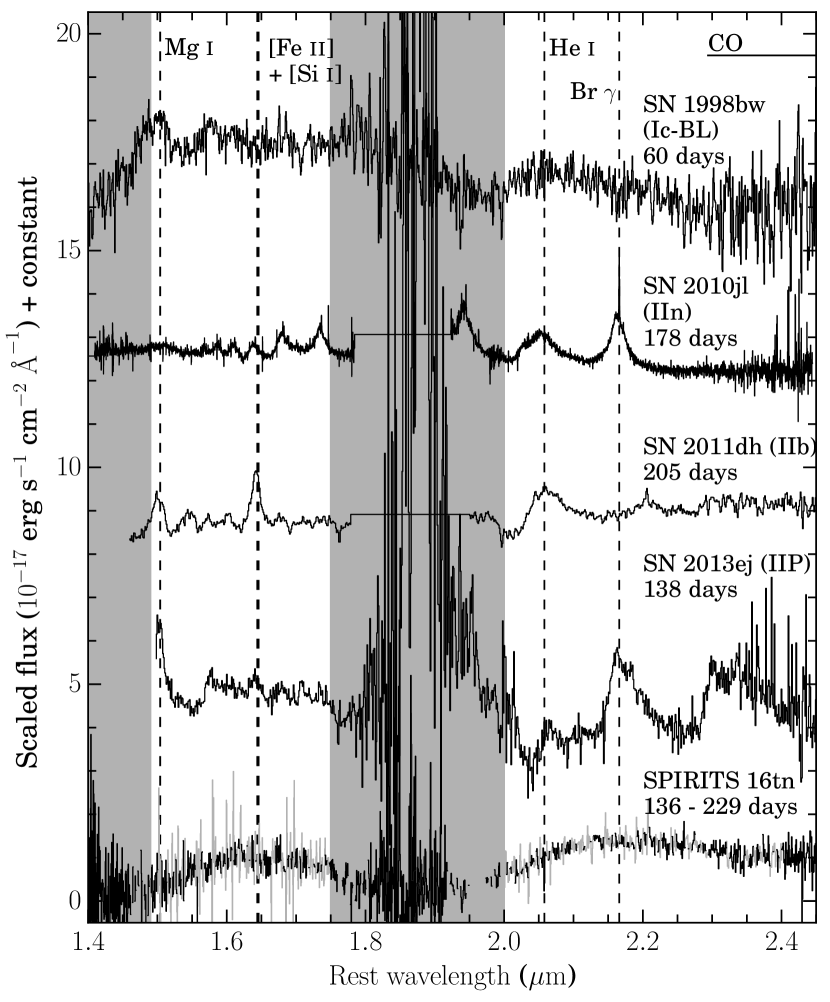
In Figure 9, we compare near-IR spectrum of SPIRITS 16tn at a phase between 136–229 days post maximum to those of CC SNe of various types including the type Ic broad-lined (Ic-BL) SN 1998bw (Patat et al., 2001), the type IIn SN 2010jl (Borish et al., 2015), the type IIb SN 2011dh (Ergon et al., 2015), and the type II SN 2013ej (Yuan et al., 2016). Some of the most prominent features identified in late-phase CC SNe in the and -bands are labeled in Figure 9, including Mg i at m, blended [Fe ii] at m and [Si i] at m, He I at m, Br at m, and the bandheads of the vibrational overtones of CO beyond m. Pa , a typically strong H i feature in SNe II, is unfortunately in the low atmospheric transmission region between the and spectral windows where we did not receive any detectable flux from SPIRITS 16tn.
As we do not detect any clear features in SPIRITS 16tn, we are unable to provide a definitive classification. However, the lack of clear a spectroscopic signature of the interaction of the SN ejecta with a dense CSM, often observed as superimposed narrow ( km s-1) and broad ( km s-1) components of the H i and He i features, can rule out a strongly interacting SN IIn. We suggest that at late times, it is possible the near-IR spectral features of non-interacting CC SNe may be very weak.
4.2.1 Radio limits
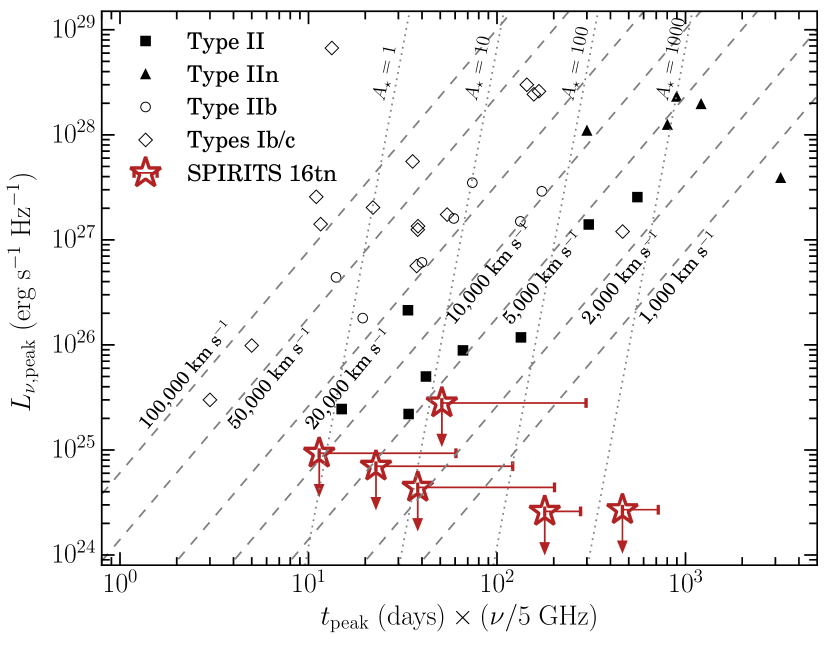
In Figure 10, we show our limits on the radio luminosity of SPIRITS 16tn as a function of phase compared to the peak radio luminosities and times to peak for CC SNe. Radio emission is produced in CC SNe when the fastest SN ejecta interact with and shock the slow-moving pre-explosion CSM from the pre-explosion stellar wind of the progenitor. As the shockwave propagates through the CSM, turbulent instabilities amplify magnetic fields and accelerate relativistic electrons (Chevalier, 1982). The resultant radio emission is characterized by slowly declining, optically thin, non-thermal synchrotron and early, optically thick absorption at low frequencies. Proposed absorption mechanisms include synchrotron self-absorption (SSA) or internal free-free absorption in the emitting region and free-free absorption by the external, ionized CSM (e.g., Chevalier, 1982, 1998).
If one assumes SSA is dominant, for an electron population with an energy spectral index of , the size of the radio emitting region at the time of the SSA peak can be calculated as (Chevalier, 1998)
| (2) |
where is the ratio of the energy density in relativistic electrons to that in the magnetic field, is the fraction of the spherical volume filled by the radio emitting region, is the peak flux at frequency , and is the distance to the source. If additional absorption mechanisms are important, this radius must be even larger. The shockwave velocities, , inferred for (assuming equipartition) and (as estimated in Chevalier & Fransson, 2006) are shown as the dashed lines in Figure 10. We the note weak dependence in Eq. 2 of the shock radius on these parameters.
For a steady, pre-SN stellar wind, the density profile of the CSM as a function of radius, , is , where is the mass loss rate and is the wind velocity. is the normalization of the CSM density profile as in Chevalier (1982). As calculated by Chevalier & Fransson (2006), the radio emission at time since explosion of a CC SN is sensitive to the density profile of the CSM as
| (3) |
where and is a dimensionless proxy for . We show lines of constant in Figure 10, determined largely by the strong dependence of this parameter on .
Our deep non-detections of SPIRITS 16tn indicate that this event is either an intrinsically weak radio source, or that the emission is heavily absorbed. Though we do not rule out radio emission arising at very late times, characteristic of strongly interacting SNe IIn with a dense CSM, this scenario is unlikely given the lack of prominent interaction features in the optical/near-IR spectra. Our observations are inconsistent with most varieties of stripped-envelope events, which tend to be more luminous radio sources. A high velocity ( km s-1) SN Ic with a fast-evolving radio light curve, however, is not explicitly ruled out (cf. SN 2007gr, Soderberg et al., 2010, and PTF12gzk, Horesh et al., 2013b). Our optical–IR SED analysis and comparisons with well-studied SNe II indicate that SPIRITS 16tn falls at the low end of the SN luminosity function, and a weak SN II radio counterpart is consistent with our observations. Using Eq. 3, for typical SN II shock velocities of km s-1, our non-detections can constrain . For a steady pre-SN wind, we then infer a limit on the pre-SN mass loss rate of yr-1.
Such mass loss rate is consistent with a low-luminosity RSG ( – ) based on the standard observational prescriptions of de Jager et al. (1988) (See, e.g., Figure 3 of Smith, 2014). This supports the picture of SPIRITS 16tn as a low-luminosity SN II arising from the explosion of a low-mass ( – ) RSG progenitor. We note that, depending on the assumed explosion date of SPIRITS 16tn, for km s-1 and km s-1, the timing of our radio observations probes the mass loss history of the progenitor only in the final – yr before the explosion.
Concurrent panchromatic observations spanning the radio to the X-ray have indicated deviations from energy equipartition in some SNe. For example, for SN 2011dh (Soderberg et al., 2012) find and . Adopting such values results in only a modest decrease in the shock velocity (using Eq. 2) by a factor of 1.2, an an increase in our limit on the mass loss rate by a factor of 2.4. Alternatively for SN 2011dh, (Horesh et al., 2013a) find –, adopting a value of 1000 as a reasonable average, and . This still results in only a modest decrease in the inferred shock velocity by a factor of 1.4, and for a fixed wind velocity, the limit on the mass loss rate increases by a factor of 20.
4.2.2 Origin of the observed dust component
In Section 3.3, our modeling of the SED of SPIRITS 16tn at and days suggests the presence of an IR component (– K) powered by thermal emission by at least – of warm dust (our observations are not sensitive to any additional dust at cooler temperatures). By days, we no longer see evidence for this warm dust component, indicating it has either faded or the dust has cooled, shifting the flux to longer wavelengths.
The dust emission may arise either from pre-existing circumstellar dust formed in the pre-SN wind of the progenitor, or newly formed dust in the dense, rapidly cooling ejecta behind the SN shock. For a shock velocity of km s-1, the radius of the shock at a phase of 82.0 days (the maximum age of SPIRITS 16tn at days) is cm. As we infer a lower limit on the dust radius (blackbody radius from Section 3.3.2) of cm that is smaller than that shock radius, it is plausible that the emitting dust is located in the post-shock cooling zone. Given the low observed dust temperatures, however, it is unlikely that the early dust component is due to newly formed dust in the ejecta. We would expect newly formed dust to be near the evaporation temperature, as, given sufficiently high densities, dust grains will begin to condense as soon as the drop in temperature of the radiation environment allows. Typical values for astrophysical dust are K for graphite, and K for silicate, significantly hotter than the observed dust component.
For pre-existing dust, we can interpret the observed IR-excess as an IR echo. In this scenario, a pre-existing shell of dust is heated by the peak luminosity of the explosion and re-radiates this energy thermally in the IR. The duration of the echo is related to the size of the dust shell from geometrical arguments as . The observations of the warm dust component between to days, and subsequent fading by days, when the maximum age of SPIRITS 16tn is days, would then require cm.
As a consistency check, we can estimate the peak luminosity, , of the transient required to heat spherical dust grains of radius within this range of distances to the observed temperatures. The energy absorbed by a dust grain is balanced by the energy it radiates as
| (4) |
The peak luminosity of the transient is then given by
| (5) |
where and are Planck-averaged emission and absorption efficiencies for Laor & Draine (1993) dust grains. For the temperature of the incident radiation field we assume values K and K, characteristic of an SN at peak. We use a value of erg cm-2 K-4 s-1 for the Stefan-Boltzmann constant. For graphite grains of size m at K, we find erg s-1 for K, and similar values of erg s-1 for K. Alternatively, for grains of silicate composition at K, we find a somewhat higher values of erg s-1 for K, or erg s-1 for K.
While these estimates are crude, we can still compare them to the observed range of peak luminosities for SNe II. Faran et al. (2018), for example, estimate the bolometric luminosities of 29 SNe II and find peak values spanning at least two orders of magnitude and ranging from – erg s-1. Similarly, the pseudo-bolometric (from to -band) light curves of the sample of SN II from Valenti et al. (2016) span – erg s-1. Among the faintest SNe II known, the quasi-bolometric light curve of SN 1999br peaked at only erg s-1 (Pastorello et al., 2004, 2009). The observed range of peak luminosities for SNe II is similar to the range of luminosities estimated above to explain the IR-excess of SPIRITS 16tn as a dust echo.
We can also estimate the pre-SN mass loss rate of the progenitor star necessary to support the such an echo. We assume the dust is concentrated in a thin shell with , a dust-to-gas ratio of , and again a pre-SN wind velocity of km s-1 and find – yr-1 for the range of allowed by the observations. These estimates are a factor of – higher than that in Section 4.2.1 based on the radio observations, but probe an earlier time in the mass loss history of the progenitor of somewhere between – yr before explosion. While such mass loss rates would imply a more luminous and massive RSG progenitor ( – , again assuming standard de Jager et al., 1988 prescriptions), if the dust is confined to a shell, this could indicate a relatively brief episode of enhanced mass loss.
4.3 Non-SN transient scenarios
As we are unable to provide a definitive classification of SPIRITS 16tn as a CC SN, we briefly consider other observed classes luminous IR transients as possible explanations for this event.
4.3.1 SN 2008S and NGC 300 OT2008-1-like transients
SN 2008S and the luminous 2008 optical transient in NGC 300 (NGC 300 OT2008-1) are the prototypes of a distinct class of transients. They have optically obscured progenitors, but bright mid-IR pre-explosion counterparts ( mag), suggested to be extreme asymptotic giant branch stars of intermediate mass (–) self-obscured by a dense, dusty wind (Prieto et al., 2008; Bond et al., 2009; Thompson et al., 2009). They are less luminous than typical CC SNe at peak ( erg s-1 for SN 2008S, Botticella et al., 2009). Emission lines in their spectra indicate slow expansion velocities of 70–80 km s-1 (e.g., Bond et al., 2009; Humphreys et al., 2011). A proposed physical scenario is a weak explosion, possibly an electron-capture SN, or massive stellar eruption that destroys most of the obscuring dust, allowing the transient to be optically luminous. The development of a late-time IR excess, however, suggests the dust reforms, obscuring the optical transient at late times (e.g., Thompson et al., 2009; Kochanek, 2011; Szczygieł et al., 2012). Both events are now fainter than their progenitor luminosities as [3.6] and [4.5], suggesting the transients were terminal events (Adams et al., 2016b).
The [4.5] light curve of SN 2008S is shown as the blue squares in Figure 7 compared to SPIRITS 16tn and several SNe II. The peak luminosity at [4.5] is similar to SPIRITS 16tn. Furthermore, the peak bolometric luminosity of SN 2008S-like events is sufficient to power the IR dust echo discussed in Section 4.2.2. The IR luminosity of SPIRITS 16tn declines more rapidly, and we do not observe a late-time IR excess powered by newly formed dust, inconsistent with the characteristic evolution of SN 2008S-like events.
4.3.2 Massive stellar mergers
The 2011 transient in NGC 4490 (hereafter NGC 4490-OT, Smith et al., 2016) and M101 2015OT-1 (Blagorodnova et al., 2017) are proposed massive analogs of the galactic contact binary merger V1309 Sco (Tylenda et al., 2011), and the B-type stellar merger V838 Mon (Bond et al., 2003; Sparks et al., 2008). These events typically have unobscured, optical progenitors, irregular, multi-peaked light curves, increasingly red colors with time, and significant late-time IR excesses powered by copious dust formation. Their spectra show relatively narrow emission features of H i indicating low velocities of km s-1.
In the IR, NGC 4490-OT peaked at mag, mag fainter than SPIRITS 16tn. The inferred mass for the progenitor system of NGC 4490-OT was 20–30 , and thus, a merger origin for the more luminous SPIRITS 16tn would likely require an exceptionally massive progenitor. Furthermore, the IR light curve of NGC 4490-OT is long-lived, remaining too luminous at phases days to be powered by an IR echo (Smith et al., 2016). The relatively short-lived IR excess of SPIRITS 16tn, interpreted here as an IR echo, is generally inconsistent with the observed IR evolution typical of massive star mergers.
5 Summary and Conclusions
SPIRITS 16tn is a luminous ( mag) mid-IR transient discovered with Spitzer/IRAC during the ongoing SPIRITS survey in the nearby galaxy NGC 3556. We believe SPIRITS 16tn is a possible SN. Despite being one of nearest SNe discovered in 2016 at only 8.8 Mpc, it was completely missed by optical searches due to heavy extinction. The transient position is coincident with a dark dust lane in the inclined, star-forming disk of the host. We estimate a total extinction of – mag, making SPIRITS 16tn one of the most highly obscured SNe yet discovered in the IR.
The [4.5] light curve shows a fast decline of mag day-1, and the source becomes increasingly red in the mid-IR from mag to mag between and days post discovery. The optical and near-IR spectra display a featureless, red continuum, ruling out an SN Ia, but preclude a definitive spectroscopic classification. The SED at days post discovery is extremely red, and can be matched to an SN II-like SED with – mag of extinction. Furthermore, our analysis suggest SPIRITS 16tn may be an intrinsically dim event similar to the well-studied, low-luminosity SN 2005cs. Modeling of the SED indicates the presence of a warm dust component ( – K), which fades by days. This is consistent with an IR echo powered by a circumstellar shell of dust located somewhere between – cm heated by a peak luminosity of – erg s-1, similar to the range of observed peak luminosities for SNe II.
The source is not detected to deep limits in the radio across frequencies of 3–15.5 GHz, constraining the radio luminosity to erg s-1 Hz-1 between and days. This effectively rules out most stripped-envelope SNe, except possibly the most rapidly evolving, high velocity events that may peak in the radio at very early times. A late-rising, interaction-powered SN IIn may be consistent with our radio limits, but the typically strong spectroscopic signatures of interaction with a dense CSM are absent from our optical/near-IR spectra. SNe II, typically the weakest radio emitters among CC SNe, are the most consistent with our deep radio limits, and in this context we can constrain the pre-SN mass loss rate of the progenitor to yr-1. This is consistent with a lower mass RSG progenitor of –.
We analyzed the available pre-explosion Spitzer/IRAC 2011 imaging, and HST/WFPC2 F606W imaging of NGC 3556 covering the site of SPIRITS 16tn from 1994, and do not detect a candidate progenitor star. Given the high degree of extinction inferred to SPIRITS 16tn, however, we are unable to place meaningful limits on the progenitor luminosity.
Taken together, we find the most likely explanation for the observed properties of SPIRITS 16tn to be an SN II explosion that is both highly obscured by foreground, host-galaxy dust, and intrinsically low-luminosity. This discovery strengthens the fact that, even in the local 10 Mpc volume, SN searches appear to be incomplete. Transient surveys in the IR have the unique ability to find dust obscured or otherwise optically dim events, allowing for the true nearby SN population to be uncovered.
References
- Adams et al. (2016a) Adams, S. M., Jencson, J. E., & Kasliwal, M. M. 2016a, The Astronomer’s Telegram, 9441
- Adams et al. (2016b) Adams, S. M., Kochanek, C. S., Prieto, J. L., et al. 2016b, MNRAS, 460, 1645
- Alam et al. (2015) Alam, S., Albareti, F. D., Allende Prieto, C., et al. 2015, ApJS, 219, 12
- Anderson et al. (2014) Anderson, J. P., González-Gaitán, S., Hamuy, M., et al. 2014, ApJ, 786, 67
- Baron et al. (2007) Baron, E., Branch, D., & Hauschildt, P. H. 2007, ApJ, 662, 1148
- Bessell et al. (1998) Bessell, M. S., Castelli, F., & Plez, B. 1998, A&A, 333, 231
- Blagorodnova et al. (2017) Blagorodnova, N., Kotak, R., Polshaw, J., et al. 2017, ApJ, 834, 107
- Bode & Evans (1980) Bode, M. F., & Evans, A. 1980, MNRAS, 193, 21P
- Bond et al. (2009) Bond, H. E., Bedin, L. R., Bonanos, A. Z., et al. 2009, ApJ, 695, L154
- Bond et al. (2003) Bond, H. E., Henden, A., Levay, Z. G., et al. 2003, Nature, 422, 405
- Borish et al. (2015) Borish, H. J., Huang, C., Chevalier, R. A., et al. 2015, ApJ, 801, 7
- Botticella et al. (2012) Botticella, M. T., Smartt, S. J., Kennicutt, R. C., et al. 2012, A&A, 537, A132
- Botticella et al. (2009) Botticella, M. T., Pastorello, A., Smartt, S. J., et al. 2009, MNRAS, 398, 1041
- Bowers et al. (1997) Bowers, E. J. C., Meikle, W. P. S., Geballe, T. R., et al. 1997, MNRAS, 290, 663
- Butler et al. (2012) Butler, N., Klein, C., Fox, O., et al. 2012, in Proc. SPIE, Vol. 8446, Ground-based and Airborne Instrumentation for Astronomy IV, 844610
- Cappellaro et al. (2015) Cappellaro, E., Botticella, M. T., Pignata, G., et al. 2015, A&A, 584, A62
- Cardelli et al. (1989) Cardelli, J. A., Clayton, G. C., & Mathis, J. S. 1989, ApJ, 345, 245
- Casali et al. (2007) Casali, M., Adamson, A., Alves de Oliveira, C., et al. 2007, A&A, 467, 777
- Cenko et al. (2006) Cenko, S. B., Fox, D. B., Moon, D.-S., et al. 2006, PASP, 118, 1396
- Chapman et al. (2009) Chapman, N. L., Mundy, L. G., Lai, S.-P., & Evans, II, N. J. 2009, ApJ, 690, 496
- Chevalier (1982) Chevalier, R. A. 1982, ApJ, 259, 302
- Chevalier (1998) —. 1998, ApJ, 499, 810
- Chevalier & Fransson (2006) Chevalier, R. A., & Fransson, C. 2006, ApJ, 651, 381
- Chevalier et al. (2006) Chevalier, R. A., Fransson, C., & Nymark, T. K. 2006, ApJ, 641, 1029
- Chomiuk et al. (2016) Chomiuk, L., Soderberg, A. M., Chevalier, R. A., et al. 2016, ApJ, 821, 119
- Ciatti & Barbon (1971) Ciatti, F., & Barbon, R. 1971, Mem. Soc. Astron. Italiana, 42, 145
- Cohen et al. (2003) Cohen, M., Wheaton, W. A., & Megeath, S. T. 2003, AJ, 126, 1090
- Cresci et al. (2007) Cresci, G., Mannucci, F., Della Valle, M., & Maiolino, R. 2007, A&A, 462, 927
- Davies et al. (2009) Davies, M. L., Franzen, T. M. O., Davies, R. D., et al. 2009, MNRAS, 400, 984
- de Jager et al. (1988) de Jager, C., Nieuwenhuijzen, H., & van der Hucht, K. A. 1988, A&AS, 72, 259
- Diamond et al. (2015) Diamond, T. R., Hoeflich, P., & Gerardy, C. L. 2015, ApJ, 806, 107
- Draine & Lee (1984) Draine, B. T., & Lee, H. M. 1984, ApJ, 285, 89
- Dwek (1983) Dwek, E. 1983, ApJ, 274, 175
- Dwek (1985) —. 1985, ApJ, 297, 719
- Eisenstein et al. (2011) Eisenstein, D. J., Weinberg, D. H., Agol, E., et al. 2011, AJ, 142, 72
- Elitzur & Ivezić (2001) Elitzur, M., & Ivezić, Ž. 2001, MNRAS, 327, 403
- Ergon et al. (2015) Ergon, M., Jerkstrand, A., Sollerman, J., et al. 2015, A&A, 580, A142
- Faran et al. (2018) Faran, T., Nakar, E., & Poznanski, D. 2018, MNRAS, 473, 513
- Fazio et al. (2004) Fazio, G. G., Hora, J. L., Allen, L. E., et al. 2004, ApJS, 154, 10
- Fitzpatrick (1999) Fitzpatrick, E. L. 1999, PASP, 111, 63
- Fox et al. (2010) Fox, O. D., Chevalier, R. A., Dwek, E., et al. 2010, ApJ, 725, 1768
- Fox & Filippenko (2013) Fox, O. D., & Filippenko, A. V. 2013, ApJ, 772, L6
- Fox et al. (2011) Fox, O. D., Chevalier, R. A., Skrutskie, M. F., et al. 2011, ApJ, 741, 7
- Fox et al. (2016) Fox, O. D., Johansson, J., Kasliwal, M., et al. 2016, ApJ, 816, L13
- Gehrels et al. (2004) Gehrels, N., Chincarini, G., Giommi, P., et al. 2004, ApJ, 611, 1005
- Gehrz (1988) Gehrz, R. D. 1988, Nature, 333, 705
- Gehrz & Ney (1990) Gehrz, R. D., & Ney, E. P. 1990, Proceedings of the National Academy of Science, 87, 4354
- Gehrz et al. (2007) Gehrz, R. D., Roellig, T. L., Werner, M. W., et al. 2007, Review of Scientific Instruments, 78, 011302
- Grossan et al. (1999) Grossan, B., Spillar, E., Tripp, R., et al. 1999, AJ, 118, 705
- Hildebrand (1983) Hildebrand, R. H. 1983, QJRAS, 24, 267
- Hodgkin et al. (2009) Hodgkin, S. T., Irwin, M. J., Hewett, P. C., & Warren, S. J. 2009, MNRAS, 394, 675
- Horesh et al. (2013a) Horesh, A., Stockdale, C., Fox, D. B., et al. 2013a, MNRAS, 436, 1258
- Horesh et al. (2013b) Horesh, A., Kulkarni, S. R., Corsi, A., et al. 2013b, ApJ, 778, 63
- Horiuchi et al. (2013) Horiuchi, S., Beacom, J. F., Bothwell, M. S., & Thompson, T. A. 2013, ApJ, 769, 113
- Horiuchi et al. (2011) Horiuchi, S., Beacom, J. F., Kochanek, C. S., et al. 2011, ApJ, 738, 154
- Humphreys et al. (2011) Humphreys, R. M., Bond, H. E., Bedin, L. R., et al. 2011, ApJ, 743, 118
- Ivezic & Elitzur (1997) Ivezic, Z., & Elitzur, M. 1997, MNRAS, 287, 799
- Ivezic et al. (1999) Ivezic, Z., Nenkova, M., & Elitzur, M. 1999, ArXiv Astrophysics e-prints, astro-ph/9910475
- Jencson et al. (2016) Jencson, J. E., Adams, S., Kasliwal, M. M., et al. 2016, The Astronomer’s Telegram, 9434
- Jencson et al. (2017) Jencson, J. E., Kasliwal, M. M., Johansson, J., et al. 2017, ApJ, 837, 167
- Johansson et al. (2017) Johansson, J., Goobar, A., Kasliwal, M. M., et al. 2017, MNRAS, 466, 3442
- Jordi et al. (2006) Jordi, K., Grebel, E. K., & Ammon, K. 2006, A&A, 460, 339
- Kankare et al. (2008) Kankare, E., Mattila, S., Ryder, S., et al. 2008, ApJ, 689, L97
- Kankare et al. (2012) —. 2012, ApJ, 744, L19
- Kasliwal et al. (2017) Kasliwal, M. M., Bally, J., Masci, F., et al. 2017, ApJ, 839, 88
- Kennicutt (1998) Kennicutt, Jr., R. C. 1998, ARA&A, 36, 189
- Kochanek (2011) Kochanek, C. S. 2011, ApJ, 741, 37
- Kool et al. (2018) Kool, E. C., Ryder, S., Kankare, E., et al. 2018, MNRAS, 473, 5641
- Kotak et al. (2005) Kotak, R., Meikle, P., van Dyk, S. D., Höflich, P. A., & Mattila, S. 2005, ApJ, 628, L123
- Kotak et al. (2006) Kotak, R., Meikle, P., Pozzo, M., et al. 2006, ApJ, 651, L117
- Kotak et al. (2009) Kotak, R., Meikle, W. P. S., Farrah, D., et al. 2009, ApJ, 704, 306
- Laor & Draine (1993) Laor, A., & Draine, B. T. 1993, ApJ, 402, 441
- Levesque et al. (2005) Levesque, E. M., Massey, P., Olsen, K. A. G., et al. 2005, ApJ, 628, 973
- Maguire et al. (2010) Maguire, K., Di Carlo, E., Smartt, S. J., et al. 2010, MNRAS, 404, 981
- Maiolino et al. (2002) Maiolino, R., Vanzi, L., Mannucci, F., et al. 2002, A&A, 389, 84
- Mannucci et al. (2003) Mannucci, F., Maiolino, R., Cresci, G., et al. 2003, A&A, 401, 519
- Martin et al. (2014) Martin, D. C., Chang, D., Matuszewski, M., et al. 2014, ApJ, 786, 106
- Mathis et al. (1977) Mathis, J. S., Rumpl, W., & Nordsieck, K. H. 1977, ApJ, 217, 425
- Mattila & Meikle (2001) Mattila, S., & Meikle, W. P. S. 2001, MNRAS, 324, 325
- Mattila et al. (2007) Mattila, S., Väisänen, P., Farrah, D., et al. 2007, ApJ, 659, L9
- Mattila et al. (2008) Mattila, S., Meikle, W. P. S., Lundqvist, P., et al. 2008, MNRAS, 389, 141
- Mattila et al. (2012) Mattila, S., Dahlen, T., Efstathiou, A., et al. 2012, ApJ, 756, 111
- Matuszewski et al. (2010) Matuszewski, M., Chang, D., Crabill, R. M., et al. 2010, in Proc. SPIE, Vol. 7735, Ground-based and Airborne Instrumentation for Astronomy III, 77350P
- Meikle et al. (1989) Meikle, W. P. S., Spyromilio, J., Varani, G.-F., & Allen, D. A. 1989, MNRAS, 238, 193
- Meikle et al. (2011) Meikle, W. P. S., Kotak, R., Farrah, D., et al. 2011, ApJ, 732, 109
- Miluzio et al. (2013) Miluzio, M., Cappellaro, E., Botticella, M. T., et al. 2013, A&A, 554, A127
- Nousek (2004) Nousek, J. A. 2004, in Proc. SPIE, Vol. 5165, X-Ray and Gamma-Ray Instrumentation for Astronomy XIII, ed. K. A. Flanagan & O. H. W. Siegmund, 169
- Oke et al. (1995) Oke, J. B., Cohen, J. G., Carr, M., et al. 1995, PASP, 107, 375
- Panagia et al. (2006) Panagia, N., Van Dyk, S. D., Weiler, K. W., et al. 2006, ApJ, 646, 369
- Pastorello et al. (2004) Pastorello, A., Zampieri, L., Turatto, M., et al. 2004, MNRAS, 347, 74
- Pastorello et al. (2006) Pastorello, A., Sauer, D., Taubenberger, S., et al. 2006, MNRAS, 370, 1752
- Pastorello et al. (2009) Pastorello, A., Valenti, S., Zampieri, L., et al. 2009, MNRAS, 394, 2266
- Patat et al. (2001) Patat, F., Cappellaro, E., Danziger, J., et al. 2001, ApJ, 555, 900
- Perrott et al. (2013) Perrott, Y. C., Scaife, A. M. M., Green, D. A., et al. 2013, MNRAS, 429, 3330
- Prieto et al. (2008) Prieto, J. L., Kistler, M. D., Thompson, T. A., et al. 2008, ApJ, 681, L9
- Romero-Cañizales et al. (2014) Romero-Cañizales, C., Herrero-Illana, R., Pérez-Torres, M. A., et al. 2014, MNRAS, 440, 1067
- Roming et al. (2005) Roming, P. W. A., Kennedy, T. E., Mason, K. O., et al. 2005, Space Sci. Rev., 120, 95
- Rubin & Gal-Yam (2016) Rubin, A., & Gal-Yam, A. 2016, ApJ, 828, 111
- Sanders et al. (2015) Sanders, N. E., Soderberg, A. M., Gezari, S., et al. 2015, ApJ, 799, 208
- Schlafly & Finkbeiner (2011) Schlafly, E. F., & Finkbeiner, D. P. 2011, ApJ, 737, 103
- Schlegel et al. (1998) Schlegel, D. J., Finkbeiner, D. P., & Davis, M. 1998, ApJ, 500, 525
- Sheth et al. (2010) Sheth, K., Regan, M., Hinz, J. L., et al. 2010, PASP, 122, 1397
- Shostak (1975) Shostak, G. S. 1975, ApJ, 198, 527
- Smith (2014) Smith, N. 2014, ARA&A, 52, 487
- Smith et al. (2016) Smith, N., Andrews, J. E., Van Dyk, S. D., et al. 2016, MNRAS, 458, 950
- Soderberg et al. (2010) Soderberg, A. M., Brunthaler, A., Nakar, E., Chevalier, R. A., & Bietenholz, M. F. 2010, ApJ, 725, 922
- Soderberg et al. (2012) Soderberg, A. M., Margutti, R., Zauderer, B. A., et al. 2012, ApJ, 752, 78
- Sorce et al. (2014) Sorce, J. G., Tully, R. B., Courtois, H. M., et al. 2014, MNRAS, 444, 527
- Sparks et al. (2008) Sparks, W. B., Bond, H. E., Cracraft, M., et al. 2008, AJ, 135, 605
- Spyromilio et al. (2004) Spyromilio, J., Gilmozzi, R., Sollerman, J., et al. 2004, A&A, 426, 547
- Szalai & Vinkó (2013) Szalai, T., & Vinkó, J. 2013, A&A, 549, A79
- Szalai et al. (2011) Szalai, T., Vinkó, J., Balog, Z., et al. 2011, A&A, 527, A61
- Szczygieł et al. (2012) Szczygieł, D. M., Prieto, J. L., Kochanek, C. S., et al. 2012, ApJ, 750, 77
- Takáts & Vinkó (2006) Takáts, K., & Vinkó, J. 2006, MNRAS, 372, 1735
- Tartaglia et al. (2018) Tartaglia, L., Sand, D. J., Valenti, S., et al. 2018, ApJ, 853, 62
- Thompson et al. (2009) Thompson, T. A., Prieto, J. L., Stanek, K. Z., et al. 2009, ApJ, 705, 1364
- Tinyanont et al. (2016) Tinyanont, S., Kasliwal, M. M., Fox, O. D., et al. 2016, ApJ, 833, 231
- Tylenda et al. (2011) Tylenda, R., Hajduk, M., Kamiński, T., et al. 2011, A&A, 528, A114
- Vacca et al. (2003) Vacca, W. D., Cushing, M. C., & Rayner, J. T. 2003, PASP, 115, 389
- Valenti et al. (2016) Valenti, S., Howell, D. A., Stritzinger, M. D., et al. 2016, MNRAS, 459, 3939
- Watson et al. (2012) Watson, A. M., Richer, M. G., Bloom, J. S., et al. 2012, in Proc. SPIE, Vol. 8444, Ground-based and Airborne Telescopes IV, 84445L
- Werner et al. (2004) Werner, M. W., Roellig, T. L., Low, F. J., et al. 2004, ApJS, 154, 1
- Wilson et al. (2003) Wilson, J. C., Eikenberry, S. S., Henderson, C. P., et al. 2003, in Proc. SPIE, Vol. 4841, Instrument Design and Performance for Optical/Infrared Ground-based Telescopes, ed. M. Iye & A. F. M. Moorwood, 451
- Wooden et al. (1993) Wooden, D. H., Rank, D. M., Bregman, J. D., et al. 1993, ApJS, 88, 477
- Xiao & Eldridge (2015) Xiao, L., & Eldridge, J. J. 2015, MNRAS, 452, 2597
- Yuan et al. (2016) Yuan, F., Jerkstrand, A., Valenti, S., et al. 2016, MNRAS, 461, 2003