[DAA] [Wroclaw] [Gliwice] [Graz,Vienna] [Zagreb] DAA]Department of Astronomy and Astrophysics, University of Toronto, 50. St.George St., Toronto, Ontario, Canada M5S 3H4 Wroclaw]Instytut Astronomiczny, Uniwersytet Wrocławski, Kopernika 11, 51-622 Wrocław, Poland Gliwice]Instytut Automatyki, Wydział Automatyki Elektroniki i Informatyki, Politechnika Ślaska, Akademicka 16, 44-100 Gliwice, Poland Graz]Institute of Communication Networks and Satellite Communications, Graz University of Technology, Inffeldgasse 12, 8010 Graz, Austria Vienna]Institut für Astrophysik, Universität Wien, Türkenschanzstrasse 17, 1180 Wien, Austria Zagreb]Department of Physics, Faculty of Science, University of Zagreb, Bijenička cesta 32, 10000 Zagreb, Croatia
Lyrae as seen by BRITE in 2016
Abstract
The BTr and UBr satellites observed Lyrae from May to October 2016 to continuously monitor light-curve instabilities with the time resolution of about 100 mins. An instrumental problem affecting localized patches on the BTr CCD detector has been discovered by comparison with partly simultaneous UBr observations; the origin of the problem is being investigated. A zero-point offset permits utilization of the BTr data for a time-series characterization of deviations from the mean light curve defined to mag.
1 Introduction
Lyrae (HD 174638) is a bright (, ) eclipsing binary with the orbital period of days, consisting of a B6-8 II star and an invisible component which eclipses the B-type star, but otherwise is very hard to detect and characterize. The B-type star has the mass of about while the estimated mass of the invisible star is about . The invisible component is apparently completely shrouded by a toroidal accretion disk formed by matter continuously transferring from the B-type star. The mass transfer results in the period lengthening at an almost constant rate of 19 seconds per year; as the result, the eclipses have shifted in time – relative to a linear prediction – by several orbital cycles during the two and half centuries of the photometric observations of Lyrae. The complex structure of the system and its extensive studies are described in a highly readable review by Harmanec (2002). Among the more recent research of particular note are the efforts at the interferometric imaging of the binary by the CHARA array by Zhao et al. (2008) and Bonneau et al. (2011) while the latest among several Lyrae models are by Mennickent & Djurašević (2013).
Light curves of Lyrae have been known to show a relatively large scatter. An international campaign organized in 1959 (Larsson-Leander, 1969a, b) gave indications that the scatter may reach 0.1 mag (see Fig. 8 in Larsson-Leander (1969a)) and confirmed that it is not due to difficulties with photometric observations of bright stars or to large angular distances to comparison stars, but is definitely caused by the star itself. Later multi-spectral observations and several efforts at modelling of the binary led to a firm conclusion that the mass transfer and accretion processes are unstable and cause photometric instabilities. However, those instabilities remain poorly characterized, mostly because of the moderately long orbital period and the diurnal interruptions of ground-based observations. A possibility of a continuous photometric monitoring over several months was the driver for the BRITE Constellation observations of Lyrae reported here.
2 Observations
The BRITE Constellation observations of Lyrae were made between 4 May 2016 and 3 October 2016, for 152 days. Two red-filter satellites, UniBRITE (UBr) and BRITE-Toronto (BTr) and one blue-filter satellite, BRITE-Lem (BLb), were dedicated to these observations. Technical difficulties with BLb permitted the blue-filter observations for only a fraction of one binary cycle between and 1647 ( HJD) making these observations useless for the current purpose.

The results for the red-filter satellites are shown in Figure 1 using different symbols for the satellite-orientation and the initial image-processing “setups”. Since the setups involved possible zero-point magnitude shifts, a decision was made to use only the longest time series designated as BTr-3, BTr-4 and UBr (i.e. the combined setups UBr-1 and UBr-2). The BTr observations were made with the same exposure time of 3 secs resulting in a median error per a single observation of 0.014 mag. For the UBr observations with 1 sec exposures, the median error was 0.019 mag. Most of our analysis has been done with the orbit averages. The satellite-orbit sampling corresponded to 98.27 minutes (BTr) or 100.4 minutes (UBr).
3 An instrumental problem
The BTr observations provided an excellent record of the variability of Lyr sampled almost continuously for 132 days (over 10 binary orbits) at 98 minute intervals. The BTr-3 series extended from to 1553 while the BTr-4 from 1553 to 1652. The BTr-4 series overlapped for 50.1 days (3.87 orbital cycles of the binary) with the UBr observations providing a crucial check of consistency of results for both satellites. The check revealed a problem: While the UBr observations showed an expected amplitude of about 0.85 mag, the amplitude from the otherwise excellent BTr series turned out to be larger than one magnitude. Such large amplitude was never observed before. We had no previous indications of any nonlinearities in the BTr data. It became obvious that we were seeing a new instrumental problem.
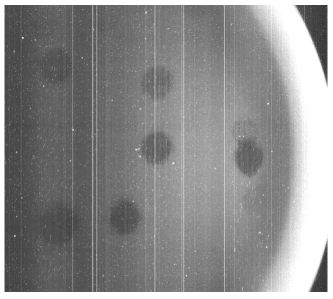
An investigation of an older, full-frame image from BTr showed that the CCD background does show very shallow depressions of similar shape and size (Fig. 2). Apparently, the image of Lyr happened to be located in one of such blemishes. Further work attempting to characterize the problem has revealed that: (1) All three red-filter satellites show the blemishes to some degree, but they do not seem to be present in the two blue-filter satellites. (2) The blemishes are very similar in terms of their size and shape in all three red-filter satellites. The problem is currently intensely investigated in order to characterize it and invent methods of its mitigation. New, full-frame data are currently being collected for all the satellites. This is a tedious and slow process and has a detrimental impact on the ongoing science operations. All indications are that it is related to the particle-radiation damage to the CCD detectors causing charge transfer and trapping effects. However, it is not clear why only the red-filter satellites are affected and why the signal-loss areas are so similar in size ( pix) and depth (about 50 ADU). It is possible that a cloud of secondary particles is released from an optical element (a lens or filter) when it is hit by an energetic, primary particle (proton); the distance between CCD and the optical element would then determine the size of the affected region.
An attempt has been made to salvage the otherwise excellent BTr data for Lyr. The presence of background blemishes suggested that some sort of a process modified the signal which – by itself – retained linear properties. We assumed that the CCD signal was modified by removal of a constant amount . This led to a smaller detected signal, with an increased degree of modulation and thus a larger observed amplitude of Lyr. This way we could restore by assuming that the amplitude of light variations observed by BTr must be the same for the overlapping UBr observations; obviously, a second assumption was made that observations from UBr had not been affected by a similar problem. The mapping turned out to be excellent with a perfect match of the two fluxes variations. Thanks to the very large number of the observations we could determine the lost signal to be of the maximum-light Lyr signal. While the correction applies strictly to the BTr-4 setup, we used it also for the BTr-3 series because the star remained in the same location on the CCD detector. Still, for a study of the light-curve deviations, the two time series must be done separately because of the possible small zero-point magnitude shift between the setups, although a combined, phase-binned light curve (see below) indicates a perfect agreement between the two datasets.

4 The phase-binned light curve
The satellite-orbit averaged data consist of 410 BTr-3, 1230 Btr-4 and 479 UBr observations with the scatter estimated from individual data points of 0.0017, 0.0013 and 0.0019 mag, respectively (median errors); the small errors are obviously due to the large number of averaged data points. Although deviations from the mean, phase-binned BTr light curve (Fig. 3) reach mag, the median errors per 0.01 phase interval are typically at the level of 0.002 – 0.003 mag. Such a well defined light curve appears to be of interest for improvement of the Lyr system models; a preliminary use of the current light curve was presented by KP at the EWASS Conference111European Week of Astronomy and Space Science, Prague, 26-30 June 2017 (no publication).. The flux derivative computed using the light curve is smooth so that its inflection points confirm the predicted eclipse contact phases. It is interesting that small, but fairly well defined additional notches in the derivative seem to appear slightly beyond the contact phases, at approximately similar distances; they may indicate the presence of matter distributed in the system above the disk/star surfaces.
5 Conclusions
The instrumental problem that we detected in the BTr data in the Lyr observations is currently investigated as it may be occurring in all three red-filter satellites. A simple, linear signal transformation has permitted to correct the time series of BTr data. This time series is unique as it extends for over 10 orbital cycles of a continuous and frequent ( min) time sampling. The data will be the subject of a time-series analysis while the mean light curve will be used for a Lyr modelling.
Acknowledgements.
Thanks are due to Dr. Dietrich Baade for reminding the first author about the well-known effect pertaining to the noise in averaged light curves. SMR acknowledges the financial support from NSERC (Canada). The support from the Polish National Science Centre (NCN) is acknowledged by APi (grant 2016/21/B/ST9/01126) and APo (grant 2016/21/D/ ST9/00656). KP has been supported in part by the Croatian Science Foundation under the grant 2014-09-8656.References
- Bonneau et al. (2011) Bonneau, D., et al., A large H line forming region for the massive interacting binaries Lyrae and Sagitarii, A&A 532, A148 (2011)
- Harmanec (2002) Harmanec, P., The ever challenging emission-line binary Lyrae, Astron. Nachr. 323, 87 (2002)
- Larsson-Leander (1969a) Larsson-Leander, G., Photometric results from the 1959 international campaign on Beta Lyrae, Arkiv för Astronomi 5, 253 (1969a)
- Larsson-Leander (1969b) Larsson-Leander, G., Changes in the light curve of Beta Lyrae 1958 – 1959, in Non-Periodic Phenomena in Variable Stars, IAU Coll. 65, 443 (1969b)
- Mennickent & Djurašević (2013) Mennickent, R. E., Djurašević, G., On the accretion disc and evolutionary stage of Lyrae, MNRAS 432, 799 (2013)
- Zhao et al. (2008) Zhao, M., et al., First resolved images of the eclipsing and interacting binary Lyrae, ApJ 684, L95 (2008)