Infrared and visible scintillation of Ho3+-doped YAG and YLF crystals
Abstract
In our effort to develop a new kind of detector for low-energy, low-rate energy deposition events we have investigated the cathodo- and radioluminescence of Ho:YAG and Ho:YLF single crystals in an extended wavelength range from nm to nm. The emission spectra of both crystals show a much more intense emission in the infrared range than in the visible one. We estimate an infrared light yield of photons/keV when exciting the crystals with X-rays of energy keV. The main reason of this high value is due to the Ho3+ ions energy levels scheme that allows efficient cross relaxation processes to occur even at low dopant concentration.
keywords:
Ho:YAG, Ho:YLF, Cathodoluminescence, Radioluminescence, Infrared and visible light yield.1 Introduction
Inorganic scintillators with very high light yield (LY) have been discovered in the past two decades, such as Ce:LuI3 and Eu:SrI2. However, the energetic efficiency of the electron-hole pair creation sets a fundamental upper limit on the LY. This is equal to photons/MeV, where is the scintillator band gap and is a constant [1]. In order to overcome this limit, we have started investigating the feasibility of laser induced scintillation enhancement in rare earth (RE) doped crystals.
In the particular combination of excited state laser absorption and cross relaxation, known as photon avalanche upconversion [2, 3], the emission of several photons can be accomplished by starting from one single excited RE ion. In the cross relaxation process, a high energy excited RE ion shares fraction of its energy to another one in the ground state. In this way, it is even possible to obtain two RE ions in the same state. A suitably tuned laser can promote these two excited ions to the former high energy state, in which cross relaxation is likely to occur once more, thereby accomplishing an avalanche process.
This scheme has been implemented for the realization of a low noise infrared radiation detector [4]. We are investigating if it is applicable also for the rare- and low energy- deposition event detection, such as dark matter and nucleus-neutrino scattering research, in which a fast scintillator response is not necessary. We have already proved that the laser induced upconversion process can shift scintillation to a shorter wavelength, which can be detected with higher quantum efficiency and with lower dark count rate than in the infrared range [5].
However, at this point of our research, the intrinsic noise of this kind of detector is still too high for any practical applications [5, 6]. Although the laser wavelength does not correspond to any pure electronic transitions from the ground state, the laser light can still be absorbed by means of several mechanisms, leading to populate the same level that we would like to be populated only by particle excitation.
In order to reduce this laser induced noise background, we are looking for different RE dopant, matrix and pump scheme combinations. At the same time we are also attempting at proving that low energy RE manifolds are efficiently populated by energetic radiation. To this purpose, we use electron impact- and X-rays excitations to investigate the visible and infrared scintillation of different RE-matrix combination. We have already reported a relatively high LY yield for Nd:YAG (1.1%) and Tm:YAG (4.4%) [7] and in this paper we present the results for Holmium doped YAG and YLF crystals.
2 Experimental Apparatus and Method
Experimental apparatus and procedures have previously been described in detail [8, 7]. Here, we only recall their principal features.
A home-made electron gun is able to deliver a current up to A of electrons with energy of 70 keV [9]. In the pulsed mode, electron bunches of several nC as short as s can be released with an adjustable repetition rate between 20 and 1000 Hz. A thin Titanium, or Tantalum foil, is placed in front of the sample and allows the recollection and analysis of the electrons accelerated towards the crystals.
In the Titanium case, the electrons cross the foil with an energy loss estimated to be 15 keV. In the Tantalum case, the electrons are stopped in the foil and X-rays are produced. A Carbon foil, placed between the metal foil and the crystals, filters out the lower energy X-rays component.
We have studied a home-grown Ho3+:YLiF4 0.8% at (7x7x8 mm3) and a commercial Ho3+:Y3Al5O12 2.5% at (3 mm in height, 5 mm in diameter) single crystals.
The crystals cathodo- and radioluminescence are detected with Silicon (Hamamatsu mod. S1337-1010BQ), InGaAs (Thorlabs. mod. DET20C) and LN2-cooled InAs (Hamamatsu mod. P7163) photodiodes for the 200-1000 nm, 900-1700 nm, 1000-3100 nm ranges, respectively. In the same bands, the spectra are acquired by using Silicon (Oceanoptics, mod. Redtide650) and InGaAs (Oceanoptics, mod. NIR512) CCD based spectrometers, and also by using a FT-IR interferometer (Bruker, mod. Equinox 55) coupled with the InAs photodiode.
As we have shown in [7], the LY in the optical range , that is defined by the photodiode responsivity and by the transmittance of the optical filters used, can be calculated as
| (1) | |||||
Here, is the total integrated detector response to the electron gun pulse charge , the distance between the crystal and the detector of area and the power spectral density of the scintillation.
The normalization factor only depends on the type of excitation employed, either electrons of X-rays, but does not depend on what detector or crystal are used. The IR spectrum can only be investigated by cathodoluminescence because it is much more intense than radioluminescence in our experimental setup. Eq. (1) thus provides the relative value of the integrated light per unit injected charge in the different bands of the three photodiodes and allows us to merge the spectra, thereby obtaining the scintillation spectral density in the extended wavelength band between nm and nm.
In order to determine the absolute visible LY for X-rays excitation, the normalisation factor is estimated by measuring the ratio of a calibrated Pr:LuYAG (0.16%) scintillator [8, 10]. The LY in the whole wavelength range is then obtained by exploiting the features of the cathodoluminescence spectra.
3 Experimental results and discussion
Our results are presented in two different subsections on the basis of the excitation type. We report the response of the crystals to the electron impact excitation and the cathodoluminescence spectra in the first subsection, whereas the value of the LY in the different bands in the second one.
3.1 Cathodoluminescence
Our apparatus allows us to record also the time evolution and the intensity of both electron current injection and detector photocurrent . The bandwidth of the transimpedance amplifier (Femto, mod. DLPCA-200) and the characteristic time of the electron pulse allow us to accurately estimate the crystals emission lifetime when it is longer than a few tens of microseconds. We show in Fig. 1 typical and signals. Their offline time integration provides the values of and . As shown in Fig. 2, there is a linear relationship between them for all the wavelength bands investigated in the Ho:YLF crystal.
On the contrary, the scintillation response of the Ho:YAG is linear only for small amplitude of the charge pulse and shows a saturation effect for larger charge injection as one can see by inspecting Fig. 3. In this latter case, the following analysis is restricted to the low excitation range and possible explanations of the saturation phenomenon will be considered in the Appendix.
The ratio , obtained by a linear fit, is also measured as a function of the relative distance of the detector from the crystal in order to obtain an accurate value of the solid angle subtended by different photodiodes. Actually, assuming the point source approximation, the data are fitted to the following formula
| (2) |
thereby estimating the parameter with an accuracy within 5% for all set of data (see, for instance, the inset in Fig. 2).
The parameter measured by using Silicon, InGaAs and InAs photodiodes coupled with appropriate longpass and shortpass filter, allow us to normalize the spectra acquired in different wavelength range by means of Eq. (1). The resulting emission spectra of Ho:YAG and Ho:YLF are displayed in Fig. 4. We only show the spectral range up to to nm because no emission above the thermal background has been observed.


3.1.1 Spectroscopic analysis
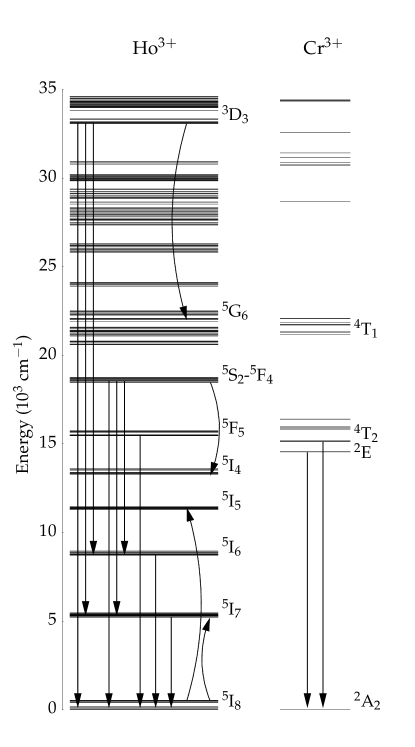
The spectra of the two cystals present several features at the same wavelengths which favorably compare with laser induced fluorescence from similar crystals both in visible [11, 12, 13] and infrared range [14]. These emissions are attributed to the radiative relaxation of Holmium manifolds and their identification can be found in Tab. 1 and diplayed in Fig. 5.
The Ho:YAG spectrum is characterized by two more emissions than Ho:YLF. The first one is located at about nm is typical and is widely attributed to Cr3+ ions in YAG [15]. The broadband feature in 250-nm range is the same observed by exciting with X-rays undoped YAG [16] and lightly Ho doped oxide crystals [17] and it is due to the matrix exciton emission.
The lack of self trapped exciton emission in the fluoride crystal, expected in the 200-300 nm range [18], is probably caused by a more efficient energy transfer from excitons to Holmium ions than in the Ho:YAG crystal. This energy transfer process and the consequent multiphonon relaxation lead to the population of the manifold, whose emission is heavily quenched by cross relaxation [11], in particular by the resonant process (,)(,). It is expected that most of the ions in states non radiatively relax to the and states where another efficient cross relaxation process (,)(,) occurs. In the case of Ho:YAG, energy transfer between Ho3+ in 4f manifolds and Cr3+ ions are also possible as it is reported for Ho:Cr:YAlO3 crystals [19].
The multiphonon relaxation dominates for and manifolds, thereby increasing the population of . On the contrary, for the manifold the radiative emission represents a competitive process reducing the multiphonon relaxation towards the manifold and the following emission in the mid-infrared range. In accordance with the fact that the multiphonon relaxation rate is much lower in fluorides than in oxides matrices, we measure a lifetime for manifold of () s in YAG and () ms in YLF crystals. Similar values can be found in literature [20]. This consideration rationalizes the observation that the ratio of the total intensity irradiated in the nm band, stemming from the transition, to that in the nm band, resulting from the transition, is very different for the two investigated crystals.
The occurence of cross relaxation, that is able to excite up to 3 Holmium ions in low energy manifolds and from each ions in high energy can explain the stronger emission in infrared band than in the visible and ultraviolet ones.
After the higher energy manifolds have relaxed, the Ho3+ manifold relaxes to the ground state with a single exponential lifetime of () ms and () ms in YAG (inset in Fig. 1) and YLF matrix, respectively, in quite good agreement with the values reported in literature [21, 22].
It should be noted that the Holmium ions 5d-4f transitions, expected in the nm range for fluoride crystals [23], cannot be observed with our apparatus.
| Transition | emission [nm] | Transition | emission [nm] |
|---|---|---|---|
| 300 | - | 1000-1050 | |
| 360 | - | 1340-1450 | |
| 410 | 640-660 | ||
| 460 | 950-1000 | ||
| - | 530-550 | 1130-1210 | |
| - | 740-760 | 1800-2100 |
3.2 X-ray light yield
We assume that the emission spectra obtained with electron impact or X-ray excitation are the same. The validity of this hypothesis is supported by the fact that X-rays produce photoelectrons in the crystals and it has previously been verified for Nd:YAG crystal [7].
The LY determination is accomplished by following the procedure outlined elsewhere [7]. The measure of the ratio is repeated exciting with X-rays the two Holmium doped crystals and a calibrated Pr:LuYAG (0.16%) scintillator whose LY we reported to be photons/keV in the 200-1100 nm band[8, 10]. An active integrator with a time constant of s and conversion factor mV/fC is used in order to improve the signal to noise ratio. The linearity between excitation charge and scintillation is observed even for Ho:YAG crystal because of the low excitation density.
By comparing the luminescence intensity with that of the calibrated crystal through Eq. (1), we can estimate the visible LY of the Ho doped crystals. Then, the infrared LY is inferred from the cathodoluminescence spectra. Reabsorption is estimated to be of a few % at most and is, thus, neglected.
The values obtained for different bands have an overall accuracy better than 15% and they are shown in Tab. 2. Both crystals have low LY in UV-visible range, less than photons/keV, whereas almost photons/keV are emitted in the infrared range. Taking into account the calculated branching ratio for the manifold [22, 20], we can infer a LY at 2800 nm due to the transition of 0.5 photons/keV for Ho:YLF and a negligible value for Ho:YAG.
Fujimoto et al. reported photons/keV for undoped YAG single crystals. As we measure photons/keV for the same band in Ho:YAG 2.5%, we can conclude that the matrix exciton-Holmium and Chromium ions energy transfer occurs with high efficiency. As the energy transfer and cross relaxation processes dominate in these crystals, we do not expect much higher infrared LY in crystals more heavily doped with Ho3+, in which concentration quenching could also occur.
| LY [photons/keV] | ||
|---|---|---|
| Wavelength range [nm] | Ho:YLF | Ho:YAG |
| 200-500 | 0.1 | 1.0 |
| 500-800 | 1.4 | 0.7 |
| 1100-1300 | 5.4 | 0.3 |
| 1800-2200 | 32.8 | 38.8 |
4 Conclusions
The investigation of the feasibility of a rare event detector in which lasers can greatly increase the LY of the active medium, has led us to study the infrared scintillation of rare earth doped crystals. In this paper, we have presented the cathodoluminescence spectra and we have estimated the LY of Ho:YAG (2.5%) and Ho:YLF (0.8%) crystals in a broad band between 200 nm and 2300 nm.
As the quantum efficiency of the lowest excited manifold is almost 1, the reported LYs in nm range directly provide the number of Ho3+ ions per keV that are excited into this manifold. The obtained high values, together with those related to Tm:YAG and Nd:YAG crystals [7], build a strong case that particle excitation can efficiently populate the low energy, metastable rare earth ion manifolds.
Surely, cross relaxation is an efficient process in which a high lying excited level populates the low lying ones but we cannot claim if other mechanisms take place. Secondary electrons, with not enough energy to create electron-hole pair, could still excite the RE ions into their low lying levels. In addition, it is well known that less than half of the particle energy can be converted into visible radiation [1], the remaining part creating a large number of phonons that could equally populate the low energy RE ion levels.
At the best of our knowledge there are no studies about these topics. We believe that the investigation of the infrared light yield could be a useful mean to study the radiation-matter interaction.
For these reasons, and also for the realization of a suitable detector, in the next future, we plan to investigate the temperature dependence o of the LY in several wavelength ranges and, therefore, of the number of ions excited in the different manifolds for crystals as a function of the dopant concentration.
Appendix A Saturation behaviour
Chromium impurities are common in aluminate crystals and we believe that their presence is responsible for the nonlinearity of Ho:YAG cathodoluminescence. A similar effect has been reported for the emission of Cr in ZnGa2O4 [26].
Actually, a high population inversion of the Ho3+ activators can be ruled out as a cause of the saturation effect because in the present experiment we used a low current density and because no saturation shows up in the Ho:YLF crystal which has a lower dopant concentration but displays a similar luminescence efficiency.
We have observed that the intensity of the UV exciton emission and of the Ho3+ manifold luminescence share the same dependence on the injected electron charge. Of the many processes that cause the excitonic decay, there must be at least one that becomes more efficient as the electron gun excitation increases, thereby making less likely other competitive mechanisms such as exciton radiative recombination and exciton-Ho3+ ions energy transfer.
One of these excitation intensity dependent processes might be the ionization CrCr2+. Actually, Cr3+ ion is an efficient electron trap [27]. As the charge transfer OCr3+ band lies at 230 nm [28], just above the self trapped exciton emission, it is therefore reasonable that ionization can occur more likely for Cr3+ in a excited state than in ground state. As the current injection increases, more Cr3+ ions are excited from the ground state into the metastable manifold . The host excitons more likely give up their energy in the OCr3+ charge transfer rather than in the direct excitation Ho3+ ions or in the radiative decay.
We have also observed saturation in the nm, nm, and nm bands. The charge transfer process probably explains the saturation behaviour of the exciton- and Ho3+ emission, as well as the emission in the nm range. Actually, some Cr3+ ions in the metastable state are ionized to the Cr2+ state instead of relaxing and emitting in near infrared. These ions quickly and non radiatively lose an electron but do not necessary return to excited levels, thereby decreasing the luminescent efficiency.
Cr3+ ions in YAG present broad band absorptions at nm and at nm. We believe that Cr3+ in the manifold with a long lifetime could give also rise to a depopulation of low lying Ho3+ manifolds via the energy transfer upconversion (Ho3+ , Cr3+ )(Ho3+ , Cr3+ ), thereby quenching the Ho3+ infrared scintillation. Actually, we have characterized the emission by its lifetime of ms, in quite good agreement with literature data for Cr:YAG crystals at room temperature [29].
These hypotheses can explain why a similar saturation behaviour is also shown by Er:YAG 0.5%, whose cathodoluminescence displays the same Cr3+ emission at 700 nm [5], whereas the Tm:YAG and Nd:YAG response in the same excitation condition is linear [7]. Actually, in the latter cases Cr3+ impurities are equally expected to be present but the emission is missing. The lifetime of state is strongly shorten because efficient energy transfers occur in Tm3+ or Nd3+ doped crystals.
Acknowlegments
This work is supported by Istituto Nazionale di Fisica Nucleare (INFN) within AXIOMA project. We thank C. Braggio and M. Guarise of the Padova and Ferrara University respectively for the useful discussion, Prof. M. Tonelli and Prof. A. Di Lieto of the Pisa University for providing us with the Ho:YLF crystal.
Bibliography
References
- [1] P. Dorenbos, IEEE T. Nucl. Sci. 57 (2010) 1162–1167. doi:10.1109/TNS.2009.2031140.
- [2] M. F. Joubert, S. Guy, B. Jacquier, Phys. Rev. B 48 (1993) 10031–10037. doi:10.1103/PhysRevB.48.10031.
- [3] M. Malinowski, A. Wnuk, Z. Frukacz, G. Chadeyron, R. Mahiou, S. Guy, M. F. Joubert, J. Alloy. Compd. 323-324 (2001) 731–735. doi:10.1016/S0925-8388(01)01064-7.
- [4] D. B. Gatch, W. M. Dennis, W. M. Yen, Appl. Optics 42 (2003) 615–620. doi:10.1364/AO.42.000615.
- [5] A. F. Borghesani, C. Braggio, G. Carugno, F. Chiossi, A. Di Lieto, M. Guarise, G. Ruoso, M. Tonelli, Appl. Phys. Lett. 107 (2015) 193501. doi:10.1063/1.4935151.
- [6] C. Braggio, C. Carugno, F. Chiossi, A. Di Lieto, M. Guarise, P. Maddaloni, A. Ortolan, G. Ruoso, L. Santamaria, J. Tasseva, M. Tonelli, Sci. Rep-UK 7 (2017) 15168. doi:10.1038/s41598-017-15413-6.
- [7] A. F. Borghesani, C. Braggio, G. Carugno, F. Chiossi, M. Guarise, J. Lumin. 190 (2017) 29–36. doi:10.1016/j.jlumin.2017.05.027.
- [8] F. Chiossi, K. Brylew, A. F. Borghesani, C. Braggio, C. Carugno, W. Drozdowski, M. Guarise, Nucl. Instrum. Meth. A 855 (2017) 13–15. doi:10.1016/j.nima.2017.01.063.
- [9] L. Barcellan, E. Berto, G. Carugno, F. Galeazzi, A. F. Borghesani, Rev. Sci. Instrum. 82 (2011) 095103. doi:10.1063/1.3636078.
- [10] W. Drozdowski, K. Brylew, A. J. Wojtowicz, J. Kisielewski, M. Świrkowicz, T. Łukasiewicz, J. T. de Haas, P. Dorenbos, Opt. Mater. 4 (6) (2014) 1207–1212. doi:10.1364/OME.4.001207.
- [11] M. Malinowski, M. Kaczkan, A. Wnuk, M. Szufliñska, J. Lumin. 106 (2004) 269–279. doi:10.1016/j.jlumin.2003.10.008.
- [12] M. Malinowski, Z. Frukacz, M. Szufliñska, A. Wnuk, M. Kaczan, J. Alloy Compd. 300-301 (2000) 389–394. doi:10.1016/S0925-8388(99)00770-7.
- [13] S. Kück, I. Sokòlska, Chem. Phys. Lett. 325 (2000) 257–263. doi:10.1016/S0009-2614(00)00652-7.
- [14] L. V. Tarelho, I. M. Ranieri, Phys. Rev. B 56 (1997) 14344. doi:10.1103/PhysRevB.56.14344.
- [15] J. P. Hehir, M. O. Henry, J. P. Larkin, G. F. Imbusch, J. Phys. C: Solid State Phys. 7 (1974) 2241. doi:10.1088/0022-3719/7/12/017.
- [16] Y. Fujimoto, T. Yanagida, H. Yagi, T. Yanagidani, V. Chani, Opt. Mater. 36 (2014) 1926–1929. doi:10.1016/j.optmat.2014.06.019.
- [17] M. Sugiyama, T. Yanagida, D. Totsuka, Y. Yokota, S. Kurosawa, Y. Futami, A. Yoshikawa, IEEE T. Nucl. Sci. 59 (2012) 2141–2145. doi:10.1109/TNS.2012.2189130.
- [18] E. Negodine, Inter- and intraconfigurational luminescence of LiYF4:Er3+ under selective VUV excitation, Ph.D. thesis, University of Hamburg (2003).
- [19] M. J. Weber, J. Appl. Phys. 44 (1973) 4058. doi:10.1063/1.1662895.
- [20] E. Osiac, I. Sokòlska, S. Kück, Phys. Rev. B 65 (2002) 235119. doi:10.1103/PhysRevB.65.235119.
- [21] B. M. Walsh, G. W. Grew, N. P. Barnes, J. Phys. Chem. Solids 69 (2006) 1567–1582. doi:10.1016/j.jpcs.2006.01.123.
- [22] B. M. Walsh, G. W. Grew, J. Phys.-Condens. Mat. 17 (2005) 7643–7665. doi:10.1088/0953-8984/17/48/016.
- [23] E. Sarantopoulou, Z. Kollia, A. C. Cefalas, Opt. Commun. 169 (1999) 263–274. doi:10.1016/S0030-4018(99)00356-9.
- [24] J. B. Gruber, M. E. Hills, M. D. Seltzer, S. B. Stevens, C. A. Morrison, G. A. Turner, M. R. Kokta, J. Appl. Phys. 69 (1991) 8183. doi:10.1063/1.347422.
- [25] C. A. Morrison, J. B. Gruber, M. E. Hills, Chem. Phys. 154 (1991) 437–447. doi:10.1016/0301-0104(91)85026-D.
- [26] P. D. Rach, J. J. Peterson, M. D. Potter, W. Park, J. Mater. Res. 16 (2001) 1429–1433. doi:https://doi.org/10.1557/JMR.2001.0199.
- [27] J. Ueda, P. Dorenbos, J. J. Bos, K. Kuroishi, S. Tanabe, J. Mater. Chem. C 3 (2015) 5642–5651. doi:10.1039/c5tc00546a.
- [28] L. Wang, X. Zhang, Z. Hao, Y. Luo, L. Zhang, R. Zhong, J. Zhang, J. Electrochem. Soc 159 (2012) F68–F72. doi:10.1149/2.054204jes.
- [29] W. A. Wall, J. T. Karpick, B. D. Bartolo, J. Phys. C: Solid St. Phys. 4 (1971) 3258–3264. doi:https://doi.org/10.1088/0022-3719/4/18/031.