ALMA Multiple-Transition Observations of High Density Molecular Tracers in Ultraluminous Infrared Galaxies
Abstract
We present the results of our ALMA observations of eleven (ultra)luminous infrared galaxies ((U)LIRGs) at J=4–3 of HCN, HCO+, HNC and J=3–2 of HNC. This is an extension of our previously published HCN and HCO+ J=3–2 observations to multiple rotational J-transitions of multiple molecules, to investigate how molecular emission line flux ratios vary at different J-transitions. We confirm that ULIRGs that contain or may contain luminous obscured AGNs tend to show higher HCN-to-HCO+ flux ratios than starburst galaxies, both at J=4–3 and J=3–2. For selected HCN-flux-enhanced AGN-important ULIRGs, our isotopologue H13CN, H13CO+, and HN13C J=3–2 line observations suggest a higher abundance of HCN than HCO+ and HNC, which is interpreted to be primarily responsible for the elevated HCN flux in AGN-important galaxies. For such sources, the intrinsic HCN-to-HCO+ flux ratios after line opacity correction will be higher than the observed ratios, making the separation between AGNs and starbursts even larger. The signature of the vibrationally excited (v2=1f) HCN J=4–3 emission line is seen in one ULIRG, IRAS 121120305 NE. P Cygni profiles are detected in the HCO+ J=4–3 and J=3–2 lines toward IRAS 152503609, with an estimated molecular outflow rate of 250–750 M⊙ yr-1. The SiO J=6–5 line also exhibits a P Cygni profile in IRAS 121120305 NE, suggesting the presence of shocked outflow activity. Shock tracers are detected in many sources, suggesting ubiquitous shock activity in the nearby ULIRG population.
Subject headings:
galaxies: active — galaxies: nuclei — quasars: general — galaxies: Seyfert — galaxies: starburst — submillimeter: galaxies1. Introduction
Ultraluminous infrared galaxies (ULIRGs) and luminous infrared galaxies (LIRGs) radiate very large infrared luminosity with LIR 1012L⊙ and 1011L⊙, respectively. They are mostly gas-rich galaxy mergers (Sanders & Mirabel, 1996). The large infrared luminosity means that powerful energy sources, either starbursts and/or active galactic nuclei (AGNs), are obscured and/or surrounded by dust. Clarifying how starbursts and AGNs energetically contribute to (U)LIRG’s bolometric luminosities is fundamental to understanding the physical nature of the (U)LIRG population. However, because AGNs are spatially compact compared with starburst activity, the putative AGNs in merging (U)LIRGs can easily be hidden deep inside nuclear gas and dust. It is highly desirable to establish a solid method to disentangle between the two energy sources, based on observations at wavelengths where dust extinction effects are small.
In a starburst, radiative energy is released by a nuclear fusion, while a mass-accreting supermassive black hole (SMBH) is the main energy-generating mechanism in the case of an AGN. The surrounding molecular gas is expected to receive different radiative and/or mechanical effects from the different energy sources, so that chemical and physical conditions can be different. These chemically and physically different molecular gases are expected to show different emission line fluxes among different molecular species. As the effects of dust extinction are usually negligible in the (sub)millimeter wavelength range where rotational J-transition lines of many molecules exist, (sub)millimeter molecular line observations can be used to scrutinize deeply obscured energy sources in the (U)LIRG’s nuclei. To minimize possible ambiguities about the interpretation of molecular emission line flux ratios, using molecules with comparable critical density is recommended, because the differences in their spatial distributions are expected to be much smaller than that among molecules with large differences in their critical densities. A comparison of the flux ratios of HCN, HCO+, and HNC emission lines is a good choice, because (1) they have similar dipole moments ( = 3.0, 3.9, and 3.1 debye for HCN, HCO+, and HNC, respectively); thus, the critical densities of HCN, HCO+, and HNC do not differ a lot at the same J-transitions, (2) these molecular lines probe dense (nH2 104 cm-3) molecular gas, which usually dominates (U)LIRG’s nuclear regions (Gao & Solomon, 2004a, b), and (3) these emission lines are modestly bright, so that their detection is feasible in a large number of (U)LIRGs, including distant ones.
Based on millimeter interferometric observations of the nuclear regions of nearby bright starburst and Seyfert galaxies (= modestly luminous AGNs) before the ALMA era, a trend of higher HCN-to-HCO+ J=1–0 (rotational transition) flux ratios in AGNs than in starbursts was found and argued to be a good AGN indicator (Kohno, 2005; Krips et al., 2008). This method was applied to dusty (U)LIRG nuclei, and it was found that sources with infrared-detectable luminous buried AGN signatures tend to show higher HCN-to-HCO+ J=1–0 flux ratios than those without such signatures (Imanishi et al., 2004, 2006b; Imanishi & Nakanishi, 2006; Imanishi et al., 2007a, 2009; Privon et al., 2015). With the advent of ALMA, similarly enhanced HCN-to-HCO+ flux ratios in sources with infrared-identified AGNs have been confirmed also at higher-J transitions, J=3–2 and J=4–3 (Imanishi & Nakanishi, 2013a, b; Iono et al., 2013; Imanishi & Nakanishi, 2014; Garcia-Burillo et al., 2014; Izumi et al., 2015, 2016; Imanishi et al., 2016a, b, c, 2017, 2018). Although a small fraction of the observed sources display some exceptions and need further detailed investigations (Imanishi & Nakanishi, 2014; Privon et al., 2015), the flux comparison of HCN and HCO+ could potentially be an effective means to detect elusive buried AGNs. Further pursuit of this method is highly desirable.
A few possible origins of the higher HCN-to-HCO+ J-transition line flux ratios in AGNs, compared with starbursts, are proposed. First, an enhanced HCN abundance in an AGN could be a reason for the higher HCN flux (Yamada et al., 2007; Izumi et al., 2016), because increased abundance usually results in increased flux, unless the flux saturates by line opacity effects. In fact, such an HCN abundance enhancement in molecular gas illuminated by a luminous AGN is predicted by some chemical calculations in some parameter ranges (Meijerink & Spaans, 2005; Harada et al., 2010). Second, higher HCN excitation in AGNs could produce higher HCN-to-HCO+ J-transition line flux ratios, even without introducing an HCN abundance enhancement. The critical density of HCN is a factor of 5 higher than that of HCO+ at the same J-transition line under the same line opacity (Meijerink et al., 2007; Greve et al., 2009). Because the radiative energy generation efficiency of a mass-accreting SMBH in an AGN is much higher than that of a nuclear fusion inside stars in a starburst, molecular gas temperature in close vicinity to an AGN can be higher than a starburst, which could result in higher HCN excitation. Consequently, the observed HCN-to-HCO+ flux ratios could be higher in an AGN than in a starburst, particularly at higher-J transition lines. Third, an infrared radiative pumping mechanism (Aalto et al., 1995; Rangwala et al., 2011) could enhance the fluxes of the HCN J-transition lines, as compared with collisional excitation alone. Namely, HCN can be vibrationally excited to the v2=1 level by absorbing infrared 14 m photons; and through the decay back to the vibrational ground level (v=0), HCN J-transition line fluxes at v=0 can be higher. As an AGN can produce a larger amount of mid-infrared 14-m continuum-emitting hot dust than a starburst with the same bolometric luminosity, this infrared radiative pumping mechanism is expected to work more efficiently in an AGN than in a starburst. This could increase HCN flux more in an AGN than in a starburst; however, the infrared radiative pumping mechanism also works for HCO+, by absorbing infrared 12-m photons. For the ULIRG IRAS 205514250, based on the observed infrared spectral energy distribution at 10–20 m, the infrared radiative pumping rates are estimated to be comparable for HCN and HCO+ under the same abundance (Imanishi et al., 2016b). We need further investigation of whether this infrared radiative pumping mechanism strongly increases the observed HCN-to-HCO+ flux ratios in luminous-AGN-containing (U)LIRGs in general.
If the second excitation effects are largely responsible for the higher HCN-to-HCO+ flux ratios in AGNs than in starbursts, the flux ratios can be different at different J-transitions, in such a way that the ratios will decrease with increasing J-transitions in both AGNs and starbursts, but will decrease more drastically in starbursts than in AGNs. Imanishi et al. (2016c) presented the results of HCN-to-HCO+ flux ratios at J=3–2 for a large number of (U)LIRGs. However, the excitation effects can be hardly disentangled from abundance effects, given only one J-transition. Extension to additional J-transition lines is needed. In this paper, we present the results of the HCN-to-HCO+ flux ratios both at J=4–3 and J=3–2, to see how the ratios vary at different J-transitions. HNC J=3–2 and J=4–3 line data were also taken to investigate their fluxes relative to HCN and HCO+, and to constrain the third infrared radiative pumping effects, because the infrared radiative pumping rate for HNC, by absorbing infrared 21.5-m photons, is expected to be much higher than for HCN and HCO+ in (U)LIRGs (Aalto et al., 2007; Imanishi et al., 2016b). Interesting features of detected molecular lines will also be discussed. Throughout this paper, we adopt H0 71 km s-1 Mpc-1, = 0.27, and = 0.73, to be consistent with our previous studies on related scientific topics. We use molecular parameters derived from the Cologne Database of Molecular Spectroscopy (CDMS) (Mller et al., 2005) via Splatalogue (http://www.splatalogue.net). HCN, HCO+, and HNC represent H12C14N, H12C16O+, and H14N12C, respectively. When we say “molecular line flux ratio”, we are referring to the “rotational J-transition line flux ratio at v = 0”, unless otherwise stated.
2. Targets
We observed eleven (U)LIRGs for which HCN J=3–2 and HCO+ J=3–2 data had been taken with ALMA (Imanishi et al., 2016c). Their basic information is summarized in Table 1, and detailed observational properties are described by Imanishi et al. (2016c). All galaxies are categorized as ULIRGs (LIR 1012L⊙), except NGC 1614 (LIR 5 1011L⊙; Table 1), which is classified as a LIRG (Sanders & Mirabel, 1996). In brief, these galaxies have various types of infrared-diagnosed primary energy sources, from starburst-dominated to AGN-dominated (Imanishi et al., 2016c), based on the strengths of polycyclic aromatic hydrocarbon (PAH) emission and dust absorption features in infrared spectra (Imanishi et al., 2007b; Veilleux et al., 2009; Imanishi et al., 2010; Nardini et al., 2010). The LIRG NGC 1614 is classified as starburst-dominated. All ULIRGs, except IRAS 121120305, IRAS 224911808, IRAS 135090442, and IRAS 204141651, show infrared-detectable luminous AGN signatures (Imanishi et al., 2016c). We aim to investigate the variation of molecular line flux ratios as a function of infrared-estimated primary energy sources at J=3–2 and J=4–3, and to obtain information on how the molecular line flux ratios differ at different J-transitions due to excitation effects.
3. Observations and Data Analysis
Our observations of eleven (U)LIRGs in the HCN, HCO+, and HNC J=4–3 lines in band 7 (275–373 GHz) and HNC J=3–2 line in band 6 (211–275 GHz) were conducted within our ALMA Cycle 2 program 2013.1.00032.S (PI = M. Imanishi) and Cycle 3 program 2015.1.00027.S (PI = M. Imanishi). Table 2 summarizes our observation details. The widest 1.875-GHz width mode was adopted. In our approved ALMA proposals, we requested to take HCN J=4–3, HCO+ J=4–3, HNC J=4–3, and HNC J=3–2 line data for all galaxies in Table 1. However, some targeted line data are not available for a fraction of (U)LIRGs due to the scheduling constraints of ALMA observations.
In band 7, HCN J=4–3 (rest-frame frequency = 354.505 GHz) and HCO+ J=4–3 ( = 356.734 GHz) lines were simultaneously covered, as well as the vibrationally excited HCN v2=1, l=1f (hereafter v2=1f) J=4–3 line ( = 356.256 GHz). HCN J=4–3 and HCO+ J=4–3 lines were covered in USB or LSB of ALMA, depending on Earth’s atmospheric transmission at the redshifted frequencies of targeted lines. When they were observed in USB, the CS J=7–6 ( = 342.883 GHz) line was included in LSB.
To obtain HNC J=4–3 ( = 362.630 GHz) line data in band 7, we needed independent observations. The vibrationally excited HNC v2=1f J=4–3 ( = 365.147 GHz) line data were taken simultaneously. In band 6, data of the HNC J=3–2 ( = 271.981 GHz) line, together with the vibrationally excited HNC v2=1f J=3–2 ( = 273.870 GHz) line, were obtained.
In addition to these lines, the isotopologue H13CN J=3–2 ( = 259.012 GHz), H13CO+ J=3–2 ( = 260.255 GHz), and HN13C J=3–2 ( = 261.263 GHz) line data were taken independently for three ULIRGs, which show HCN flux excesses and modestly bright molecular emission lines (i.e., IRAS 085723915, IRAS 121120305, and IRAS 224911808) in our ALMA Cycle 4 program 2016.1.00051.S (PI = M. Imanishi). The details of these isotopologue observations are tabulated also in Table 2. The primary aim was to estimate possible flux attenuation by line opacity (not dust extinction) for HCN, HCO+, and HNC, based on a comparison of HCN-to-H13CN, HCO+-to-H13CO+, and HNC-to-HN13C flux ratios at J=3–2 (Jimenez-Donaire et al., 2017; Imanishi et al., 2017), to test the high HCN abundance scenario in HCN-flux-enhanced AGN-containing ULIRGs, and to obtain the intrinsic flux ratios among HCN, HCO+, and HNC in this small sample. The H13CN J=3–2 line was included in our HNC J=3–2 observations in Cycles 2 and 3. However, for the three ULIRGs, the integration time in Cycle 2 was much shorter than the new isotopologue observations in Cycle 4. We will use H13CN J=3–2 line data taken in Cycle 4 for these three ULIRGs.
We used CASA (https://casa.nrao.edu) for our data reduction, starting from calibrated data provided by ALMA. All data delivered to us passed the quality check by ALMA, except for the HNC J=4–3 data of IRAS 152503609, for which the achieved rms noise level was about twice as large as that requested in our proposal. However, the detected HNC J=4–3 emission line in IRAS 152503609 was brighter than our original conservative estimate; thus, we decided to include the data for our scientific discussion. We first checked the visibility plots and chose channels free from strong emission lines to extract continuum information. After subtracting the continuum emission component using the CASA task “uvcontsub”, we applied the “clean” procedure to create continuum-subtracted molecular line data. We employed 40-channel spectral binning, or 20-channel binning if data were acquired and delivered with 2-channel binning (Spec Avg. = 2 in the ALMA Observing Tool). The final velocity resolutions were 20 km s-1. Band 7 spectra of a few sources were very spiky and did not have sufficient signal-to-noise ratios; in this case, we applied additional two spectral element binning to make molecular emission lines and continuum profiles smoother. The employed pixel scale for the “clean” procedure ranged from 003 pixel-1 to 01 pixel-1, depending on the actually achieved synthesized beam sizes. We set the pixel scale smaller than one-third of the beam sizes. The “clean” procedure was also applied to the continuum data, with the 003–01 pixel-1 scale.
As the nuclear AGN-affected dense molecular gas of ULIRGs is usually concentrated to kpc or sub kpc, a 1 arcsec angular resolution (1.8 kpc at 0.1) was desired to investigate the physical properties, with minimum contamination from spatially extended molecular gas predominantly affected by starburst activity. At the same time, to recover the entire nuclear molecular gas emission with the spatial extent of a maximum of a few kpc, we avoided lengthy baseline array configurations. In band 6, the requested array configurations resided between C34–2 (061 angular resolution [AR] and 78 maximum recoverable scale [MRS]) and C34–7 (AR 018 and MRS 40) in Cycle 2, between C36–2 (AR 08 and MRS 110) and C36–5 (AR 02 and MRS 34) in Cycle 3, and between C40–2 (AR 10 and MRS 96) and C40–6 (AR 015 and MRS 13) in Cycle 4. In band 7, the requested array configurations were between C34–2 (AR 059 and MRS 76) and C34–7 (AR 012 and MRS 26) in Cycle 2, and between C36–1 (AR 10 and MRS 73) and C36–4 (AR 02 and MRS 28) in Cycle 3. The maximum recoverable scale was smaller with the higher angular resolution configuration. HCN, HCO+, and HNC emission lines at J=3–2 and J=4–3 data were taken in Cycles 2 and 3. As such, we should be able to recover the total molecular emission within a spatial scale of a few arcsec. For NGC 1614, molecular emission is spatially more extended than other ULIRGs (Imanishi & Nakanishi, 2013a). ALMA band 6 observation of NGC 1614 was conducted in Cycle 2; thus, emission with a spatial extent of 4” was recovered. According to the ALMA Cycles 2 and 3 Proposer’s Guides, the absolute flux calibration uncertainty of bands 6 and 7 data is expected to be 10%. The position reference frames were FK5 for objects observed in ALMA Cycle 2 and ICRS for those observed in ALMA Cycles 3 and 4.
4. Results
Figure 1 presents newly obtained continuum emission images of IRAS 121120305, NGC 1614, and IRAS 135090442, all of which show some morphological structures, in addition to nuclear compact emission. The continuum emission of the remaining ULIRGs is dominated by a single nuclear compact source, as seen in the continuum images at different frequencies (Imanishi et al., 2016c), and is also shown in the Appendix (Figure 29). The continuum emission properties of all sources are summarized in Table 3. Except for NGC 1614, the estimated continuum flux levels in band 6 taken during HNC J=3–2 observations (32b) (Table 3) agree within 20% with those taken during HCN J=3–2 and HCO+ J=3–2 observations (32a) (Imanishi et al., 2016c). The small difference in the flux can be explained by the slight frequency difference and maximum 10% absolute calibration uncertainty in individual ALMA observations. For NGC 1614, the continuum flux difference is larger than other ULIRGs, because it shows spatially extended structures and the continuum flux measurements were made at slightly different positions. For IRAS 085723915, IRAS 121120305, and IRAS 224911808, the continuum flux levels in band 6 taken during the isotopologue H13CN, H13CO+, and HN13C J=3–2 observations (iso32) were systematically smaller than the other band 6 data (Table 3). This can be explained by the lower frequency (=longer wavelength) of the former data, because dust thermal radiation is usually dominant in this frequency range at 250 GHz. Continuum flux measurements in band 7 were also consistent within 20 between data taken during HCN J=4–3 and HCO+ J=4–3 observations (43a) and HNC J=4–3 observations (43b), except IRAS 152503609, which shows 30% discrepancy. For the IRAS 152503609 data taken with HCN J=4–3 and HCO+ J=4–3, LSB data as a whole were flagged by the pipeline due to poor Earth atmospheric transmission, which may cause some systematic differences.
Figures 2–12 show newly acquired ALMA spectra, within the beam size, at the continuum emission peak positions of individual galaxy nuclei. For IRAS 121120305, molecular emission line signatures were present for both the north-eastern (NE) and south-western (SW) nuclei, whose spectra are shown separately in Figure 4. The expected observed frequencies of J=3–2 of “HNC, H13CN, H13CO+, HN13C, HNC v2=1f” and J=4–3 of “HCN, HCO+, HNC, HCN v2=1f, HNC v2=1f” as well as other bright CS J=5–4 ( = 244.936 GHz), CS J=7–6 ( = 342.883 GHz), SiO J=6–5 ( = 260.518 GHz), HC3N J=27–26 ( = 245.606 GHz), and HC3N J=30–29 ( = 272.885 GHz) lines are indicated with downward arrows. Other serendipitously detected emission lines are also tentatively identified.
In the continuum images of IRAS 135090442 in Figure 1, a bright source was detected at 1′′ east and 8–9′′ north of the IRAS 135090442 nucleus. We denote this north-eastern source to as IRAS 135090442 NE. It was detected in the continuum emission map at 235 GHz with a flux of 1.9 mJy (Imanishi et al., 2016c). The continuum fluxes at 310 GHz in band 7 (3.6–4.1 mJy; Table 3) are a factor of 2 higher than those at 235 GHz in band 6 (1.9–2.1 mJy; Table 3 and Imanishi et al. (2016c)), which suggests that emission in this frequency range comes from dust thermal radiation, rather than synchrotron or thermal free-free radiation. No clear emission lines were detected in the ALMA spectra of IRAS 135090442 NE (see Figure 11 and Imanishi et al. (2016c)). At 5′′ from IRAS 135090442 NE in the north-east direction, a galaxy (SDSS J135331.89042816.4; z=0.186) was detected in the optical range (0.3–1.0 m) with the Sloan Digital Sky Survey (SDSS DR7) (Schneider et al., 2010), as well as in the near-infrared (1.0–2.4 m) with the UKIRT Infrared Deep Sky Survey (UKIDSS) (Lawrence et al., 2007). However, we regard that this SDSS optical and UKIDSS near-infrared source is not directly related to IRAS 135090442 NE, because there is a 5′′ positional offset, while the peak positions of the SDSS optical, UKIDSS near-infrared, and ALMA (sub)millimeter data agree well for ULIRG IRAS 135090442 itself. Thus, IRAS 135090442 NE is a (sub)millimeter bright, but optically and near-infrared faint object. No source is catalogued at the position of IRAS 135090442 NE in the Faint Images of the Radio Sky at Twenty-cm (FIRST) Survey data at radio 1.4 GHz (21 cm) (White et al., 1997). This kind of spectral energy distribution is often seen in distant dusty (U)LIRGs at z 1 (Tamura et al., 2014). Thus, IRAS 135090442 NE could be a distant (U)LIRG.
In Figure 13, we display integrated intensity (moment 0) maps of the detected HNC J=3–2, HCN J=4–3, HCO+ J=4–3, and HNC J=4–3 emission lines for the observed ULIRGs, by summing spectral elements with significant detection. For the HNC J=3–2 and HCO+ J=4–3 lines of IRAS 121120305, the moment 0 maps at NE and SW nuclei are shown separately, because spectral elements used for the creation of the moment 0 maps differ slightly between NE and SW nuclei, due to a velocity shift. HCN J=4–3 and HNC J=4–3 emission lines are not clearly detected in the SW nucleus. The HNC J=3–2 emission line of NGC 1614 shows spatially extended morphology and its moment 0 map, together with spectra at individual positions, are shown in Figure 14 separately. Tables 4, 5, 6, and 7 summarize the properties of moment 0 maps of HNC J=3–2, HCN J=4–3, HCO+ J=4–3, and HNC J=4–3, respectively.
The integrated intensity (moment 0) maps of the isotopologue H13CN J=3–2, H13CO+ J=3–2, and HN13C J=3–2 emission lines based on Cycle 4 data for IRAS 085723915, IRAS 121120305 NE, and IRAS 224911808 are shown in Figure 15. Their properties are summarized in Table 8. No clear isotopologue emission line was detected at IRAS 121120305 SW.
To estimate the intrinsic continuum emission sizes, after deconvolution, of the (U)LIRG’s nuclei, we use the CASA task “imfit”. With the exception of NGC 1614, for which the signatures of spatially extended structures are evident in Figure 1 and the task “imfit” indeed provides intrinsic sizes substantially larger than the beam sizes, the continuum emission of the remaining ULIRGs is dominated by nuclear compact components. Table 9 lists the deconvolved continuum emission sizes in apparent scale in (mas) and physical scale in (pc). Here, we note that the deconvolved sizes are in practice dependent on the achieved synthesized beam sizes, because it is usually difficult to constrain sizes much smaller than the beam sizes. Thus, the synthesized beam size information is shown in Table 9 for reference. In the case of spatially unresolved continuum emission, more stringent constraints are placed based on data with smaller synthesized beam sizes. From Table 9, we can see that the intrinsic continuum emission sizes of ULIRGs in band 7 (850 m) and band 6 (1.2 mm) are constrained to 500 pc, except IRAS 135090442, supporting the previous suggestion based on high spatial-resolution mid-infrared 10 m imaging observations (Soifer et al., 2000) that the luminosities of nearby ULIRGs are generally dominated by compact nuclear energy sources with 500 pc.
For IRAS 135090442, the sizes of the continuum-emitting regions at 850 m in band 7 and 1.2 mm in band 6 are estimated to be 1 kpc. Although the synthesized beam sizes for the observations of this ULIRG are not very small, smaller apparent scales for the continuum emission are derived with comparable beam sizes for other ULIRGs (e.g., IRAS 152503609 and PKS 134512). The continuum emission of IRAS 135090442 is estimated to be spatially more extended than the majority of other ULIRGs. IRAS 135090442 does not exhibit obvious buried AGN signatures in the infrared (Imanishi et al., 2007b, 2010; Nardini et al., 2010). IRAS 121120305 and IRAS 224911808 similarly show starburst-like spectra without any discernible AGN signature in the infrared, and yet show signatures of vibrationally excited HCN v2=1f emission lines at J=3–2, most likely originating in the infrared radiative pumping by absorbing infrared photons coming from AGN-heated hot dust emission (Imanishi et al., 2016c). IRAS 204141651 also has a similar starburst-dominated infrared spectral shape and shows some possible signature of the HCN v2=1f J=3–2 emission line, although the detection significance is 3 (Imanishi et al., 2016c). IRAS 135090442 does not display even the signature of the HCN v2=1f emission line at J=3–2 (Imanishi et al., 2016c). No putative AGN in IRAS 135090442 is discernible, and this ULIRG may be dominated by 1 kpc-scale starburst activity.
Table 10 summarizes the estimated intrinsic sizes of molecular emission lines, after deconvolution, using the CASA task “imfit” in the integrated intensity (moment 0) maps. Except NGC 1614, the molecular emission sizes whenever constrained are smaller than the synthesized beam sizes (Tables 4, 5, 6, 7). To estimate the line fluxes, we fitted Gaussian curves to the continuum-subtracted spectra, within the beam size, at the individual nuclear positions. Gaussian fitting results for HNC J=3–2 in band 6 for NGC 1614 and ULIRGs are shown in Figures 14 and 16, respectively. Those for HCN J=4–3, HCO+ J=4–3, and HNC J=4–3 emission lines in band 7 are displayed in Figure 17. In Figure 18, Gaussian fits to the isotopologue H13CN J=3–2, H13CO+ J=3–2, and HN13C J=3–2 emission lines taken in Cycle 4 are shown. The following emission lines are clearly double-peaked: HNC J=3–2 of IRAS 121271412; HCN J=4–3, HCO+ J=4–3, and H13CN J=3–2 of IRAS 121120305 NE; HCN J=4–3 and HCO+ J=4–3 of IRAS 152503609; and HCN J=4–3, HCO+ J=4–3, and HNC J=4–3 of IRAS 204141651. We employ two Gaussians to fit these double-peaked emission lines. The Gaussian fit fluxes of HNC J=3–2, HCN J=4–3, HCO+ J=4–3, HNC J=4–3, and isotopologue emission lines are summarized also in Tables 4, 5, 6, 7, and 8, respectively. Except NGC 1614, thanks to the spatially compact molecular emission, the Gaussian fits of the detected molecular emission lines in the spectra within the beam sizes should recover the bulk of the fluxes. These flux estimates will be used for our quantitative discussion of the molecular line flux ratios, except NGC 1614, for which we will use Gaussian fit fluxes in the spatially integrated spectra.
In addition to the targeted main emission lines, signatures of other molecular emission lines are discernible in some objects. By using the Splatalogue database (http://www.splatalogue.net), we attempted to identify these faint molecular emission lines; however, this process is complicated by the presence of multiple candidates. Our tentative identifications of these lines, their integrated intensity (moment 0) maps, Gaussian fits in the spectra within the beam sizes, and emission line properties are summarized in the Appendix (Figures 30 and 31, and Table 16).
For IRAS 085723915, IRAS 121120305, and IRAS 224911808, H13CN J=3–2 lines were included in our ALMA Cycle 2 data, in addition to the Cycle 4 deeper data. For IRAS 085723915, the flux upper limit in Cycle 2 data (Table 16) is higher than the detected flux in deep Cycle 4 data (Table 8). For IRAS 121120305 NE and IRAS 224911808, the H13CN J=3–2 fluxes based on Gaussian fits are consistent between Cycle 2 and 4 data (Tables 8 and 16), if we allow 10% uncertainty in the absolute flux calibration in individual ALMA observations. For these sources, we adopt deeper Cycle 4 data, because (1) the detection significance is higher, and (2) not only H13CN J=3–2 but also H13CO J=3–2 and HN13C J=3–2 data were taken simultaneously with the same synthesized beam pattern, allowing a reliable comparison of the flux attenuation by line opacity among HCN, HCO+, and HNC, based on the HCN-to-H13CN, HCO+-to-H13CO+, and HNC-to-HN13C flux ratios at J=3–2 (Jimenez-Donaire et al., 2017; Imanishi et al., 2017). For other galaxies, H13CN J=3–2 emission line fluxes or upper limits obtained from shallow Cycle 2 or 3 data will be used for discussion.
Table 11 tabulates the ratios of J=4–3 to J=3–2 flux in (Jy km s-1) for HCN, HCO+, and HNC. The ratios of HCN-to-HCO+ and HCN-to-HNC flux in (Jy km s-1) at J=4–3 and J=3–2 are summarized in Table 12.
In the spectrum of IRAS 121120305 NE in Figure 4c, we recognize an emission tail at the lower frequency side of the bright HCO+ J=4–3 emission line. A similar profile was seen for the HCO+ J=3–2 emission line in IRAS 121120305 NE (Imanishi et al., 2016c), as well as in other (U)LIRGs (Aalto et al., 2015a, b; Imanishi et al., 2016c). This is usually attributed to the contribution from the vibrationally excited (v2=1f) HCN J=4–3 or J=3–2 emission line (Aalto et al., 2015a, b; Imanishi et al., 2016c). We make an integrated intensity (moment 0) map, by integrating the continuum-subtracted emission within the frequency range expected for the HCN v2=1f J=4–3 emission line (331.5–332.2 GHz; shown as a horizontal solid straight line in Figure 4c), which is displayed in Figure 19. The HCN v2=1f J=4–3 emission line may be detected at 3 level (Table 16 in Appendix) at the continuum peak position of IRAS 121120305 NE.
IRAS 152503609 also displays signatures of the vibrationally excited HNC v2=1f J=4–3 emission line in Figure 8d. Its integrated intensity (moment 0) map is shown in Figure 19, and emission properties are summarized in Table 16 in the Appendix. We obtain 5 detection, assuming that the excess emission tail at the expected observed frequency of HNC v2=1f J=4–3 as originating in this line. Some signatures of the HNC v2=1f J=4–3 emission line may be seen in Superantennae (Figure 3e) and IRAS 121120305 NE (Figure 4e); however, their flux estimates are difficult, due to contamination by the nearby strong emission line identified as CH3OH 16(2,14)–16(1,16) ( = 364.859 GHz).
During the observations of HNC J=3–2, the vibrationally excited (v2=1f) HNC J=3–2 line was also covered. However, the signatures of the HNC v2=1f J=3–2 emission are not clear in any of the spectra in Figures 2–12. We created integrated intensity (moment 0) maps of the HNC v2=1f J=3–2 emission line, by summing several spectral elements around its expected frequency, depending on the actual signal profile. However, detection was 3 for all sources, and the HNC v2=1f J=3–2 emission line with 0.3 (Jy beam-1 km s-1) was not observed in any source.
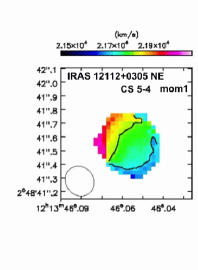
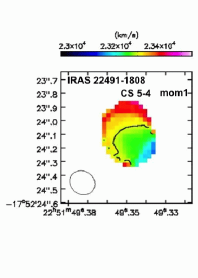
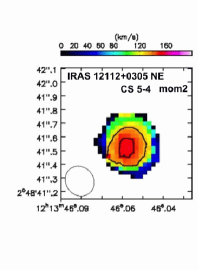
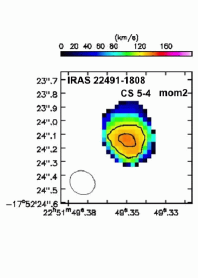
Figures 20 and 21 display intensity-weighted mean velocity (moment 1) and intensity-weighted velocity dispersion (moment 2) maps of the strongly detected (10) HNC J=3–2, HCN J=4–3, HCO+ J=4–3, and HNC J=4–3 emission lines in selected galaxies. In addition to these targeted lines, the moment 1 and 2 maps of the serendipitously detected bright CS J=5–4 emission lines in our deep Cycle 4 data of IRAS 121120305 NE and IRAS 224911808 are shown in the Appendix (Figures 32 and 33).
5. Discussion
5.1. P Cygni Profiles and Molecular Outflow
5.1.1 IRAS 152503609
IRAS 152503609 shows a broad negative absorption feature at the 0.4–0.5 GHz higher frequency (= blueshifted) side of the HCO+ J=4–3 emission line in Figure 8c. A similar broad negative absorption feature was detected at the higher frequency (blueshifted) side of the HCO+ J=3–2 emission line (Imanishi et al., 2016c). These absorption profiles are naturally interpreted as outflowing material, in which blueshifted gas in front of the nucleus absorbs the background nuclear continuum emission. Figure 22 presents detailed line profiles of HCN, HCO+, and HNC at J=4–3 and J=3–2, relative to the systemic velocity. HCO+ displays a clear broad blueshifted absorption feature at J=4–3 and J=3–2, whereas HCN and HNC do not. By summing negative signals at the absorption features at 400 215 (km s-1) for HCO+ J=4–3 and 850 188 (km s-1) for HCO+ J=3–2 in Figure 22, we obtain 0.49 (Jy beam-1 km s-1) (5.4) and 0.47 (Jy beam-1 km s-1) (4.9) in the integrated intensity (moment 0) maps for HCO+ J=4–3 and J=3–2, respectively. In the nearby well-studied ULIRG, Arp 220 (z=0.018), stronger blueshifted absorption profiles were observed for HCO+ than HCN at J=4–3 and J=3–2 (Sakamoto et al., 2009; Scoville et al., 2015; Martin et al., 2016) in a similar way to IRAS 152503609. HCO+ may be more abundant than HCN and HNC in the outflowing gas in these ULIRGs.
In Figure 22, emission sub-peaks appear at 400–500 km s-1 on the redshifted (lower frequency) side of HCN J=4–3, HCO+ J=4–3, HCN J=3–2, and HCO+ J=3–2 emission lines. We interpret that these sub-peaks originate in emission from redshifted outflow components, as opposed to other weaker emission lines, because both the blueshifted absorption (for HCO+ J=4–3 and J=3–2) and redshifted emission lines show peaks at 400–500 km s-1, relative to the systemic velocity of IRAS 152503609 (Figure 22). The sub-peak emission, relative to the main emission component, is stronger for HCO+ than HCN. This is naturally reproduced by outflowing material if HCO+ is more abundant than HCN there.
The vibrationally excited HCN v2=1f J=4–3 and J=3–2 emission lines are located at the 400 km s-1 redshifted (lower frequency) side of HCO+ J=4–3 and J=3–2 emission lines, respectively (Sakamoto et al., 2010; Imanishi & Nakanishi, 2013b; Aalto et al., 2015b; Martin et al., 2016; Imanishi et al., 2016b, 2017). However, we regard that the sub-peaks for HCO+ are unlikely to come solely from these HCN v2=1f emission lines for the following two reasons. First, the sub-peaks are detected also at the 400–500 km s-1 redshifted side of HCN J=4–3 and J=3–2 emission lines, which cannot be explained by the HCN v2=1f emission lines. Second, for the sub-peaks of HCO+ J=4–3 and J=3–2 emission lines, the observed peak frequencies are 337.55 GHz and 253.15 GHz (Imanishi et al., 2016c), respectively, which correspond to rest-frequencies with 356.18 GHz and 267.12 GHz at the molecular-line-derived redshift of z=0.0552. The vibrationally excited HCN v2=1f emission lines at J=4–3 ( = 356.26 GHz) and J=3–2 ( = 267.20 GHz) are 0.08 GHz shifted to the higher frequency side of the sub-peaks of HCO+ J=4–3 and HCO+ J=3–2. In another ULIRG IRAS 205514250 at z=0.0430, for which we argued the detection of HCN v2=1f J=4–3 and J=3–2 emission lines, their redshifted frequencies agree (within 0.08 GHz) with the frequencies of the observed sub-peak emission for HCO+ J=4–3 and J=3–2 (Imanishi & Nakanishi, 2013b; Imanishi et al., 2016c, 2017).
The rest frequencies for the individual emission sub-peaks for HCN J=4–3, HCO+ J=4–3, HCN J=3–2, and HCO+ J=3–2 are 354.02 GHz, 356.18 GHz, 265.49 GHz, and 267.12 GHz, respectively. Based on the Splatalogue database (http://www.splatalogue.net), SO2 emission lines are present at close to the frequencies of individual sub-peaks, SO2 47(5,43)–48(2,46) ( = 354.08 GHz), SO2 15(7,9)–16(6,10) ( = 356.04 GHz), SO2 34(4,30)–34(3,31) ( = 265.48 GHz), and SO2 63(6,58)–62(7,55) ( = 267.19 GHz). However, the SO2 frequency is offset, relative to the sub-peak, to the higher frequency side in some cases and lower frequency side in others, making it difficult to interpret that all four sub-peaks originate solely from SO2 emission.
Summarizing, the broad negative absorption at the 400–500 km s-1 blueshifted side and sub-peak emission at the 400–500 km s-1 redshifted side of HCO+ emission lines at J=4–3 and J=3–2 can naturally be explained by HCO+ outflow. Narrow absorption features at the redshifted side of HCO+ J=4–3 and J=3–2 lines, at the velocity of 250–300 km s-1, were also observed (Figure 22 and Imanishi et al. (2016c)). As the signals at the center of these absorption features are negative, these features cannot be explained solely by self-absorption inside redshifted outflowing gas; absorption of background continuum emission by foreground gas is required. A similar narrow absorption feature was detected at the velocity of 250 km s-1 in the OH line data at far-infrared 65–119 m and was interpreted as inflow origin (Veilleux et al., 2013; Gonzalez-Alfonso et al., 2017). Thus, we regard that the redshifted narrow absorption features of HCO+ J=4–3 and HCO+ J=3–2 are due to inflowing gas.
Regarding the blueshifted broad absorption, adopting the continuum flux levels of 16.9 (mJy beam-1) (Table 3) and 11 (mJ beam-1) (Imanishi et al., 2016c), the above estimated integrated intensities of 0.49 (Jy beam-1 km s-1) (5.4) and 0.47 (Jy beam-1 km s-1) (4.9) (paragraph 1 of this subsection) provide the absorption equivalent widths to be 2.9 106 (cm s-1) and 4.3 106 (cm s-1) for HCO+ J=4–3 and HCO+ J=3–2, respectively. We then convert these absorption equivalent widths (EW) to the column density, using the formula
| (1) |
(Rybicki & Lightman, 1979; Gonzalez-Alfonso et al., 2014), where EW is in units of (cm s-1), is wavelength in (cm), Aul is the Einstein A coefficient for spontaneous emission from the upper (u) level to the lower (l) level in units of (s-1), gu and gl are the statistical weights at the upper and lower levels, respectively, and N is the column density in the lower energy level in units of (cm-2). The statistical weight of level J is 2J+1. Aul values for HCO+ J=4–3 and J=3–2 are 35.7 10-4 (s-1) and 14.5 10-4 (s-1), respectively, based on data from the Cologne Database of Molecular Spectroscopy (CDMS) (Mller et al., 2005) via Splatalogue (http://www.splatalogue.net). From these values, the column density of HCO+ at J=3 and J=2 in the blueshifted outflowing molecular gas is 2.7 1013 (cm-2) and 3.8 1013 (cm-2), respectively. Thus, the HCO+ column density in the blueshifted outflowing gas in front of the nuclear continuum-emitting energy source is at least 6 1013 (cm-2), because HCO+ should be populated at other J-levels than J=3 and J=2. Adopting the HCO+-to-H2 abundance ratio of 10-8 (Greve et al., 2009), the molecular H2 column density of the blueshifted outflowing gas in IRAS 152503609 is estimated to be NH2 6 1021 (cm-2). In this equation, we do not take into account the emission within the absorbing gas. The actual NH2 values must be even higher, because (1) emission by the approaching gas itself fills in the absorption features and (2) the population in levels other than J=3 and J=2 is ignored.
We next derive the molecular outflow rate (Ṁoutf) from the redshifted emission sub-peak, based on the assumption that the sub-peak originates from redshifted outflowing gas. This is because blueshifted absorption features can be diluted by emission within the same blueshifted outflowing molecular gas and thus the molecular outflow rate can be underestimated. The integrated intensity of the redshifted emission sub-peaks of HCO+ J=4–3 and HCO+ J=3–2 are 2.0 (Jy beam-1 km s-1) (10.8) and 0.77 (Jy beam-1 km s-1) (9.1), respectively. Assuming that the blueshifted outflow gas has the same amount of emission, we obtain HCO+ J=4–3 and HCO+ J=3–2 emission line luminosities in outflowing gas to be 5.6 107 (K km s-1 pc2) and 3.9 107 (K km s-1 pc2), respectively, based on equation (3) of Solomon & Vanden Bout (2005). Assuming that the HCO+ J=4–3 and HCO+ J=3–2 emission lines are thermalized 111 If these emission lines are sub-thermally excited, the derived J=1–0 luminosity will increase and the estimated molecular mass will be even higher. and optically thick, and that the relationship between dense molecular mass and HCO+ J=1–0 luminosity is the same as that between dense molecular mass and HCN J=1–0 luminosity, Mdense = 10 HCN J=1–0 luminosity [M⊙ (K km s-1 pc2)-1] (Gao & Solomon, 2004a) 222 The relation between dense molecular mass and HCO+ J=1–0 luminosity has not been established in galaxies. As HCN J=1–0 and HCO+ J=1–0 luminosities are usually comparable within a factor of a few in the majority of galaxies (Kohno, 2005; Krips et al., 2008; Imanishi et al., 2007a, 2009), we make this assumption., the outflowing dense molecular mass would be Moutf 5.6 108 M⊙ and 3.9 108 M⊙ from HCO+ J=4–3 and HCO+ J=3–2 data, respectively. Both Moutf values agree within 30%. We adopt the value from HCO+ J=3–2 data to be conservative.
From Figure 22b, the outflow velocity of V = 500 km s-1 is adopted for IRAS 152503609. In Figure 23, the peak position of the blueshifted HCO+ J=3–2 absorption and redshifted HCO+ J=3–2 emission is displaced with 014 or 160 pc in projected distance. Adopting the outflowing gas size of R 80 pc from the nucleus and the relation of Ṁoutf = 3 Moutf V/R (Maiolino et al., 2012; Cicone et al., 2014), we obtain a molecular outflow rate with Ṁoutf 750 (M⊙ yr-1). If we adopt the formula of Ṁoutf = Moutf V/R (Gonzalez-Alfonso et al., 2017; Veilleux et al., 2017), the outflow rate is a factor of 3 lower (i.e., 250 M⊙ yr-1.) Adopting the 50% AGN contribution to the infrared luminosity of IRAS 152503609 (Nardini et al., 2008, 2009, 2010), the AGN luminosity is LAGN 1.9 1045 erg s-1. The estimated molecular outflow rate in IRAS 152503609 follows the relation between the AGN luminosity and molecular outflow rate established in other AGN-containing ULIRGs (Cicone et al., 2014). The molecular outflow kinetic power is Poutf 0.5 Ṁoutf V2 2.0–5.9 1043 (erg s-1) or 1–3% of the AGN luminosity. The molecular outflow momentum rate is Ṗoutf Ṁoutf V 0.8–2.4 1031 (kg m s-2). This is 12–37 LAGN/c, and supports the energy conserving outflow scenario rather than the acceleration by radiation pressure (Cicone et al., 2014). Overall, the outflow properties of IRAS 152503609 are similar to those in other molecular-outflow-detected AGN-containing-ULIRGs (Cicone et al., 2014; Imanishi et al., 2017).
5.1.2 IRAS 121120305 NE
Broad negative absorption features also appear at the higher frequency (blueshifted) side of the SiO J=6–5 emission line in the spectrum of IRAS 121120305 NE in Figure 4g. Tunnard et al. (2015) observed the same line in the well-studied ULIRG, Arp 220 (z=0.018) and detected the P Cygni profile at the blueshifted side of the SiO J=6–5 line; this was ascribed to SiO outflow. Figure 24 plots the line profiles with respect to the systemic velocity at z=0.0730 (Vsys = 21900 km s-1) for the SiO J=6–5 line. A textbook-type P Cygni profile, with redshifted emission and blueshifted absorption features, is seen. Figure 24 also shows a negative narrow absorption feature on the redshifted (lower frequency) side of the SiO J=6–5 emission line as well, which may be due to (1) inflowing gas traced by the SiO J=6–5 line and/or (2) the P Cygni profile of the H13CO+ J=3–2 emission line. However, given that the detection significance of this narrow absorption feature in an integrated intensity map that we created was 3, we do not discuss this feature further.
The integrated intensity at the blueshifted SiO J=6–5 absorption features at 190 10 (km s-1) in Figure 24 provides a negative signal of 0.11 (Jy beam-1 km s-1) (4.6). Its absolute value is smaller than the integrated intensity of the redshifted emission part of SiO J=6–5 at 14 195 (km s-1) with 0.18 (Jy beam-1 km s-1) (7.3), again suggesting that the blueshifted SiO J=6–5 absorption feature is filled in by emission within the absorbing gas. Adopting the continuum flux level of 4.6 (mJy beam-1) at the frequency of SiO J=6–5 (Table 3), we obtain an equivalent width of the blueshifted SiO J=6–5 absorption feature of 2.4 106 (cm s-1). Based on equation (1) and the Einstein coefficient of Aul = 9.1 10-4 for SiO J=6–5 (http://www.splatalogue.net), we obtain SiO column density at J=5 in the blueshifted outflowing gas in front of the continuum-emitting energy source of N(SiO J=5) = 3.6 1013 cm-2. SiO is well known to be a good tracer of shocked gas (Martin-Pintado et al., 1992). The SiO-to-H2 abundance ratio in shocked gas is estimated to be 10-10–10-9 (Garcia-Burillo et al., 2001; Usero et al., 2006; Garcia-Burillo et al., 2010). Adopting the highest value of 10-9, we obtain the conservative molecular H2 column density in the outflow to be NH2 3.6 1022 (cm-2). This is again a lower limit, because (1) the absorption feature in the blueshifted outflowing gas can be diluted by the emission from the same gas and (2) the SiO-to-H2 abundance ratio can be lower than the adopted conservative value of 10-9. For IRAS 121120305 NE, we did not estimate the molecular outflow rate, outflow kinetic power, or momentum rate, given the large ambiguity of the conversion from the SiO J=6–5 emission line luminosity to H2 molecular mass.
5.2. Molecular Line Flux Ratios
5.2.1 Observed HCN-to-HCO+ Flux Ratios
The HCN-to-HCO+ flux ratios of the observed (U)LIRGs at J=4–3 and J=3–2 are plotted in the ordinate of Figure 25. As previously seen at J=3–2 (Imanishi et al., 2016c), ULIRGs with infrared-identified luminous AGNs show elevated HCN-to-HCO+ flux ratios at J=4–3, compared with the known starburst-classified galaxies, NGC 1614, IRAS 121120305 SW, and IRAS 135090442. The three ULIRGs with no obvious infrared AGN signatures, IRAS 121120305 NE, IRAS 224911808, and IRAS 204141651, also show elevated HCN-to-HCO+ flux ratios at J=4–3, as previously recognized at J=3–2 (Imanishi et al., 2016c). These three ULIRGs show signatures of vibrationally excited HCN v2=1f J=3–2 emission lines, although the detection significance is 3 for IRAS 204141651 (Imanishi et al., 2016c). In our new ALMA data, the signature of the HCN v2=1f J=4–3 emission line is seen in IRAS 121120305 NE (Figures 4c and 19), which can be taken as an AGN signature, because vibrational excitation of HCN is most likely due to infrared radiative pumping by AGN-heated hot dust emission (1). If we adopt the HCN v2=1f J=4–3 emission line flux of 1.1 (Jy beam-1 km s-1) estimated from the moment 0 map (3.0 detection, Table 16), the HCN v2=1f to v=0 flux ratio at J=4–3 of 0.17 is even higher than that of IRAS 205514250 (0.04), the AGN-containing ULIRG with clearly detectable HCN v2=1f emission lines at J=4–3 and J=3–2, thanks to very small observed molecular line widths (Imanishi & Nakanishi, 2013b; Imanishi et al., 2016b, 2017). For IRAS 121120305 NE and IRAS 224911808, the HCN v2=1f to v=0 flux ratios at J=3–2, estimated in the same way as J=4–3, are both 0.06, which is also higher than that of IRAS 205514250 (0.04) (Imanishi et al., 2016b, c). Although some emission component of the nearby bright HCO+ v=0 line may contaminate the moment 0 maps of the HCN v2=1f line, the HCN v2=1f line is estimated to be emitted fairly strongly in IRAS 121120305 NE and IRAS 224911808. The HCN v2=1f J=4–3 and J=3–2 emission lines can be produced in regions where the infrared 14 m photons are available to vibrationally excite HCN to the v2=1 level. In fact, the emission lines have been detected in Galactic stars and star-forming regions (Ziurys & Turner, 1986; Mills et al., 2013; Veach et al., 2013; Nagy et al., 2015). However, Imanishi et al. (2016b) estimated that the HCN v2=1f J=4–3 to infrared luminosity ratio in IRAS 205514250 is more than a factor of four higher than the Galactic active star-forming core W49A. An AGN scenario is preferred, because the infrared radiative pumping is much more efficient in an AGN than in a starburst (1). These two ULIRGs may contain luminous AGNs that are too highly obscured to be detectable in infrared spectra, but are detected in our (sub)millimeter observations due to smaller dust extinction effects. IRAS 121120305 NE shows a detectable CS J=7–6 emission line (Figure 4d). The observed HCN J=4–3 to CS J=7–6 flux ratio for IRAS 121120305 NE is estimated to be 5 (Tables 5 and 16), which is in the range occupied by AGNs (Izumi et al., 2016), supporting the AGN-important scenario for IRAS 121120305 NE. We thus regard IRAS 121120305 NE and IRAS 224911808 as ULIRGs containing infrared-elusive, but (sub)millimeter detectable, extremely deeply buried AGNs. For IRAS 204141651, we need higher quality data to investigate if it belongs to this class of object. We have confirmed the trend of elevated HCN-to-HCO+ flux ratios in AGNs at J=3–2 and J=4–3 compared to starburst-dominated galaxies, as previously argued at J=1–0 (Kohno, 2005; Krips et al., 2008; Privon et al., 2015).
Since HCN has a factor of 5 higher critical density than HCO+ at the same J-transition under the same line opacity (Meijerink et al., 2007; Greve et al., 2009), HCN excitation can be more sub-thermal (meaning that the excitation temperature Tex is much smaller than the molecular gas kinetic temperature Tkin) than HCO+, particularly at higher-J transitions. If HCN is only sub-thermally excited in starburst galaxies, while its excitation is thermal (Tex Tkin) in warm and highly dense molecular gas in the close vicinity of AGNs, then this different excitation could partly explain the trend of higher HCN-to-HCO+ flux ratios in AGN-important galaxies than in starburst galaxies. A comparison of the HCN J=4–3 to J=3–2 flux ratios and HCO+ J=4–3 to J=3–2 flux ratios is shown in Figure 26. The ratios of “HCO+ J=4–3-to-J=3–2 flux ratios”-to-“HCN J=4–3-to-J=3–2 flux ratios” are not systematically different between starburst galaxies (objects A and K) and AGN-important ULIRGs (other than A and K). Excitation has a limited effect for the different HCN-to-HCO+ flux ratios between AGNs and starbursts.
Another mechanism that could explain the difference in the HCN-to-HCO+ flux ratios is abundance. If HCN abundance, relative to HCO+, is elevated in AGNs compared with starbursts, then higher HCN-to-HCO+ flux ratios in AGNs can naturally be explained. The elevated HCN abundance in AGNs suggests that flux attenuation by line opacity (not dust extinction) can be higher for HCN than HCO+. In this case, (1) the observed HCN-to-HCO+ flux ratios in AGNs can be smaller than the intrinsic ratios, and (2) the excess of the observed HCN-to-HCO+ flux ratios could apparently disappear in some HCN-abundance-enhanced AGNs in Figure 25.
To investigate the abundance ratio of HCN and HCO+, we tabulate in Table 13 the HCN-to-H13CN and HCO+-to-H13CO+ flux ratios at J=3–2, based on our deep Cycle 4 isotopologue observations. The flux ratios of HCN-to-H13CN and HCO+-to-H13CO+ at J=3–2 are expected to be comparable, if all emission lines are optically thin and an intrinsic flux ratio of main molecule to its isotopologue line at J=3–2 = main-to-isotopologue abundance ratio (= 12C-to-13C ratio), where is comparable for HCN and HCO+ 333 The most abundant isotopologue is generally more highly excited than the low abundant isotopologue through collisions, due to a larger line opacity () and resulting smaller effective critical density ( 1/). Thus, the value is likely to be larger than unity. This excitation difference at J=3–2 between a main and isotopologue line, and thereby the value can be different between HCN and HCO+. If HCN abundance is higher than HCO+ as expected (1), the effective critical density of HCN will be reduced more than that of HCO+. It is likely that excitation to J=3–2 is promoted more for HCN and the intrinsic HCN-to-H13CN J=3–2 flux ratio is higher than the intrinsic HCO+-to-H13CO+ J=3–2 flux ratio. The estimated HCN J=3–2 flux attenuation derived from the comparison of the intrinsic and observed HCN-to-H13CN J=3–2 flux ratio will be even larger, strengthening our high HCN abundance scenario. . In Table 13, the observed HCN-to-H13CN flux ratios are substantially smaller than the HCO+-to-H13CO+ flux ratios in IRAS 085723915, IRAS 121120305 NE, and IRAS 224911808. Based on the reasonable assumption that isotopologue emission lines are optically thin, it is suggested that the HCN J=3–2 flux attenuation by line opacity is higher than HCO+ J=3–2. Higher HCN abundance, relative to HCO+, is a natural explanation.
For other sources, H13CO+ J=3–2 data were not taken, and only shallow H13CN J=3–2 line data were obtained in Cycle 2 or 3. Table 14 summarizes the HCN-to-H13CN flux ratios at J=3–2 for these sources. Only IRAS 152503609 shows a detectable H13CN J=3–2 emission line, and the HCN-to-H13CN flux ratio at J=3–2 (12) is as small as the above three ULIRGs, suggesting that the HCN J=3–2 flux is significantly attenuated by line opacity. IRAS 152503609 shows a higher HCN-to-HCO+ flux ratio than starburst galaxies. It is possible that high HCN abundance is responsible for the ratio.
5.2.2 Observed HCN-to-HNC Flux Ratios
Regarding the HCN-to-HNC flux ratios in the abscissa of Figure 25, AGN-hosting ULIRGs with high observed HCN-to-HCO+ flux ratios show a wide range of HCN-to-HNC flux ratios at J=3–2 and J=4–3. We see a trend that ULIRGs with optically identified Seyfert-type AGNs (e.g., G: Superantennae, I: PKS 134512) distribute at the right side with higher HCN-to-HNC flux ratios than those with optically elusive, but infrared-identified buried AGNs (e.g., C: IRAS 205514250, D: IRAS 085723915, H: IRAS 152503609; J: IRAS 060357102, L: IRAS 121271412) (Veilleux et al., 1999). The two ULIRGs with optically and infrared-elusive but (sub)millimeter detectable extremely deeply buried AGNs (E: IRAS 121120305 NE and F: IRAS 224911808) distribute at the left side with small HCN-to-HNC flux ratios.
The HNC abundance is known to be relatively low in high radiation density environments in close vicinity to luminous energy sources (either AGNs and/or starbursts) (Schilke et al., 1992; Hirota et al., 1998; Graninger et al., 2014). In an optically-identifiable Seyfert-type AGN, the column density of the obscuring material around a central AGN is modest, and the HNC abundance can be smaller than that of HCN in a large fraction of molecular gas volume. In an optically-elusive, but infrared-detectable buried AGN, the column density of the obscuring material is expected to be higher than the Seyfert-type optically-detectable AGN (Imanishi et al., 2006a, 2008). It can be even higher in an optically- and infrared-elusive, but (sub)millimeter-detectable, extremely deeply buried AGN. The volume fraction of molecular gas with sufficient HNC abundance can be higher in AGNs with a larger column of surrounding material, due to shielding. The overall observed trend of the HCN-to-HNC flux ratios may be caused by the differences in the molecular column density around central AGNs. In the literature, low HCN-to-HNC flux ratios at J=3–2 were found in Arp 220, Mrk 231, and NGC 4418 (Aalto et al., 2007), all which are (or may be) classified as containing buried AGNs surrounded by a large amount of obscuring material (Dudley & Wynn-Williams, 1997; Spoon et al., 2001; Imanishi et al., 2004; Armus et al., 2007; Downes & Eckart, 2007; Veilleux et al., 2009; Gonzalez-Alfonso et al., 2013; Aalto et al., 2015a; Sakamoto et al., 2017), supporting our scenario.
Both HCN and HNC have a comparable critical density at the same J-transitions under the same line opacity (Greve et al., 2009). For IRAS 121120305 NE (object E in Figure 25) and IRAS 224911808 (object F in Figure 25), the HCN-to-H13CN J=3–2 flux ratios are smaller than the HNC-to-HN13C J=3–2 flux ratios (Table 13), suggesting higher HCN J=3–2 line opacity and thereby higher HCN abundance than HNC. For ULIRGs with HCN-to-HNC flux ratios larger than unity in Figure 25, it is naively expected that HCN abundance is higher than HNC. In this case, the effective critical density (1/; is optical depth) of HCN is smaller than HNC, so that HCN can be more easily excited by collision than HNC and that HCN J=4–3 to J=3–2 flux ratios can be systematically higher than HNC J=4–3 to J=3–2 flux ratios. The comparison of the J=4–3 to J=3–2 flux ratios between HCN and HNC in Figure 26 does not show such an expected trend. Instead, the bulk of ULIRGs tend to show slightly higher J=4–3 to J=3–2 flux ratios for HNC than HCN (filled symbols above the solid dashed line).
A possible mechanism to explain the higher J=4–3 to J=3–2 flux ratios for HNC than HCN is infrared radiative pumping. HCN and HNC can be vibrationally excited by absorbing infrared 14 m and 21.5 m photons, respectively, and through the decay back to the vibrational ground level (v=0), the rotational J-transition fluxes of HCN and HNC at v=0 could be enhanced, as compared to collisional excitation alone. Since the number of infrared 21.5 m photons is usually higher than that of 14 m photons in actual (U)LIRGs, HNC is more easily vibrationally excited than HCN (Aalto et al., 2007; Imanishi et al., 2016b, 2017). Since an AGN can emit mid-infrared 10–25 m continuum from hot dust more efficiently than a starburst, this infrared radiative pumping has stronger effects in an AGN than in a starburst. In Figure 26, a higher J=4–3 to J=3–2 flux ratio for HNC than HCN is seen particularly in IRAS 121121305 NE (object E), which is diagnosed to contain an extremely deeply buried AGN. It is possible that infrared radiative pumping contributes to an increase in the ratios for HNC in Figure 26, even though the detection of the HNC v2=1f emission lines is not clear partly due to contamination by other nearby bright emission lines.
In molecular gas around a central AGN, the infrared 21.5 m to 14 m continuum flux ratio at the outer part is expected to be higher than the inner part, due to the reddening of the infrared continuum by dust extinction. If HNC abundance increases substantially at the outer part of the obscuring material due to shielding, then enhancement of the HNC flux, relative to the HCN flux via infrared radiative pumping can be stronger there than in the inner part. This can partly work to decrease the HCN-to-HNC flux ratios in buried AGNs surrounded by a large column density of obscuring molecular gas more than those in optically identified Seyfert-type AGNs with a modest amount of surrounding obscuring material, as observed in Figure 25.
5.2.3 Intrinsic HCN-to-HCO+ and HCN-to-HNC Flux Ratios
If the enhanced HCN emission line fluxes in AGN-important ULIRGs are due to elevated HCN abundance, then flux attenuation by line opacity is expected to be higher for HCN than HCO+ and HNC. In this case, the observed HCN-to-HCO+ and HCN-to-HNC flux ratios are smaller than the intrinsic values corrected for line opacities. For ULIRGs with detected isotopologue H13CN, H13CO+, and HN13C J=3–2 emission lines (IRAS 121120305 NE and IRAS 224911808), we can estimate the HCN-to-H13CN, HCO+-to-H13CO+, and HNC-to-HN13C flux ratios at J=3–2. As explained in 5.2.1 (paragraph 4), if the observed flux ratios are smaller than the 12C-to-13C abundance ratio of 50–100 estimated for ULIRGs (Henkel & Mauersberger, 1993; Henkel et al., 1993; Martin et al., 2010; Henkel et al., 2014; Sliwa & Downes, 2017), we attribute the difference to the flux attenuation of the main molecule (i.e., HCN, HCO+, HNC) by line opacity. We derive the ratio of flux attenuation between HCN and HCO+ (HNC) and plot in Figure 25 the intrinsic HCN-to-HCO+ and HCN-to-HNC flux ratios after line opacity correction 444 The ratio of flux attenuation between HCN and HCO+ (HNC), and thereby the correction factor in the HCN-to-HCO+ (HCN-to-HNC) flux ratio is independent of the adopted absolute value of the 12C-to-13C abundance ratio (between 50–100) and the value in 5.2.1 (paragraph 4). . The same intrinsic flux ratios for AGN-containing ULIRG IRAS 205514205 (Imanishi et al., 2016b, 2017) are also plotted in Figure 25. In the intrinsic flux ratios, AGNs with elevated HCN abundance and starburst galaxies are separated more clearly than in the observed flux ratios, making the distinction of AGNs and starbursts even more solid. Strictly speaking, the correction must be applied to starburst galaxies (objects A, B, and K in Figure 25) in the same way as the AGN-important HCN-flux-enhanced ULIRGs, but we have no isotopologue data for these starburst galaxies. Starbursts show non-high HCN-to-HCO+ flux ratios at various J-transitions (Kohno, 2005; Imanishi et al., 2007a; Krips et al., 2008; Imanishi et al., 2009; Privon et al., 2015; Izumi et al., 2016; Imanishi et al., 2016c), including J=1–0 where unlike higher J-transitions, excitation of both HCN and HCO+ is expected to be close to thermal in typical starbursts. A much higher HCN abundance than HCO+ is not required to explain the observed non-high HCN-to-HCO+ flux ratios in starbursts. It is very unlikely that starburst galaxies will move to the upper-right direction substantially after possible line opacity correction.
Our results suggest that in AGN-important ULIRGs, (1) HCN abundance is high, (2) HCN flux is high, and (3) HCN line opacity is larger than unity. These three derived indications can be reconciled if molecular gas is clumpy (Solomon et al., 1987), where HCN flux increase is expected with increased HCN abundance even under larger line opacity than unity, because the surface area of line-emitting regions in individual clumps can increase with increasing line opacity, providing a larger area filling factor of line-emitting regions inside a molecular cloud (Imanishi et al., 2007a). However, the indications are difficult to explain if molecular gas spatially distributes smoothly, because in this geometry, HCN flux saturates when HCN line opacity exceeds unity. We thus regard that molecular gas in the observed AGN-important HCN-flux-excess ULIRGs consists of a clumpy structure.
In Figure 25, the observed HCN-to-HCO+ and HCN-to-HNC flux ratios at J=3–2 and J=4–3 are high in Superantennae (object G), which shows by far the largest molecular line widths (Tables 4–7 and Imanishi et al. (2016c)). According to the original clumpy molecular gas model in our Milky Way galaxy (Solomon et al., 1987), line opacity predominantly comes within individual clumps, with a minor contribution from foreground different clumps in a molecular cloud. However, the molecular volume number density of (U)LIRGs is expected to be higher than that in Galactic molecular clouds, in which case, obscuration by foreground clumps may not be negligible. If the high observed HCN-to-HCO+ and HCN-to-HNC flux ratios in Superantennae are partly due to reduced HCN line opacity by large line widths caused by high turbulence of clumps within molecular clouds, then it is indicated that obscuration by foreground clumps within a molecular cloud contributes to flux attenuation to some degree in ULIRGs other than Superantennae. It is possible that in ULIRGs, molecular gas is in a clumpy form with a larger volume filling factor than Galactic molecular clouds and line opacity comes both within individual clumps and from foreground clumps. If this scenario is the case, the line opacity by foreground clumps can be high in less turbulent ULIRGs with small observed molecular line widths. AGNs obscured by less turbulent molecular gas with elevated HCN abundance may not necessarily show high observed HCN-to-HCO+ flux ratios; thus, AGN identification may be missed based on the observed flux ratios. Evaluation of line opacity ratios among HCN, HCO+, and HNC is important particularly for AGN-important ULIRGs with relatively small observed molecular line widths.
5.2.4 RADEX Calculations and Molecular Gas Physical Properties
By assuming collisional excitation and using the large velocity gradient (LVG) method in the widely used RADEX code (van der Tak et al., 2007) we attempted to constrain the molecular gas physical parameters, based on the available J=4–3 and J=3–2 data of HCN, HCO+, and HNC. The collisional rates are from Schöier et al. (2005). Molecular line flux ratios are primarily determined by the following three parameters: H2 volume number density (nH2), H2 kinetic temperature (Tkin), and molecular column density divided by line width (Nmol/v). Here, the 3 K cosmic microwave background radiation is always included, and v is derived from observed molecular line widths. At least three independent observational data are necessary to meaningfully constrain these three parameters, while we have only two J-transitions. We thus assume that the column densities of HCN, HCO+, and HNC are 1 1016 cm-2, because (1) NH 1024 cm-2 is typically found in (U)LIRGs (Ricci et al., 2017) and (2) the abundance ratios of HCN, HCO+, and HNC, relative to H2, in warm molecular gas in (U)LIRGs are estimated to be 10-8 (Greve et al., 2009). Although the HCN abundance is estimated to be higher than HCO+ and HNC in many of our ULIRG samples (5.2.1–5.2.3), we adopted the same value as above, so as not to increase the free parameters relative to the limited number of observational constraints.
Figure 27 presents the J=4–3 to J=3–2 flux ratios of HCN, HCO+, and HNC, as a function of kinetic temperature (Tkin [K]) and H2 volume number density (nH2 [cm-3]), where line widths of 400 km s-1 and 1000 km s-1 are used to represent all galaxies (except for Superantennae) and Superantennae, respectively. The ratios of J=4–3 to J=3–2 flux in (Jy km s-1) in the observed (U)LIRGs are 0.6–1.3, 0.7–1.5, and 0.8–1.5 for HCN, HCO+, and HNC, respectively (Table 11). In Figures 27a, b, c, assuming a molecular gas kinetic temperature of Tkin = 30–80 K, a volume number density of nH2 = 104–107 cm-3, 103–107 cm-3, and 105–107 cm-3 can reproduce the observed flux ratios of HCN, HCO+, and HNC, respectively, except for a small fraction of sources with very low HCN J=4–3 to J=3–2 flux ratios (0.6). For the bulk of galaxies where the flux ratios are close to or larger than unity, a volume number density of at least nH2 = 105–106 cm-3 is needed. Figures 27d,e,f are RADEX calculations for the very large molecular line width of Superantennae (v 1000 km s-1). For a given kinetic temperature and volume number density, the flux ratios tend to be slightly lower than in Figures 27a,b,c. Assuming the same molecular gas kinetic temperature range of Tkin = 30–80 K, a volume number density of nH2 = 105–106 cm-3 is required to reproduce the J=4–3 to J=3–2 flux ratios of HCN, HCO+, and HNC for Superantennae. For ULIRGs with nH2 105-6 cm-3, in the case of 100 pc-scale nuclear molecular size (Table 10 and Scoville et al. (2015)), the column density becomes NH2 3 1025-26 cm-2 (i.e., heavily Compton thick), if the dense gas fully occupies the volume of molecular clouds. If molecular gas is clumpy and the volume filling factor is 1–10, the NH2 column density approaches 3 1024 cm-2 (i.e., mildly Compton thick), as observed from X-ray observations of ULIRGs (Teng et al., 2015; Ricci et al., 2017; Oda et al., 2017). The volume filling factor will be even smaller, if the nuclear molecular size is substantially larger than 100 pc.
5.3. Relation between Molecular Line and Infrared Luminosity
Since stars are formed in dense molecular gas, it is expected that dense molecular gas mass and star-formation rate are correlated. The correlation between infrared luminosities (= star-formation rate indicator) and emission line luminosities of HCN and HCO+ (= dense molecular mass tracers) has been investigated and observationally confirmed in various types of galaxies and Galactic star-forming regions (Gao & Solomon, 2004a; Wu et al., 2005; Evans et al., 2006; Gracia-Carpio et al., 2008; Ma et al., 2013; Zhang et al., 2014; Liu et al., 2016; Tan et al., 2017).
Table 15 summarizes the luminosities of selected bright molecular emission lines. Figure 28 plots the comparison of HCN and HCO+ emission line luminosity at J=4–3 and J=3–2 with infrared luminosity. For the spatially extended LIRG, NGC 1614 (the leftmost circle in all figures), HCN and HCO+ luminosities are derived from Gaussian fits of the spatially integrated spectra, but diffuse emission with a spatial extent larger than the maximum recoverable scale of our ALMA data can be missed. For other ULIRGs, the luminosities are calculated from Gaussian fits of the spectra within the beam size, because (1) ULIRGs are usually dominated by nuclear compact energy sources with 500 pc (Soifer et al., 2000) and (2) the dense gas tracers, J=4–3 and J=3–2 emission lines of HCN and HCO+, are also estimated to mostly come from nuclear compact regions (Table 10). We thus regard that the bulk of dense molecular gas emission is covered in our ALMA measurements for our sample 555 For a small fraction of ULIRGs, the synthesized beam size is much smaller than 1′′ and the probed physical scale is significantly smaller than 1 kpc. For them, we measured HCN and HCO+ fluxes at J=4–3 and J=3–2 using Gaussian fits in spectra taken with a 1′′ diameter circular aperture, and confirmed that the estimated fluxes in the 1′′ aperture spectra agree within 30% to those in the beam sized spectra. .
At J=4–3, the distribution of our ULIRG sample tends to be at the upper-left side of the relation, namely the infrared to molecular line luminosity ratios are slightly higher than the best fit lines of Tan et al. (2017) for both HCN and HCO+. The excess infrared emission is sometimes interpreted by significant AGN contributions to the infrared luminosities (Evans et al., 2006). However, if dust and dense molecular gas coexist around luminous AGNs in (U)LIRGs, not only the infrared dust emission luminosity but also the molecular line luminosity of dense gas tracers will increase. If we ignore possible differences in the abundance and excitation conditions between AGNs and star-formation, the infrared to dense molecular line luminosity ratios are not expected to change much in the presence of luminous buried AGNs. If the HCN abundance increases in molecular gas in the close vicinity of a buried AGN and/or if HCN rotational excitation is higher in an AGN, the infrared to HCN J=4–3 luminosity ratio could decrease, rather than increase, in a buried AGN.
At J=3–2, the displacement toward the upper-left side is smaller than J=4–3. This can be explained if the J=4–3 emission lines of HCN and HCO+ are sub-thermally excited. One would think that in the case of sub-thermal J=4–3 excitation, the J=4–3 to J=3–2 flux ratios for HCN would be smaller than HCO+, because the critical density of HCN is a factor of 5 higher than HCO+ under the same line opacity. However, the higher HCN line opacity decreases the effective HCN critical density with 1/; thus, it may be that the J=4–3 excitation of HCN and HCO+ are similarly sub-thermal. Unlike HCN and HNC, the infrared radiative pumping rate per given column density differs only slightly between HCN and HCO+ (Imanishi et al., 2016b, 2017), so that the J=4–3 to J=3–2 flux ratios are not expected to change differently between HCN and HCO+ by infrared radiative pumping.
5.4. Double-Peaked Emission Lines in IRAS 121120305 NE and IRAS 204141651
IRAS 121120305 NE displays double-peaked emission line profiles for HCN J=4–3, HCO+ J=4–3, H13CN J=3–2, CS J=5–4, and possibly CS J=7–6 (Figure 4c,d,g,h), as previously observed for HCN J=3–2 and HCO+ J=3–2 (Imanishi et al., 2016c). The central dips of HCN and HCO+ are considerably stronger at J=4–3 (Figure 4c) than at J=3–2 (Imanishi et al., 2016c). Such double-peaked emission line profiles are not clear for HNC at J=3–2 and J=4–3 (Figure 4a,e). One possibility to produce these double-peaked profiles is self-absorption by foreground molecular gas (Aalto et al., 2015b). If the molecular gas concentration in a galaxy nucleus is very high, the molecular gas spatial distribution can be better approximated by a smooth distribution (Downes et al., 1993; Scoville et al., 2015), rather than the widely accepted clumpy distribution (Solomon et al., 1987). In this scenario, molecular emission at systemic velocities is selectively absorbed by foreground molecular gas, because this velocity component is the most abundant. This effect is strong for molecules with high abundance.
The central dip of HCO+ J=4–3 looks stronger than that of HCN J=4–3 (Figure 4c), which suggests that self-absorption is stronger for HCO+. This seems inconsistent with the higher HCN abundance than HCO+ derived from our ALMA isotopologue observations (5.2.1). The Einstein A coefficients for HCN J=4–3 and HCO+ J=4–3 are 20.6 10-4 and 35.7 10-4, respectively (http://www.splatalogue.net). The Einstein B coefficient from J=3 to J=4 are related to the A coefficient from J=4 to J=3, in the form of B3-4 A4-3, so that the B3-4 coefficient for HCO+ J=4–3 is a factor of 1.7 higher than that of HCN J=4–3. Thus, the photon absorption rate at J=3 of HCO+ could be comparable to that of HCN, if the HCO+ abundance is only a factor of 2 smaller than the HCN abundance (Table 13). The central dip of HCO+ J=4–3 could be as strong as that of HCN J=4–3, but it is difficult to be much stronger in IRAS 121120305 NE.
To further test this scenario, we fit the data of HCN J=4–3 and HCO+ J=4–3 that were not strongly affected by the central dips (Figure 4c) using a single Gaussian function. The resulting single Gaussian fits are shown as curved dotted lines in Figure 17, and the estimated Gaussian fluxes are 1817 and 198 (Jy km s-1) for HCN J=4–3 and HCO+ J=4–3, respectively (Tables 5 and 6). The uncertainty is large because only data at the tail of the Gaussian profiles can be used for the fit, which precludes further quantitatively detailed discussion of whether the central dips of HCN J=4–3 and HCO+ J=4–3 can be explained by the self-absorption model in smoothly distributed molecular gas, under the constraint of higher abundance of HCN than HCO+.
However, the apparently much stronger central dips at J=4–3 than at J=3–2 (Imanishi et al., 2016c) are not easily reconciled with this self-absorption scenario. The Einstein A coefficients for HCN J=3–2 and HCO+ J=3–2 are 8.4 10-4 (s-1) and 14.5 10-4 (s-1), respectively. Since the wavelength at J=3–2 is longer than that at J=4–3, the Einstein B coefficients ( A) are comparable within 5% for J=2 to J=3 and J=3 to J=4, suggesting that the strength of the central dips by self-absorption is also expected to be roughly comparable for J=3–2 and J=4–3 of HCN and HCO+. In molecular gas around AGNs and starbursts, CS abundance is usually predicted to be much lower than HCN and HCO+ (Harada et al., 2013), and yet the CS J=5–4 emission line shows a strong central dip. Most importantly, the isotopologue H13CN J=3–2 emission line, which is believed to be optically thin, also displays a clear central dip. It seems difficult to explain the double-peaked emission line profiles of IRAS 121120305 NE seen in several lines with largely different line opacities, solely by the self-absorption model in smoothly distributed molecular gas. In IRAS 121120305 NE, (1) the flux of HNC J=4–3 is higher than those of HCN J=4–3 and HCO+ J=4–3 (Tables 5, 6, and 7), and (2) the flux of HNC J=3–2 (Table 4) is also as high as those of HCN J=3–2 and HCO+ J=3–2 (Imanishi et al., 2016c), suggesting that the HNC abundance is at least comparable to the HCN and HCO+ abundances. In galaxies, CO abundance is usually more than 3–4 orders of magnitude higher than HCN and HCO+ (Meijerink & Spaans, 2005; Harada et al., 2013). Although strong central dips are expected for these high abundance molecular lines, HNC J=4–3, HNC J=3–2, and CO J=1–0, they show single-peaked emission profiles (Figures 4, 16, and 17, and Evans et al. (2002)).
Another scenario is that the observed double-peaked emission line profiles come from emission from molecular gas in rotating disks (Scoville et al., 2017). The velocity separations of the double-peaked emission lines are 300 km s-1 for HCN J=4–3 and HCO+ J=4–3 (Figure 17), which are comparable to those for HCN J=3–2 and HCO+ J=3–2 (Imanishi et al., 2016c). The intensity-weighted mean velocity (moment 1) maps for HCN J=4–3 and HCO+ J=4–3 of IRAS 121120305 NE in Figure 20 show rotational motion, with a velocity difference of 300 km s-1. The observed double-peaked emission line profiles of HCN J=4–3 and HCO+ J=4–3 can largely be explained by rotation. The same argument was applied to HCN J=3–2 and HCO+ J=3–2 (Imanishi et al., 2016c). This rotating disk model can at least explain the double-peaked emission profile of the optically thin H13CN J=3–2 line more naturally. However, the single-peaked emission line profiles of HNC J=4–3, HNC J=3–2, and CO J=1–0 need to be explained. Since the critical density of CO J=1–0 is much smaller than those of HCN, HCO+, and HNC, the CO J=1–0 emission is expected to be much more spatially extended. For HNC, as explained in 5.2.2, its abundance can be low at the inner part close to the central buried energy source, but can be high at the outer part, due to shielding. In fact, at the AGN-dominant nucleus of the nearby well-studied Seyfert 2 galaxy, NGC 1068, while HCN J=3–2 and HCO+ J=3–2 emission lines are clearly detected and their spatial distribution is very similar (Imanishi et al., 2016a, 2018), HNC J=3–2 emission is much weaker (Imanishi et al. in preparation). If (a) the bulk of the CO J=1–0 emission line comes from spatially extended lower density molecular gas and (b) HNC J=4–3 and HNC J=3–2 emission lines also originate in outer regions than HCN and HCO+ J=4–3 and J=3–2 lines, then the dynamics of CO J=1–0, HNC J=4–3, and HNC J=3–2 may not be dominated by rotation as strongly as the inner HCN and HCO+ emitting dense molecular gas, which may be a reason for the smoother single Gaussian emission line profiles. The stronger double-peaked profiles of HCN and HCO+ at J=4–3 than at J=3–2 could also be explained by rotation, because the J=4–3 emission lines come from more central regions dominated by strong rotation than the J=3–2 emission lines, due to a higher critical density at J=4–3. The HNC-emitting molecular gas in the nuclear region of IRAS 121120305 NE should have a volume number density as high as the inner HCN- and HCO+-emitting molecular gases, because the estimated volume number densities are comparable among HCN, HCO+, and HNC (Figure 27). It is likely that the HNC emitting molecular gas distributes more outside than the HCN and HCO+ emitting one, but is still much more inside than the CO J=1–0 emitting lower density molecular gas. The CH3OH line also displays a single Gaussian profile (Figures 4e and 31), but this is a shock tracer (5.5) whose spatial distribution and line profile can be largely different from those of the nuclear dense molecular gas close to the buried energy source probed with the HCN and HCO+ J=4–3 and J=3–2 emission lines.
The other ULIRG, IRAS 204141651, also displays clear double-peaked emission line profiles for HCN J=4–3, HCO+ J=4–3, and HNC J=4–3 (Figures 12 and 17), as well as HCN J=3–2 and HCO+ J=3–2 (Imanishi et al., 2016c). A similar double-peaked emission line profile is also seen in CS 7–6 (Figures 12 and 31). For the same reasons as applied to IRAS 121120305 NE, the double-peaked profiles of these molecular lines with various optical depths can be reasonably reproduced by rotation, if these lines trace similar dense molecular gas.
5.5. Shock-Origin Molecular Emission Lines
Other serendipitously detected emission lines are evident in the spectra of some observed ULIRGs, including CH3OH, SiO, SO, and SO2, which were also detected in several nearby bright (U)LIRGs in the literature (Martin et al., 2011; Costagliola et al., 2011; Meier et al., 2014; Aladro et al., 2015; Costagliola et al., 2015; Imanishi et al., 2016b, 2017; Saito et al., 2017; Ueda et al., 2017; Sliwa & Downes, 2017).
Fairly strong CH3OH emission was detected in the nuclear region of IRAS 121120305 NE in Figure 4e. The gas-phase reaction is inefficient to form a large amount of CH3OH (Lee et al., 1996). Strong CH3OH emission is interpreted to originate in shocked regions by a slow shock (v 10–15 km s-1), shielded from intense UV radiation, because a shock can liberate CH3OH produced in the ice mantle at the surface of dust grains to the gas phase (Meier & Turner, 2005; Garcia-Burillo et al., 2010; Meier & Turner, 2012; Saito et al., 2017; Ueda et al., 2017). A buried AGN surrounded by a large column density of gas and dust can explain strong CH3OH emission if a shock occurs at the UV-shielded region of the surrounding material. SiO J=6–5 emission is also detected in IRAS 121120305 NE (Figure 4g). It is widely argued that a fast shock (v 15–20 km s-1) can destroy the cores of dust grains and release SiO to the gas phase, explaining strong SiO emission in the (sub)millimeter wavelength range (Martin-Pintado et al., 1992; Garcia-Burillo et al., 2001; Usero et al., 2006; Garcia-Burillo et al., 2010; Meier & Turner, 2012). It is possible that strong shocks are created by molecular outflow at the nucleus of IRAS 121120305 NE.
SO emission is detected in the spectrum of IRAS 224911808 (Figure 5c). As almost all of the sulfur is believed to be depleted onto dust grains (Wakelam et al., 2011), shocks are thought to liberate sulfur-bearing species into the gas phase (Martin et al., 2003, 2005). Another sulfur-bearing species, H2S (Imanishi & Nakanishi, 2014), and another shock tracer, SiO (Figure 5c), were also detected. IRAS 224911808 may contain some shock activity.
These shock tracers were also detected in other ULIRGs in our sample. H2S was detected in IRAS 085723915 (Imanishi & Nakanishi, 2014). The ULIRG IRAS 205514250 shows several shock tracers: H2S, SO2, CH3OH, SO, and HNCO (Imanishi & Nakanishi, 2013b; Imanishi et al., 2016b, 2017). The other shock tracer CH3CN (Codella et al., 2009) was detected in IRAS 121271412 (Imanishi & Nakanishi, 2014) and IRAS 205514250 (Imanishi & Nakanishi, 2013b). Our ALMA data show that shock phenomena are common in the nearby ULIRG population.
6. Summary
We presented our ALMA Cycle 2, 3, and 4 observational results of eleven (U)LIRGs (IRAS 085723915, Superantennae, IRAS 121120305, IRAS 224911808, NGC 1614, IRAS 121271412, IRAS 152503609, PKS 134512, IRAS 060357102, IRAS 135090442, and IRAS 204141651) at J=3–2 of HNC and at J=4–3 of HCN, HCO+, and HNC. All of these (U)LIRGs have available ALMA data of HCN and HCO+ at J=3–2 (Imanishi et al., 2016c). HCN, HCO+, and HNC J=4–3 data had been taken in ALMA Cycle 0 for some sources. By adding our new ALMA data to these existing data, we now have J=3–2 and J=4–3 data of HCN, HCO+, HNC for most of these eleven (U)LIRGs. These multiple rotational J-transition molecular line data make it possible to investigate molecular gas physical properties and the physical reason for the observed molecular line flux ratios. Several interesting molecular line features were detected in selected (U)LIRGs. We summarize our findings in the following.
-
1.
The targeted HCN, HCO+, and HNC emission lines were detected in all of the observed main (U)LIRG’s nuclei. In IRAS 121120305, in addition to the brighter main north-eastern nucleus (IRAS 121120305 NE), the HCO+ J=4–3 emission line was detected in the fainter south-western nucleus (IRAS 121120305 SW).
-
2.
We detected the signatures of the vibrationally excited (v2=1f) HCN J=4–3 emission line in the infrared-starburst-classified ULIRG, IRAS 121120305 NE, which had previously shown a detectable HCN v2=1f J=3–2 emission line. The HCN vibrational excitation is believed to originate in infrared radiative pumping by absorbing infrared 14 m photons, most likely coming from AGN-heated hot dust emission. The v2=1f to v=0 flux ratios of HCN at J=3–2 and J=4–3 in IRAS 121120305 NE could be even higher than those of IRAS 205514250, the AGN-containing ULIRG with clearly detected HCN v2=1f J=3–2 and J=4–3 emission lines. IRAS 121120305 NE may be classified as a ULIRG, which contains an infrared-elusive, but (sub)millimeter-detectable, extremely deeply buried AGN.
-
3.
We confirmed that ULIRGs with infrared- or (sub)millimeter-identified luminous obscured AGNs tend to show significantly higher HCN-to-HCO+ flux ratios at J=3–2 and J=4–3 than galaxies that are classified as starburst-dominated, with no AGN signatures at all (i.e., NGC 1614, IRAS 121120305 SW, and IRAS 135090442).
-
4.
HCN-to-HNC flux ratios at J=3–2 and J=4–3 vary among AGN-classified ULIRGs with elevated HCN-to-HCO+ flux ratios. The HCN-to-HNC flux ratios tend to be higher in optically identified Seyfert-type AGNs than in optically elusive infrared- or (sub)millimeter-detectable buried AGNs. The latter class is thought to contain a larger amount of molecular gas and dust around a central AGN compared with the former class. We interpret that HNC abundance is low at the strongly AGN-affected inner part of the surrounding obscuring material, but high at the outer part, due to shielding. In optically elusive buried AGNs surrounded by a large amount of molecular gas and dust, HNC lines can be strongly emitted from the outer high-HNC-abundance regions.
-
5.
From isotopologue H13CN, H13CO+, and HN13C J=3–2 observations for selected ULIRGs, classified as AGN-important due to high HCN-to-HCO+ J=3–2 and J=4–3 flux ratios, larger flux attenuation by line opacity was estimated for HCN J=3–2 than HCO+ J=3–2 and HNC J=3–2. Higher HCN abundance is a natural explanation. AGN-important galaxies deviate from the distribution of starburst galaxies even further if line-opacity-corrected intrinsic HCN-to-HCO+ and HCN-to-HNC flux ratios are used rather than observed flux ratios, making our molecular line flux method even more solid.
-
6.
We interpret that elevated HCN abundance is primarily responsible for the high HCN-to-HCO+ flux ratios in AGN-important ULIRGs. This scenario and the significant flux attenuation of HCN J=3–2 can be reconciled if molecular gas in ULIRGs distributes in a clumpy form, as was widely argued (Solomon et al., 1987), where line opacity largely comes within individual clumps.
-
7.
The HCO+ J=4–3-to-J=3–2 flux ratios are not systematically higher than HCN J=4–3-to-J=3–2 flux ratios in our observed (U)LIRGs, despite the fact that HCN has a factor of 5 larger critical density than HCO+ at the same J-transition under the same line opacity. Excitation has a limited effect for the higher HCN-to-HCO+ flux ratios observed in AGN-important ULIRGs than in starburst galaxies.
-
8.
From the J=4–3 and J=3–2 fluxes of HCN, HCO+, and HNC, we constrained the molecular gas kinetic temperature and volume number density, using the RADEX code and by assuming column densities of these molecules to be 1 1016 cm-2. For the bulk of ULIRGs whose J=4–3 to J=3–2 flux ratios of HCN, HCO+, and HNC are larger than or close to unity, dense (nH2 105–106 cm-3) molecular gas is needed, if the kinetic temperature is in the range of 30–80 K.
-
9.
A possible signature of the vibrationally excited HNC v2=1f J=4–3 emission line is seen in IRAS 152503609. However, for other (U)LIRGs, the weakness of this line and contamination by other nearby bright emission lines preclude quantitatively reliable estimates of the HNC v2=1f emission line fluxes at J=3–2 and J=4–3.
-
10.
A broad blueshifted absorption feature was detected in the HCO+ J=4–3 line in IRAS 152503609, as had previously been seen in the HCO+ J=3–2 line. When combined with the detection of the redshifted emission sub-peaks, molecular outflow activity is a natural explanation. The profiles were weaker for HCN and HNC than HCO+, suggesting enhanced HCO+ abundance in the outflow of IRAS 152503609. We estimated a molecular outflow mass Moutf 4 108 M⊙, a molecular outflow rate Ṁoutf 250–750 (M⊙ yr-1), a molecular outflow kinetic power Poutf 3% of AGN luminosity (LAGN), and a molecular outflow momentum rate Ṗoutf 37 LAGN/c in IRAS 152503609. These properties can be explained by energy-conserving outflow rather than radiation pressure-driven outflow.
-
11.
IRAS 121120305 NE also shows the P Cygni profile in the SiO J=6–5 line. Given that SiO is a good fast shock tracer, the presence of shock-important molecular outflow is suggested in IRAS 121120305 NE.
-
12.
Our (U)LIRG sample roughly follows the previously established relation between the infrared luminosity and molecular line luminosity of HCN and HCO+ at J=4–3 and J=3–2.
-
13.
Clear double-peaked emission line profiles are detected for HCN J=4–3 and HCO+ J=4–3 in IRAS 121120305 NE and IRAS 204141651, as previously seen in the HCN J=3–2 and HCO+ J=3–2 lines. Given that similar double-peaked emission line profiles are seen in other molecular lines with expected smaller line opacities, we interpret that rotation can largely explain the profiles.
-
14.
Several shock tracers, such as CH3OH, SiO, SO, and SO2 emission lines, are detected fairly strongly in several ULIRGs, suggesting ubiquitous shock phenomena in these ULIRGs.
References
- Aalto et al. (1995) Aalto, S., Booth, R. S., Black, J. H., & Johansson, L. E. B. 1995, A&A, 300, 369
- Aalto et al. (2015b) Aalto, S., Costagliola, S., Martin F., et al. 2015b, A&A, 584, A42
- Aalto et al. (2015a) Aalto, S., Garcia-Burillo, S., Muller, S., et al. 2015a, A&A, 574, A85
- Aalto et al. (2007) Aalto, S., Spaans, M., Wiedner, M. C., et al. 2007, A&A, 464, 193
- Aladro et al. (2015) Aladro, R., Martin, S., Riquelme, D., et al. 2015, A&A, 579, A101
- Armus et al. (2007) Armus, L., Charmandaris, V., Bernard-Salas, J., et al. 2007, ApJ, 656, 148
- Cicone et al. (2014) Cicone, C., Maiolino, R., Sturm, E., et al. 2014, A&A, 562, 21
- Codella et al. (2009) Codella, C., Benedettini, M., Beltran, M. T., et al. 2009, A&A, 507, L25
- Costagliola et al. (2011) Costagliola, F., Aalto, S., Rodriguez, M. I., et al. 2011, A&A, 528, 30
- Costagliola et al. (2015) Costagliola, F., Sakamoto, K., Muller, S., et al. 2015, A&A, 582, A91
- Dartois et al. (2007) Dartois, E., & Munoz-Caro, G. M. 2007, A&A, 476, 1235
- Downes & Eckart (2007) Downes, D., & Eckart, A. 2007, A&A, 468, 57
- Downes et al. (1993) Downes, D., Solomon, P. M., & Radford, S. J. E. 1993, ApJ, 414, L13
- Duc et al. (1997) Duc, P. -A., Mirabel, I. F., & Maza, J. 1997, A&AS, 124, 533
- Dudley & Wynn-Williams (1997) Dudley, C. C., & Wynn-Williams, C. G. 1997, ApJ, 488, 720
- Evans et al. (2002) Evans, A. S., Mazzarella, J. M., Surace, J. A., & Sanders, D. B. 2002, ApJ, 580, 749
- Evans et al. (2006) Evans, A. S., Solomon, P. M., Tacconi, L. J., Vavilkin, T., & Downes, D. 2006, ApJ, 132, 2398
- Farrah et al. (2009) Farrah, D., Connolly, B., Connolly, N. et al. 2009, ApJ, 700, 396
- Gao & Solomon (2004a) Gao, Y., & Solomon, P. M. 2004a, ApJS, 152, 63
- Gao & Solomon (2004b) Gao, Y., & Solomon, P. M. 2004b, ApJ, 606, 271
- Garcia-Burillo et al. (2014) Garcia-Burillo, S., Combes, F., Usero, A., et al. 2014, A&A, 567, 125
- Garcia-Burillo et al. (2001) Garcia-Burillo, S., Martin-Pintado, J., Fuente, A., & Neri, R. 2001, ApJL, 563, L27
- Garcia-Burillo et al. (2010) Garcia-Burillo, S., Usero, A., Fuente, A., et al. 2010, A&A, 519, A2
- Gonzalez-Alfonso et al. (2013) Gonzalez-Alfonso, E., Fischer, J. Bruderer, S., et al. 2013, A&A, 550, 25
- Gonzalez-Alfonso et al. (2014) Gonzalez-Alfonso, E., Fischer, J., Gracia-Carpio, J., et al. 2014, A&A, 561, A27
- Gonzalez-Alfonso et al. (2017) Gonzalez-Alfonso, E., Fischer, J., Spoon, H. W. W., et al. 2017, ApJ, 836, 11
- Gracia-Carpio et al. (2008) Gracia-Carpio, J., Garcia-Burillo, S., Planesas, P., Fuente, A., & Usero, A. 2008, A&A, 479, 703
- Graninger et al. (2014) Graninger, D. M., Herbst, E., berg, K. I., & Vasyunin, A. I. 2014, ApJ, 787, 74
- Greve et al. (2009) Greve, T. R., Papadopoulos, P. P., Gao, Y., & Radford, S. J. E. 2009, ApJ, 692, 1432
- Harada et al. (2010) Harada, N., Herbst, E., & Wakelam, V. 2010, ApJ, 721, 1570
- Harada et al. (2013) Harada, N., Thompson, T. A., & Herbst, E. 2013, ApJ, 765, 108
- Henkel et al. (2014) Henkel, C., Asiri, H., Ao, Y., et al. 2014, A&A, 565, A3
- Henkel & Mauersberger (1993) Henkel, C., & Mauersberger, R. 1993, A&A, 274, 730
- Henkel et al. (1993) Henkel, C., Mauersberger, R., Wiklind, T., et al. 1993, A&A, 268, L17
- Hirota et al. (1998) Hirota, T., Yamamoto, S., Mikami, H., & Ohishi, M. 1998, ApJ, 503, 717
- Imanishi & Dudley (2000) Imanishi, M., & Dudley, C. C. 2000, ApJ, 545, 701
- Imanishi et al. (2006a) Imanishi, M., Dudley, C. C., & Maloney, P. R. 2006a, ApJ, 637, 114
- Imanishi et al. (2007b) Imanishi, M., Dudley, C. C., Maiolino, R., et al. 2007b, ApJS, 171, 72
- Imanishi et al. (2011b) Imanishi, M., Ichikawa, K., Takeuchi, T., et al. 2011b, PASJ, 63, S447
- Imanishi et al. (2008) Imanishi, M., Nakagawa, T., Ohyama, Y., et al. 2008, PASJ, 60, S489
- Imanishi et al. (2010) Imanishi, M., Nakagawa, T., Shirahata, M., Ohyama, Y., & Onaka, T. 2010, ApJ, 721, 1233
- Imanishi & Nakanishi (2006) Imanishi, M., & Nakanishi, K. 2006, PASJ, 58, 813
- Imanishi & Nakanishi (2013a) Imanishi, M., & Nakanishi, K. 2013a, AJ, 146, 47
- Imanishi & Nakanishi (2013b) Imanishi, M., & Nakanishi, K. 2013b, AJ, 146, 91
- Imanishi & Nakanishi (2014) Imanishi, M., & Nakanishi, K. 2014, AJ, 148, 9
- Imanishi et al. (2016a) Imanishi, M., Nakanishi, K., & Izumi, T. 2016a, ApJL, 822, L10
- Imanishi et al. (2016b) Imanishi, M., Nakanishi, K., & Izumi, T. 2016b, ApJ, 825, 44
- Imanishi et al. (2016c) Imanishi, M., Nakanishi, K., & Izumi, T. 2016c, AJ, 152, 218
- Imanishi et al. (2017) Imanishi, M., Nakanishi, K., & Izumi, T. 2017, ApJ, 849, 29
- Imanishi et al. (2018) Imanishi, M., Nakanishi, K., Izumi, T., & Wada, K. 2018, ApJL, 849, 29
- Imanishi et al. (2006b) Imanishi, M., Nakanishi, K., & Kohno, K. 2006b, AJ, 131, 2888
- Imanishi et al. (2004) Imanishi, M., Nakanishi, K., Kuno, N., & Kohno, K. 2004, AJ, 128, 2037
- Imanishi et al. (2007a) Imanishi, M., Nakanishi, K., Tamura, Y., Oi, N., & Kohno, K. 2007a, AJ, 134, 2366
- Imanishi et al. (2009) Imanishi, M., Nakanishi, K., Tamura, Y., & Peng, C. -H. 2009, AJ, 137, 3581
- Iono et al. (2013) Iono, D., Saito, T., Yun, M. S., et al. 2013, PASJ, 65, L7
- Izumi et al. (2015) Izumi, T., Kohno, K., Aalto, S., et al. 2015, ApJ, 811, 39
- Izumi et al. (2016) Izumi, T., Kohno, K., Aalto, S., et al. 2016, ApJ, 818, 42
- Jimenez-Donaire et al. (2017) Jimenez-Donaire, M. J., Bigiel, F., Leroy, A. K., et al. 2017, MNRAS, 466, 49
- Kewley et al. (2001) Kewley, L. J., Heisler, C. A., Dopita, M. A., & Lumsden, S. 2001, ApJS, 132, 37
- Kim & Sanders (1998) Kim, D. -C., & Sanders, D. B. 1998, ApJS, 119, 41
- Kohno (2005) Kohno, K. 2005, in AIP Conf. Ser. 783, The Evolution of Starbursts, ed. S. Hüttemeister, E. Manthey, D. Bomans, & K. Weis (New York: AIP), 203 (astro-ph/0508420)
- Krips et al. (2008) Krips, M., Neri, R., Garcia-Burillo, S., et al. 2008, ApJ, 677, 262
- Lawrence et al. (2007) Lawrence, A., Warren, S. J., Almaini, O., et al. 2007, MNRAS, 379, 1599
- Lee et al. (1996) Lee, H.-H., Bettens, R. P. A., Herbst, E. 1996, A&AS, 119, 111
- Liu et al. (2016) Liu, T., Kim, K-T., Yoo, H., et al. 2016, 829, 59
- Ma et al. (2013) Ma, B., Tan, J. C., & Barnes, P. J. 2013, ApJ, 779, 79
- Maiolino et al. (2012) Maiolino, R., Gallerani, S., Neri, R., et al. 2012, MNRAS, 425, L66
- Martin et al. (2016) Martin, S., Aalto, S., Sakamoto, K., et al. 2016, A&A, 590, A25
- Martin et al. (2010) Martin, S., Aladro, R., Martin-Pintado, J., & Mauersberger, R. 2010, A&A, 522, A62
- Martin et al. (2011) Martin, S., Krips, M., Martin-Pintado, J., et al. 2011, A&A, 527, 36
- Martin et al. (2005) Martin, S., Martin-Pintado, J., Mauersberger, R., Henkel, C., & Garcia-Burillo, S. 2005, ApJ, 620, 210
- Martin et al. (2003) Martin, S., Mauersberger, R., Martin-Pintado, J., Garcia-Burillo, S., & Henkel, C. 2003, A&A, 411, L465
- Martin-Pintado et al. (1992) Martin-Pintado, J., Bachiller, R., & Fuente, A. 1992, A&A, 254, 315
- Meier & Turner (2005) Meier, D. S., & Turner, J. L. 2005, ApJ, 618, 259
- Meier & Turner (2012) Meier, D. S., & Turner, J. L. 2012, ApJ, 755, 104
- Meier et al. (2014) Meier, D. S., Turner, J. L., & Beck, S. C. 2014, ApJ, 795, 107
- Meijerink & Spaans (2005) Meijerink, R., & Spaans, M. 2005, A&A, 436, 397
- Meijerink et al. (2007) Meijerink, R., Spaans, M., & Israel, F. P. 2007, A&A, 461, 793
- Mills et al. (2013) Mills, E. A. C., Gsten, R., Requena-Torres, M. A., & Morris, M. R., 2013, ApJ, 779, 47
- Mirabel et al. (1991) Mirabel, I. F., Lutz, D., & Maza, J. 1991, A&A, 243, 367
- Mller et al. (2005) Mller, H. S. P., Schlder, F., Stutzki, J., Winnewisser, G. 2005, J. Mol. Struct., 742, 215
- Nagy et al. (2015) Nagy, Z., van der Tak, F. F. S., Fuller, G. A., & Plume, R. 2015, A&A, 577, A127
- Nardini et al. (2008) Nardini, E., Risaliti, G., Salvati, M., et al. 2008, MNRAS, 385, L130
- Nardini et al. (2009) Nardini, E., Risaliti, G., Salvati, M., et al. 2009, MNRAS, 399, 1373
- Nardini et al. (2010) Nardini, E., Risaliti, G., Watabe, Y., Salvati, M., & Sani, E. 2010, MNRAS, 405, 2505
- Oda et al. (2017) Oda, S., Tanimoto, A., Ueda, Y., et al. 2017, ApJ, 835, 179O
- Privon et al. (2015) Privon, G. C., Herrero-Illana, R., Evans, A. S., et al. 2015, ApJ, 814, 39
- Rangwala et al. (2011) Rangwala, N., Maloney, P. R., Glenn, J., et al. 2011, ApJ, 743, 94
- Ricci et al. (2017) Ricci, C., Bauer, F. E., Treister, E., et al. 2017, MNRAS, 468, 1273
- Risaliti et al. (2003) Risaliti, G., Maiolino, R., Marconi, A. et al. 2003, ApJ, 595, L17
- Rybicki & Lightman (1979) Rybicki, G. B., & Lightman, A. P. 1979, Radiative Processes in Astrophysics (New York: Wiley)
- Saito et al. (2017) Saito, T., Iono, D., Espada, D., et al. 2017, ApJ, 834, 6
- Sakamoto et al. (2017) Sakamoto, K., Aalto, S., Barcos-Munoz, L., et al. 2017, ApJ, 849, 14
- Sakamoto et al. (2010) Sakamoto, K., Aalto, S., Evans, A. S., Wiedner, M., & Wilner, D. 2010, ApJ, 725, L228
- Sakamoto et al. (2009) Sakamoto, K., Aalto, S., Wilner, D. J. 2009, ApJL, 700, L104
- Sanders et al. (2003) Sanders, D. B., Mazzarella, J. M., Kim, D. -C., Surace, J. A., & Soifer, B. T. 2003, ApJ, 126, 1607
- Sanders & Mirabel (1996) Sanders, D. B., & Mirabel, I. F. 1996, ARA&A, 34, 749
- Schilke et al. (1992) Schilke, P., Walmsley, C. M., Pineau des Forets, G., et al. 1992, A&A, 256, 595
- Schneider et al. (2010) Schneider, D. P., Richards, G. T., & Hall, P. B., et al. 2010, AJ, 139, 2360
- Schöier et al. (2005) Schöier, F. L., van der Tak, F. F. S., van Dishoeck, E. F., & Black, J. H. 2005, A&A, 432, 369
- Scoville et al. (2017) Scoville, N., Murchikova, L., Walter, F., et al. 2017, ApJ, 836, 66
- Scoville et al. (2015) Scoville, N., Sheth, K., Walter, F., et al. 2015, ApJ, 800, 70
- Sliwa & Downes (2017) Sliwa, K., & Downes, D. 2017, A&A, 604, A2
- Soifer et al. (2000) Soifer, B. T., Neugebauer, G., Matthews, K., et al. 2000, AJ, 119, 509
- Solomon et al. (1987) Solomon, P. M., Rivolo, A. R., Barrett, J., & Yahil, A. 1987, ApJ, 319, 730
- Solomon & Vanden Bout (2005) Solomon, P. M., & Vanden Bout, P. A. 2005, ARA&A, 43, 677
- Spoon et al. (2001) Spoon, H. W. W., Keane, J. V., Tielens, A. G. G. M., Lutz, D., & Moorwood, A. F. M. 2001, A&A, 365, L353
- Spoon et al. (2002) Spoon, H. W. W., Keane, J. V., Tielens, A. G. G. M., Lutz, D., Moorwood, A. F. M., & Laurent, O. 2002, A&A, 385, 1022
- Spoon et al. (2006) Spoon, H. W. W., Tielens, A. G. G. M., Armus, L., et al. 2006, ApJ, 638, 759
- Stierwalt et al. (2013) Stierwalt, S., Armus, L., & Surace, J. A., et al. 2013, ApJS, 206, 1
- Tamura et al. (2014) Tamura, Y., Saito, T., Tsuru, T. G., et al. 2014, ApJL, 781, L39
- Tan et al. (2017) Tan, Q-H., Gao, Y., Zhang, Z-Y., et al. 2017, ApJ, submitted
- Teng et al. (2015) Teng, S. H., Rigby, J. R., Stern, D,. et al. 2015, ApJ, 814, 56
- Tunnard et al. (2015) Tunnard, R., Greve, T. R., Garcia-Burillo, S., et al. 2015, ApJ, 800, 25
- Ueda et al. (2017) Ueda, J., Watanabe, Y., Iono, D., et al. 2017, PASJ, 69, 6
- Usero et al. (2006) Usero, A., Garcia-Burillo, S., Martin-Pintado, J., Fuente, A., & Neri, R. 2006, A&A, 448, 457
- van der Tak et al. (2007) van der Tak, F. F. S., Black, J. H., Schoier, F. L., Jansen, D. J., & van Dishoeck, E. F. 2007, A&A, 468, 627
- Veach et al. (2013) Veach, T. J, Groppi, C., & Hedded, A., 2013, ApJ, 765, L34
- Veilleux et al. (2017) Veilleux, S., Bolatto, S., Tombesi, F., et al. 2017, ApJ, 843, 18
- Veilleux et al. (1999) Veilleux, S., Kim, D. -C., & Sanders, D. B. 1999, ApJ, 522, 113
- Veilleux et al. (1995) Veilleux, S., Kim, D. -C., Sanders, D. B., Mazzarella, J. M., & Soifer, B. T. 1995, ApJS, 98, 171
- Veilleux et al. (2013) Veilleux, S., Melendez, M., Sturm, E., et al. 2013, ApJ, 776, 27
- Veilleux et al. (2009) Veilleux, S., Rupke, D. S. N., Kim, D.-C., et al. 2009, ApJS, 182, 628
- Wakelam et al. (2011) Wakelam, V., Hersant, F., & Herpin, F. 2011, A&A, 529, A112
- White et al. (1997) White, R. L., Becker, R. H., Helfand, D. J., & Gregg, M. D. 1997, ApJ, 475, 479
- Wu et al. (2005) Wu, J., Evans II, N. J., Gao, Y., et al. 2005, ApJ, 635, L173
- Yamada et al. (2007) Yamada, M., Wada, K., & Tomisaka, K. 2007, ApJ, 671, 73
- Yuan et al. (2010) Yuan, T. -T., Kewley, L. J., Sanders, D. B. 2010, ApJ, 709, 884
- Zhang et al. (2014) Zhang, Z-Y., Gao, Y., Henkel, C., et al. 2014, ApJL, 784, L31
- Ziurys & Turner (1986) Ziurys, L. M., & Turner, B. E. 1986, ApJ, 300, L19
| Object | Redshift | Physical scale | f12 | f25 | f60 | f100 | log LIR | Optical | IR/submm |
|---|---|---|---|---|---|---|---|---|---|
| [kpc/′′] | [Jy] | [Jy] | [Jy] | [Jy] | [L⊙] | Class | AGN | ||
| (1) | (2) | (3) | (4) | (5) | (6) | (7) | (8) | (9) | (10) |
| IRAS 085723915 | 0.0580 | 1.1 | 0.32 | 1.70 | 7.43 | 4.59 | 12.1 | LIa(Sy2b) | Yg,h,i,j,k,l,m,n |
| Superantennae (IRAS 192547245) | 0.0617 | 1.2 | 0.22 | 1.24 | 5.48 | 5.79 | 12.1 | Sy2 c | Yo,p |
| IRAS 121120305 | 0.0730 | 1.4 | 0.12 | 0.51 | 8.50 | 9.98 | 12.3 | LI a (Sy2 b) | Yq |
| IRAS 224911808 | 0.0776 AA Redshifts are based on ALMA molecular line data (Imanishi et al., 2016c). | 1.5 | 0.05 | 0.55 | 5.44 | 4.45 | 12.2 | HIIa,b | Yq |
| NGC 1614 | 0.0160 | 0.32 | 1.38 | 7.50 | 32.12 | 34.32 | 11.7 | HII d,e (Cpb) | N |
| IRAS 121271412 | 0.1332 AA Redshifts are based on ALMA molecular line data (Imanishi et al., 2016c). | 2.3 | 0.13 | 0.24 | 1.54 | 1.13 | 12.2 | LI a (HII b) | Yi,k,m,n,p |
| IRAS 152503609 | 0.0552 AA Redshifts are based on ALMA molecular line data (Imanishi et al., 2016c). | 1.1 | 0.16 | 1.31 | 7.10 | 5.93 | 12.0 | LI d (Cpb) | Ym,n,p,r,s,t |
| PKS 134512 (IRAS 134511232) | 0.1215 AA Redshifts are based on ALMA molecular line data (Imanishi et al., 2016c). | 2.2 | 0.14 | 0.67 | 1.92 | 2.06 | 12.3 | Sy2 a,b | Ym,n,p |
| IRAS 060357102 | 0.0795 | 1.5 | 0.12 | 0.57 | 5.13 | 5.65 | 12.2 | LI f | Yp,r,u,v |
| IRAS 135090442 | 0.1364 AA Redshifts are based on ALMA molecular line data (Imanishi et al., 2016c). | 2.4 | 0.10 | 0.23 | 1.56 | 2.53 | 12.3 | HII a (Cpb) | N |
| IRAS 204141651 | 0.0870 AA Redshifts are based on ALMA molecular line data (Imanishi et al., 2016c). | 1.6 | 0.65 | 0.35 | 4.36 | 5.25 | 12.3 | HII a (Cpb) | Y(?)q |
Note. — Col.(1): Object name. Col.(2): Redshift. Col.(3): Physical scale in [kpc arcsec-1]. Col.(4)–(7): f12, f25, f60, and f100 are IRAS fluxes at 12 m, 25 m, 60 m, and 100 m, respectively, taken from Kim & Sanders (1998) or Sanders et al. (2003) or the IRAS Faint Source Catalog (FSC). Col.(8): Decimal logarithm of infrared (81000 m) luminosity in units of solar luminosity (L⊙), calculated with D(Mpc)2 (13.48 + 5.16 + ) [ergs s-1] (Sanders & Mirabel, 1996). Col.(9): Optical spectroscopic classification. “Sy2”, “LI”, “HII”, and “Cp” refer to Seyfert 2, LINER, HII-region, and starburstAGN composite, respectively. a: Veilleux et al. (1999). b: Yuan et al. (2010). c: Mirabel et al. (1991). d: Veilleux et al. (1995). e: Kewley et al. (2001). f: Duc et al. (1997). Col.(9): AGN signature in infrared and/or (sub)millimeter spectra. “Y” means that AGN signatures are detected, while sources with no such detectable signatures are marked as “N”. g: Dudley & Wynn-Williams (1997). h: Imanishi & Dudley (2000). i: Imanishi et al. (2006a). j: Spoon et al. (2006). k: Imanishi et al. (2007b). l: Armus et al. (2007). m: Veilleux et al. (2009). n: Nardini et al. (2010). o: Risaliti et al. (2003). p: Imanishi et al. (2010). q: Imanishi et al. (2016c). r: Spoon et al. (2002). s: Imanishi et al. (2011b). t: Stierwalt et al. (2013). u: Dartois et al. (2007). v: Farrah et al. (2009).
| Object | Line | Date | Antenna | Baseline | Integration | Calibrator | ||
|---|---|---|---|---|---|---|---|---|
| [UT] | Number | [m] | [min] | Bandpass | Flux | Phase | ||
| (1) | (2) | (3) | (4) | (5) | (6) | (7) | (8) | (9) |
| IRAS 085723915 | HNC J=3–2 | 2015 Jun 14 | 39 | 21–784 | 12 | J07501231 | J08542006 | J09273902 |
| J=3–2 isotopologue | 2016 Oct 13 | 40 | 19–1808 | 49 | J08542006 | J08542006 | J09163854 | |
| 2016 Oct 14 | 42 | 19–2535 | 49 | J08542006 | J07501231 | J08243916 | ||
| 2016 Oct 15 | 41 | 19–1809 | 49 | J08542006 | J08542006 | J09163854 | ||
| Superantennae | HNC J=3–2 | 2015 May 15 | 37 | 23–558 | 9.3 | J20564714 | Ceres | J19336942 |
| HCN/HCO+ J=4–3 | 2015 May 13 | 36 | 21–558 | 5.2 | J19242914 | Ceres | J19336942 | |
| HNC J=4–3 | 2015 May 14 | 37 | 21–558 | 5.2 | J19242914 | Ceres | J19336942 | |
| IRAS 121120305 | HNC J=3–2 | 2015 May 14 | 37 | 23–558 | 5.2 | J10580133 | Ganymede | J12290203 |
| HCN/HCO+ J=4–3 | 2014 Dec 13 | 37 | 15–349 | 5.7 | J10580133 | Ganymede | J12290203 | |
| HNC J=4–3 | 2014 Dec 12 | 40 | 15–349 | 5.2 | J12290203 | Ganymede | J12290203 | |
| J=3–2 isotopologue | 2016 Oct 19 | 43 | 17–1808 | 38 | J12290203 | J12290203 | J12200203 | |
| 2016 Oct 19 | 43 | 17–1808 | 38 | J12290203 | J12290203 | J12200203 | ||
| 2016 Oct 19 | 43 | 17–1808 | 38 | J12290203 | J12290203 | J12200203 | ||
| IRAS 224911808 | HNC J=3–2 | 2015 May 18 | 37 | 21–555 | 5.2 | J22582758 | Neptune | J22582758 |
| 2015 Aug 11 | 43 | 15–1574 | 5.2 | J22582758 | Ceres | J22582758 | ||
| J=3–2 isotopologue | 2016 Oct 06 | 44 | 19–3248 | 35 | J22582758 | J22582758 | J22361433 | |
| 2016 Oct 06 | 44 | 19–3248 | 35 | J22582758 | J00060623 | J22361433 | ||
| 2016 Oct 07 | 42 | 19–3144 | 35 | J22582758 | J00060623 | J22361433 | ||
| NGC 1614 | HNC J=3–2 | 2015 Jun 14 | 39 | 21—784 | 5.2 | J05384405 | J0522364 | J04230120 |
| IRAS 121271412 | HNC J=3–2 | 2016 Mar 3 | 41 | 15–396 | 29 | J12560547 | J12560547 | J12151731 |
| IRAS 152503609 | HNC J=3–2 | 2016 Mar 13 | 38 | 15–460 | 11 | J17510939 | Titan | J14532648 |
| HCN/HCO+ J=4–3 | 2016 Apr 22 | 41 | 15–612 | 9.4 | J12290203 | Titan | J14532648 | |
| HNC J=4–3 | 2016 Mar 30 | 44 | 15–460 | 9.4 | J17510939 | J15500527 | J14532648 | |
| PKS 134512 | HNC J=3–2 | 2016 Mar 3 | 41 | 15–396 | 21 | J12290203 | Titan | J14151320 |
| HCN/HCO+ J=4–3 | 2016 Mar 10 | 37 | 15–460 | 12 | J12290203 | Titan | J14151320 | |
| IRAS 060357102 | HNC J=3–2 | 2016 Mar 26 | 39 | 15–460 | 12 | J05384405 | J05194546 | J06017036 |
| IRAS 135090442 | HNC J=3–2 | 2016 Mar 3 | 41 | 15–396 | 21 | J12560547 | J12560547 | J13590159 |
| HCN/HCO+ J=4–3 | 2016 Mar 10 | 37 | 15–460 | 20 | J12560547 | J12560547 | J13590159 | |
| HNC J=4–3 | 2016 Mar 24 | 39 | 15–460 | 20 | J12560547 | Titan | J13590159 | |
| IRAS 204141651 | HCN/HCO+ J=4–3 | 2016 Jul 13 | 39 | 15–867 | 24 | J19242914 | Pallas | J20250735 |
| HNC J=4–3 | 2016 Jul 12 | 33 | 15–867 | 5.5 | J19242914 | Pallas | J20250735 | |
Note. — Col.(1): Object name. Col.(2): Observed molecular line. Col.(3): Observing date in UT. Col.(4): Number of antennas used for observations. Col.(5): Baseline length in meter. Minimum and maximum baseline lengths are shown. Col.(6): Net on source integration time in min. Cols.(7), (8), and (9): Bandpass, flux, and phase calibrator for the target source, respectively.
| Object | Frequency | Flux | Peak Coordinate | rms | Synthesized beam |
|---|---|---|---|---|---|
| [GHz] | [mJy/beam] | (RA,DEC)J2000 | [mJy/beam] | [′′ ′′] (∘) | |
| (1) | (2) | (3) | (4) | (5) | (6) |
| 085723915 | 32b: 241.8–245.4, 256.1–259.8 | 1.8 (23) | (09 00 25.36, 39 03 54.1) | 0.079 | 0.900.51 (9∘) |
| iso32: 228.8–232.5, 243.7–247.4 | 1.4 (44) | (09 00 25.38, 39 03 54.1) | 0.031 | 0.390.18 (16∘) | |
| Superantennae | 32b: 240.9–244.6, 255.3–259.0 | 4.4 (38) | (19 31 21.45, 72 39 21.5) | 0.12 | 1.00.61 (59∘) |
| 43a: 333.0–336.8, 345.1–348.8 | 7.7 (29) | (19 31 21.43, 72 39 21.5) | 0.26 | 0.740.41 (66∘) | |
| 43b: 328.8–332.4, 340.7–344.5 | 9.2 (44) | (19 31 21.43, 72 39 21.6) | 0.21 | 0.610.50 (12∘) | |
| 121120305 NE | 32b: 238.3–242.0, 252.5–256.2 | 7.9 (58) | (12 13 46.06, 02 48 41.5) | 0.14 | 0.810.56 (66∘) |
| 43a: 317.3–321.0, 329.4–333.2 | 16.0 (46) | (12 13 46.05, 02 48 41.5) | 0.35 | 1.40.56 (71∘) | |
| 43b: 336.9–340.8, 349.1–352.7 | 13.3 (39) | (12 13 46.06, 02 48 41.6) | 0.34 | 1.00.65 (81∘) | |
| iso32: 225.6–229.2, 240.3–243.9 | 4.6 (96) | (12 13 46.06, 02 48 41.6) | 0.048 | 0.230.20 (37∘) | |
| 121120305 SW | 32b: 238.3–242.0, 252.5–256.2 | 0.81 (6.0) | (12 13 45.94, 02 48 39.1) | 0.14 | 0.810.56 (66∘) |
| 43a: 317.3–321.0, 329.4–333.2 | 1.8 (5.1) | (12 13 45.94, 02 48 39.1) | 0.35 | 1.40.56 (71∘) | |
| 43b: 336.9–340.8, 349.2–352.7 | 1.7 (5.0) | (12 13 45.94, 02 48 39.1) | 0.34 | 1.00.65 (81∘) | |
| iso32: 225.6–229.2, 240.3–243.9 | 0.46 (9.7) | (12 13 45.94, 02 48 39.1) | 0.048 | 0.230.20 (37∘) | |
| 224911808 | 32b: 237.7–241.3, 251.8–255.5 | 4.8 (65) | (22 51 49.35, 17 52 24.2) | 0.073 | 0.410.36 (80∘) |
| iso32: 224.6–228.2, 239.3–242.9 | 2.9 (91) | (22 51 49.35, 17 52 24.1) | 0.032 | 0.180.17 (78∘) | |
| NGC 1614 N | 32b: 251.8–255.5, 266.8–270.6 | 1.7 (8.5) | (04 34 00.00, 08 34 44.2) | 0.20 | 1.10.39 (68∘) |
| NGC 1614 S | 32b: 251.8–255.5, 266.8–270.6 | 1.6 (8.3) | (04 33 59.99, 08 34 45.2) | 0.20 | 1.10.39 (68∘) |
| 121271412 | 32b: 225.5–229.0, 239.1–242.7 | 1.5 (37) | (12 15 19.13, 14 29 41.7) | 0.041 | 0.900.74 (73∘) |
| 152503609 | 32b: 242.5–246.1, 256.7–260.5 | 12.0 (47) | (15 26 59.42, 35 38 37.5) | 0.26 | 1.30.74 (11∘) |
| 43a: 334.9–338.8 AAAll LSB data were flagged. | 16.9 (34 | (15 26 59.43, 35 58 37.4) | 0.49 | 0.870.51 (28∘) | |
| 43b: 330.8–334.4, 342.6–346.6 | 23.1 (47 | (15 26 59.42, 35 58 37.4) | 0.49 | 1.10.56 (25∘) | |
| PKS 134512 | 32b: 227.7–231.2, 241.4–245.1 | 332.7 (69) | (13 47 33.37, 12 17 24.2) | 4.9 | 1.00.83 (49∘) |
| 43a: 303.1–306.7, 315.0–318.7 | 263.6 (91) | (13 47 33.37, 12 17 24.2) | 2.9 | 0.670.59 (50∘) | |
| 060357102 | 32b: 237.0–240.6, 251.0–254.7 | 1.9 (25) | (06 02 53.94, 71 03 10.2) | 0.075 | 1.10.74 (51∘) |
| 135090442 | 32b: 224.9–228.4, 238.4–242.0 | 1.5 (24) | (13 53 31.57, 04 28 04.8) | 0.063 | 0.920.81 (56∘) |
| 43a: 299.4–302.9, 311.1–314.8 | 2.7 (26) | (13 53 31.57, 04 28 04.8) | 0.10 | 0.700.53 (49∘) | |
| 43b: 306.4–309.9, 318.3–322.0 | 3.3 (29) | (13 53 31.57, 04 28 04.8) | 0.11 | 0.690.60 (38∘) | |
| 135090442 NE | 32b: 224.9–228.4, 238.4–242.0 | 2.1 (33) | (13 53 31.66, 04 28 13.1) | 0.063 | 0.920.81 (56∘) |
| 43a: 299.4–302.9, 311.1–314.8 | 3.6 (35) | (13 53 31.66, 04 28 13.1) | 0.10 | 0.700.53 (49∘) | |
| 43b: 306.4–309.9, 318.3–322.0 | 4.1 (36) | (13 53 31.66, 04 28 13.2) | 0.11 | 0.690.60 (38∘) | |
| 204141651 | 43a: 313.5–317.1, 325.5–329.3 | 11.6 (80) | (20 44 18.16, 16 40 16.8) | 0.15 | 0.380.34 (62∘) |
| 43b: 332.9–336.8, 345.0–348.6 | 9.4 (43) | (20 44 18.16, 16 40 16.8) | 0.22 | 0.400.27 (68∘) |
Note. — Col.(1): Object. Col.(2): Frequency range in [GHz] used for continuum extraction. Frequencies at obvious emission lines and absorption features are removed. We denote continuum data taken with “HNC J=3–2”, “J=4–3 of HCN and HCO+”, “HNC J=4–3”, and “J=3–2 of H13CN, H13CO+, HN13C” as 32b, 43a, 43b, and iso32, respectively. Col.(3): Flux in [mJy beam-1] at the emission peak. Value at the highest flux pixel (003–01 pixel-1) is extracted. The detection significance relative to the rms noise is shown in parentheses. Possible systematic uncertainties, coming from the absolute flux calibration uncertainty of ALMA and choice of frequency range for the continuum level determination, are not included. Col.(4): Coordinate of the continuum emission peak in J2000. Col.(5): The rms noise level (1) in [mJy beam-1], derived from the standard deviation of sky signals in each continuum map. Col.(6): Synthesized beam in [arcsec arcsec] and position angle in [degree]. The position angle is 0∘ along the north–south direction and increases in the counterclockwise direction.
| Object | Integrated intensity (moment 0) map | Gaussian line fit | |||||
|---|---|---|---|---|---|---|---|
| Peak | rms | Beam | Velocity | Peak | FWHM | Flux | |
| [Jy beam-1 km s-1] | [′′ ′′] (∘) | [km s-1] | [mJy] | [km s-1] | [Jy km s-1] | ||
| (1) | (2) | (3) | (4) | (5) | (6) | (7) | (8) |
| IRAS 085723915 | 0.59 (7.5) | 0.079 | 0.870.49 (172∘) | 1749712 | 2.60.2 | 26528 | 0.710.10 |
| Superantennae | 1.5 (9.4) | 0.16 | 0.970.59 (59∘) | 1849324 | 2.60.2 | 63755 | 1.60.2 |
| IRAS 121120305 NE | 7.1 (45) | 0.16 | 0.790.54 (66∘) | 217964 | 221 | 36211 | 7.80.3 |
| IRAS 121120305 SW | 0.47 (3.7) | 0.13 | 0.790.54 (66∘) | 2198032 | 1.50.3 | 32170 | 0.470.14 |
| IRAS 224911808 | 5.4 (38) | 0.14 | 0.400.35 (79∘) | 233005 | 171 | 35212 | 6.00.3 |
| NGC 1614 N-peak | 0.23 (1.8) | 0.13 | 1.00.38 (68∘) | 48337 | 3.80.6 | 7113 | 0.280.07 |
| NGC 1614 S-peak | 0.29 (2.3) | 0.13 | 1.00.38 (68∘) | 469734 | 1.70.5 | 274182 | 0.490.36 |
| NGC 1614 25 radius | — | — | — | 4808 (fix) | 9.52.0 | 22973 | 2.30.9 |
| IRAS 121271412 | 0.71 (10) | 0.069 | 0.860.72 (70∘) | 3983018, 4012121 | 2.20.3, 2.20.3 | 21740, 18752 | 0.830.16 |
| IRAS 152503609 | 6.7 (34) | 0.20 | 1.20.72 (11∘) | 165914 | 251 | 26310 | 6.70.3 |
| PKS 134512 | 0.60 (6.0) | 0.10 | 0.980.80 (49∘) | 3639670 | 1.40.2 | 54995 | 0.730.16 |
| IRAS 060357102 | 1.7 (13) | 0.13 | 1.00.73 (51∘) | 238349 | 5.60.3 | 33022 | 1.80.2 |
| IRAS 135090442 | 0.76 (11) | 0.069 | 0.900.78 (51∘) | 409287 | 3.90.2 | 24317 | 0.900.08 |
Note. — Col.(1): Object. Col.(2): Integrated intensity of the HNC J=3–2 emission line (=271.981 GHz) in [Jy beam-1 km s-1] at the emission peak. Detection significance relative to the rms noise (1) in the moment 0 map is shown in parentheses. Possible systematic uncertainty is not included. Col.(3): The rms noise (1) level in the moment 0 map in [Jy beam-1 km s-1], derived from the standard deviation of sky signals in each moment 0 map. Col.(4): Beam size in [arcsec arcsec] and position angle in [degree]. Position angle is 0∘ along the north-south direction, and increases counterclockwise. Cols.(5)–(8): Gaussian fits of emission lines in the spectra at the continuum peak position, within the beam size. For NGC 1614, the fit in a spatially integrated spectrum is also shown. Col.(5): Optical LSR velocity (vopt) of emission peak in [km s-1]. Col.(6): Peak flux in [mJy]. Col.(7): Observed full width at half maximum (FWHM) in [km s-1]. Col.(8): Flux in [Jy km s-1]. The observed FWHM in [km s-1] in column 7 is divided by () to obtain the intrinsic FWHM in [km s-1].
| Object | Integrated intensity (moment 0) map | Gaussian line fit | |||||
|---|---|---|---|---|---|---|---|
| Peak | rms | Beam | Velocity | Peak | FWHM | Flux | |
| [Jy beam-1 km s-1] | [′′ ′′] (∘) | [km s-1] | [mJy] | [km s-1] | [Jy km s-1] | ||
| (1) | (2) | (3) | (4) | (5) | (6) | (7) | (8) |
| Superantennae | 8.6 (4.3) | 2.0 | 0.760.43 (66∘) | 1856918 | 101 | 95747 | 9.70.6 |
| IRAS 121120305NE | 6.0 (22) | 0.27 | 1.40.56 (71∘) | 2168829,2197612 | 121, 172 | 31567,16428 | 6.61.0 |
| 218186 AASingle Gaussian fit using data not strongly affected by the central dip. Data at 21340–21620 km s-1 and 22010–22150 km s-1 in Figure 17 are used for the fit. | 6659 AASingle Gaussian fit using data not strongly affected by the central dip. Data at 21340–21620 km s-1 and 22010–22150 km s-1 in Figure 17 are used for the fit. | 27941 AASingle Gaussian fit using data not strongly affected by the central dip. Data at 21340–21620 km s-1 and 22010–22150 km s-1 in Figure 17 are used for the fit. | 1817 AASingle Gaussian fit using data not strongly affected by the central dip. Data at 21340–21620 km s-1 and 22010–22150 km s-1 in Figure 17 are used for the fit. | ||||
| IRAS 121120305SW | 0.63 (3) | 0.21 | 1.40.56 (71∘) | — | — | — | — |
| IRAS 152503609 | 6.3 (26)BBMain emission component only. | 0.25 BBMain emission component only. | 0.880.54(26∘)BBMain emission component only. | 165615 BBMain emission component only. | 251 BBMain emission component only. | 26912 BBMain emission component only. | 6.80.4 BBMain emission component only. |
| 6.8 (22)CCMain emission component and sub-peak emission component are included (moment 0 map) or fit simultaneously (Gaussian fit). | 0.32 CCMain emission component and sub-peak emission component are included (moment 0 map) or fit simultaneously (Gaussian fit). | 0.880.54(26∘)CCMain emission component and sub-peak emission component are included (moment 0 map) or fit simultaneously (Gaussian fit). | 165614,1700416 CCMain emission component and sub-peak emission component are included (moment 0 map) or fit simultaneously (Gaussian fit). | 251, 4.71.1 CCMain emission component and sub-peak emission component are included (moment 0 map) or fit simultaneously (Gaussian fit). | 2689,11743CCMain emission component and sub-peak emission component are included (moment 0 map) or fit simultaneously (Gaussian fit). | 7.30.4 CCMain emission component and sub-peak emission component are included (moment 0 map) or fit simultaneously (Gaussian fit). | |
| PKS 134512 | 1.5 (7.8) | 0.19 | 0.690.58 (42∘) | 3645827 | 3.60.4 | 51060 | 1.70.3 |
| IRAS 135090442 | 0.68 (10) | 0.067 | 0.700.51 (48∘) | 4092413 | 3.10.3 | 26834 | 0.780.12 |
| IRAS 204141651 | 5.0 (7.8) | 0.64 | 0.370.31(58∘) | 2584534,2628926 | 9.21.4, 9.51.5 | 32699,26572 | 5.41.3 |
Note. — Col.(1): Object. Col.(2): Integrated intensity of the HCN J=4–3 emission line (=354.505 GHz) in [Jy beam-1 km s-1] at the emission peak. Detection significance relative to the rms noise (1) in the moment 0 map is shown in parentheses. Possible systematic uncertainty is not included. Col.(3): The rms noise (1) level in the moment 0 map in [Jy beam-1 km s-1], derived from the standard deviation of sky signals in each moment 0 map. Col.(4): Beam size in [arcsec arcsec] and position angle in [degree]. Position angle is 0∘ along the north-south direction, and increases counterclockwise. Cols.(5)–(8): Gaussian fits of emission lines in the spectra at the continuum peak position, within the beam size. Col.(5): Optical LSR velocity (vopt) of emission peak in [km s-1]. Col.(6): Peak flux in [mJy]. Col.(7): Observed FWHM in [km s-1]. Col.(8): Flux in [Jy km s-1]. The observed FWHM in [km s-1] in column 7 is divided by () to obtain the intrinsic FWHM in [km s-1].
| Object | Integrated intensity (moment 0) map | Gaussian line fit | |||||
|---|---|---|---|---|---|---|---|
| Peak | rms | Beam | Velocity | Peak | FWHM | Flux | |
| [Jy beam-1 km s-1] | [′′ ′′] (∘) | [km s-1] | [mJy] | [km s-1] | [Jy km s-1] | ||
| (1) | (2) | (3) | (4) | (5) | (6) | (7) | (8) |
| Superantennae | 5.3 (6.6) | 0.80 | 0.750.42 (67∘) | 1856518 | 7.30.3 | 82746 | 6.10.4 |
| IRAS 121120305NE | 3.9 (11) | 0.38 | 1.40.54 (71∘) | 2163816,219888 | 9.71.4,162 | 20343,17828 | 4.80.7 |
| 218186 AASingle Gaussian fit using data not strongly affected by the central dip. Data at 21500–21620 km s-1 and 22000–22130 km s-1 in Figure 17 are used. | 6929 AASingle Gaussian fit using data not strongly affected by the central dip. Data at 21500–21620 km s-1 and 22000–22130 km s-1 in Figure 17 are used. | 27827 AASingle Gaussian fit using data not strongly affected by the central dip. Data at 21500–21620 km s-1 and 22000–22130 km s-1 in Figure 17 are used. | 198 AASingle Gaussian fit using data not strongly affected by the central dip. Data at 21500–21620 km s-1 and 22000–22130 km s-1 in Figure 17 are used. | ||||
| IRAS 121120305SW | 1.4 (4.2) | 0.34 | 1.40.55 (71∘) | 2187329 | 5.91.6 | 27180 | 1.60.6 |
| IRAS 152503609 | 2.2 (16)BBMain emission component only. | 0.14BBMain emission component only. | 0.860.48 (30∘)BBMain emission component only. | 1656812 BBMain emission component only. | 142 BBMain emission component only. | 15628 BBMain emission component only. | 2.30.5 BBMain emission component only. |
| 3.9 (12)CCMain emission component and sub-peak emission component are included (moment 0 map) or fit simultaneously (Gaussian fit). | 0.32CCMain emission component and sub-peak emission component are included (moment 0 map) or fit simultaneously (Gaussian fit). | 0.860.48 (30∘)CCMain emission component and sub-peak emission component are included (moment 0 map) or fit simultaneously (Gaussian fit). | 165677,1705521CCMain emission component and sub-peak emission component are included (moment 0 map) or fit simultaneously (Gaussian fit). | 141, 7.91.2 CCMain emission component and sub-peak emission component are included (moment 0 map) or fit simultaneously (Gaussian fit). | 15716,23356CCMain emission component and sub-peak emission component are included (moment 0 map) or fit simultaneously (Gaussian fit). | 4.10.6 CCMain emission component and sub-peak emission component are included (moment 0 map) or fit simultaneously (Gaussian fit). | |
| PKS 134512 | 2.6 (13) | 0.21 | 0.680.58 (42∘) | 3647417 | 6.90.5 | 47936 | 3.20.3 |
| IRAS 135090442 | 0.80 (10) | 0.080 | 0.690.50 (47∘) | 4094113 | 3.50.3 | 29228 | 0.950.13 |
| IRAS 204141651 | 2.3 (12) | 0.19 | 0.380.32(59∘) | 2580312,2630013 | 6.00.8,5.90.6 | 19027, 24432 | 2.50.3 |
Note. — Col.(1): Object. Col.(2): Integrated intensity of the HCO+ J=4–3 emission line (=356.734 GHz) in [Jy beam-1 km s-1] at the emission peak. Detection significance relative to the rms noise (1) in the moment 0 map is shown in parentheses. Possible systematic uncertainty is not included. Col.(3): The rms noise (1) level in the moment 0 map in [Jy beam-1 km s-1], derived from the standard deviation of sky signals in each moment 0 map. Col.(4): Beam size in [arcsec arcsec] and position angle in [degree]. Position angle is 0∘ along the north-south direction, and increases counterclockwise. Cols.(5)–(8): Gaussian fits of emission lines in the spectra at the continuum peak position, within the beam size. Col.(5): Optical LSR velocity (vopt) of emission peak in [km s-1]. Col.(6): Peak flux in [mJy]. Col.(7): Observed FWHM in [km s-1]. Col.(8): Flux in [Jy km s-1]. The observed FWHM in [km s-1] in column 7 is divided by () to obtain the intrinsic FWHM in [km s-1].
| Object | Integrated intensity (moment 0) map | Gaussian line fit | |||||
|---|---|---|---|---|---|---|---|
| Peak | rms | Beam | Velocity | Peak | FWHM | Flux | |
| [Jy beam-1 km s-1] | [′′ ′′] (∘) | [km s-1] | [mJy] | [km s-1] | [Jy km s-1] | ||
| (1) | (2) | (3) | (4) | (5) | (6) | (7) | (8) |
| Superantennae | 1.1 (6.6) | 0.16 | 0.600.49 (11∘) | 1850437 | 2.60.3 | 54685 | 1.40.3 |
| IRAS 121120305 NE | 9.6 (26) | 0.37 | 1.10.68 (81∘) | 217975 | 261 | 40911 | 111 |
| IRAS 121120305 SW | 0.76 (3) | 0.25 | 1.10.68 (81∘) | — | — | — | — |
| IRAS 152503609 | 9.6 (32) | 0.30 | 1.10.55 (26∘) | 165894 | 391 | 2538 | 101 |
| IRAS 135090442 | 0.72 (6.5) | 0.11 | 0.660.59 (41∘) | 4086715 | 3.50.4 | 24239 | 0.800.16 |
| IRAS 204141651 | 1.5 (6.9) | 0.22 | 0.410.27 (68∘) | 2584855, 2622040 | 3.00.8, 2.91.3 | 314, 160 (fix) | 1.40.3 |
Note. — Col.(1): Object. Col.(2): Integrated intensity of the HNC J=4–3 emission line (=362.630 GHz) in [Jy beam-1 km s-1] at the emission peak. Detection significance relative to the rms noise (1) in the moment 0 map is shown in parentheses. Possible systematic uncertainty is not included. Col.(3): The rms noise (1) level in the moment 0 map in [Jy beam-1 km s-1], derived from the standard deviation of sky signals in each moment 0 map. Col.(4): Beam size in [arcsec arcsec] and position angle in [degree]. Position angle is 0∘ along the north-south direction, and increases counterclockwise. Cols.(5)–(8): Gaussian fits of emission lines in the spectra at the continuum peak position, within the beam size. Col.(5): Optical LSR velocity (vopt) of emission peak in [km s-1]. Col.(6): Peak flux in [mJy]. Col.(7): Observed FWHM in [km s-1]. Col.(8): Flux in [Jy km s-1]. The observed FWHM in [km s-1] in column 7 is divided by () to obtain the intrinsic FWHM in [km s-1].
| Object | Line | Integrated intensity (moment 0) map | Gaussian line fit | |||||
|---|---|---|---|---|---|---|---|---|
| Peak | rms | Beam | Velocity | Peak | FWHM | Flux | ||
| [Jy beam-1 km s-1] | [′′ ′′] (∘) | [km s-1] | [mJy] | [km s-1] | [Jy km s-1] | |||
| (1) | (2) | (3) | (4) | (5) | (6) | (7) | (8) | (9) |
| 085723915 | H13CN J=3–2 | 0.11 (2.9) | 0.039 | 0.370.18 (17∘) | 1752429 | 0.340.05 | 39387 | 0.140.04 |
| H13CO+ J=3–2 | 0.094 (3) AAH13CO+ J=3–2 and SiO J=6–5 emission lines are spectrally blended. Data at = 245.86–246.14 GHz in Figure 2c are summed to create the moment 0 map of the H13CO+ J=3–2 emission line. | 0.031 AAH13CO+ J=3–2 and SiO J=6–5 emission lines are spectrally blended. Data at = 245.86–246.14 GHz in Figure 2c are summed to create the moment 0 map of the H13CO+ J=3–2 emission line. | 0.370.18 (15∘) | 1745090 | 0.200.09 | 235 (fix) | 0.0470.021 | |
| HN13C J=3–2 | 0.067 (3) | 0.022 | 0.370.18 (15∘) | — | — | — | — | |
| 121120305 NE | H13CN J=3–2 | 0.56 (12) | 0.049 | 0.220.20 (39∘) | 216876, 219695 | 1.60.1, 1.80.1 | 23717, 12511 | 0.60.1 |
| H13CO+ J=3–2 | 0.060 (2.6) BBData at = 242.41–242.53 GHz in Figure 4g are summed to create the moment 0 map of the H13CO+ J=3–2 emission line. | 0.023 BBData at = 242.41–242.53 GHz in Figure 4g are summed to create the moment 0 map of the H13CO+ J=3–2 emission line. | 0.220.19 (38∘) | 2200331 CCThe blue component of the H13CO+ J=3–2 emission line could be overlapped with the SiO J=6–5 emission line. Only the red component is fitted. | 0.43 (fix) CCThe blue component of the H13CO+ J=3–2 emission line could be overlapped with the SiO J=6–5 emission line. Only the red component is fitted. | 131 (fix) CCThe blue component of the H13CO+ J=3–2 emission line could be overlapped with the SiO J=6–5 emission line. Only the red component is fitted. | 0.060 CCThe blue component of the H13CO+ J=3–2 emission line could be overlapped with the SiO J=6–5 emission line. Only the red component is fitted. (0.16) DDBy applying the blue to red component flux ratio of H13CN J=3–2 with 1.7 to H13CO+ J=3–2, the total H13CO+ J=3–2 line flux could be 2.7 times that of the red component. | |
| HN13C J=3–2 | 0.32 (7.0) | 0.046 | 0.220.19 (38∘) | 217939 | 1.30.1 | 30529 | 0.380.04 | |
| 121120305 SW | H13CN J=3–2 | 0.11 (3) | 0.033 | 0.220.20 (39∘) | — | — | — | — |
| H13CO+ J=3–2 | 0.086 (3) | 0.029 | 0.220.19 (38∘) | — | — | — | — | |
| HN13C J=3–2 | 0.098 (3) | 0.033 | 0.220.19 (38∘) | — | — | — | — | |
| 224911808 | H13CN J=3–2 | 0.94 (19) | 0.051 | 0.170.15 (74∘) | 232766 | 2.60.1 | 40815 | 1.10.1 |
| H13CO+ J=3–2 | 0.31 (12) EEData at = 241.47–241.62 GHz in Figure 5c are summed to create the moment 0 map of the H13CO+ J=3–2 emission line. | 0.026 EEData at = 241.47–241.62 GHz in Figure 5c are summed to create the moment 0 map of the H13CO+ J=3–2 emission line. | 0.160.15 (80∘) | 2318922 | 2.00.2 | 17154 | 0.330.11 | |
| HN13C J=3–2 | 0.18 (4.7) | 0.038 | 0.160.15 (80∘) | 2331823 FFData at 23229 km s-1 in Figure 18 are used for the fitting. | 0.80.1 FFData at 23229 km s-1 in Figure 18 are used for the fitting. | 24443 FFData at 23229 km s-1 in Figure 18 are used for the fitting. | 0.190.04 FFData at 23229 km s-1 in Figure 18 are used for the fitting. | |
Note. — Col.(1): Object. Col.(2): Isotopologue line. H13CN J=3–2 ( = 259.012 GHz) or H13CO+ J=3–2 ( = 260.255 GHz) or HN13C J=3–2 ( = 261.263 GHz). Col.(3): Integrated intensity in [Jy beam-1 km s-1] at the emission peak. Detection significance relative to the rms noise (1) in the moment 0 map is shown in parentheses. Possible systematic uncertainty is not included. Col.(4): The rms noise (1) level in the moment 0 map in [Jy beam-1 km s-1], derived from the standard deviation of sky signals in each moment 0 map. Col.(5): Beam size in [arcsec arcsec] and position angle in [degree]. Position angle is 0∘ along the north-south direction, and increases counterclockwise. Cols.(6)–(9): Gaussian fits of emission lines in the spectra at the continuum peak position, within the beam size. Col.(6): Optical LSR velocity (vopt) of emission peak in [km s-1]. Col.(7): Peak flux in [mJy]. Col.(8): Observed FWHM in [km s-1]. Col.(9): Flux in [Jy km s-1]. The observed FWHM in [km s-1] in column 8 is divided by () to obtain the intrinsic FWHM in [km s-1].
| Object | continuum | apparent size | beam | physical size |
|---|---|---|---|---|
| [mas mas] (∘) | [arcsec arcsec] | [pc pc] | ||
| (1) | (2) | (3) | (4) | (5) |
| IRAS 085723915 | 32b | 90398 46846 (17 | 0.90 0.51 | 1000 520 |
| iso32 | 19615 15718 (5818) | 0.39 0.18 | 220 170 | |
| Superantennae | 32b | 50453 47645 (4887) | 1.0 0.61 | 590 560 |
| 43a | 51368 334141 (13124) | 0.74 0.41 | 600 390 | |
| 43b | 54839 27953 (1437) | 0.61 0.50 | 640 330 | |
| IRAS 121120305 NE | 32b | 26942 21537 (8847) | 0.81 0.56 | 370 290 |
| 43a | 34190 163114 (12432) | 1.4 0.56 | 470 220 | |
| 43b | 36596 8464 (7518) | 1.0 0.65 | 500 120 | |
| iso32 | 15013 13913 (5583) | 0.23 0.20 | 210 190 | |
| IRAS 121120305 SW | 32b | 731259 537336 (14569) | 0.81 0.56 | 1000 740 |
| 43a | could not deconvolve | 1.4 0.56 | — | |
| 43b | 1200470 660320 (8680) | 1.0 0.65 | 1600 910 | |
| iso32 | 20827 13932 (9320) | 0.23 0.20 | 290 190 | |
| IRAS 224911808 | 32b | 24432 21342 (14063) | 0.41 0.36 | 350 310 |
| iso32 | 787 609 (1419) | 0.18 0.17 | 110 87 | |
| NGC 1614 N | 32b | 1890150 1470140 (15516) | 1.1 0.39 | 610 470 |
| NGC 1614 S | 32b | 1740180 1210120 (9815) | 1.1 0.39 | 560 390 |
| IRAS 121271412 | 32b | 270 83 (—) | 0.90 0.74 | 640 200 |
| IRAS 152503609 | 32b | 329126 277208 (16186) | 1.3 0.74 | 350 290 |
| 43a | 27495 13659 (17938) | 0.87 0.51 | 290 140 | |
| 43b | 200 50 (—) | 1.1 0.56 | 220 53 | |
| PKS 134512 | 32b | 18465 9959 (10452) | 1.0 0.83 | 400 210 |
| 43a | 14830 8767 (7324) | 0.67 0.59 | 320 190 | |
| IRAS 060357102 | 32b | 51867 363125 (17427) | 1.1 0.74 | 770 540 |
| IRAS 135090442 | 32b | 49852 35954 (6024) | 0.92 0.81 | 1200 860 |
| 43a | 41663 38162 (4084) | 0.70 0.53 | 990 910 | |
| 43b | 43343 37445 (12480) | 0.69 0.60 | 1000 890 | |
| IRAS 135090442 NE | 32b | 33876 120135 (11924) | 0.92 0.81 | — |
| 43a | 27183 231145 (1175) | 0.70 0.53 | — | |
| 43b | 25572 197138 (6268) | 0.69 0.60 | — | |
| IRAS 204141651 | 43a | 19718 15722 (6822) | 0.38 0.34 | 320 250 |
| 43b | 36125 14726 (855) | 0.40 0.27 | 580 240 |
Note. — Col.(1): Object name. Col.(2): Continuum band. Col.(3): Intrinsic continuum emission size in [mas], after deconvolution using the CASA task “imfit”. The position angle in [degree] is shown in parentheses. Col.(4): Synthesized beam size in [arcsec]. Col.(5): Intrinsic continuum emission size in physical scale in [pc]. No value is shown for IRAS 135090442 NE, because its redshift is unknown.
| Object | HNC J=3–2 | HCN J=4–3 | HCO+ J=4–3 | HNC J=4–3 |
|---|---|---|---|---|
| [mas mas] (∘) | [mas mas] (∘) | [mas mas] (∘) | [mas mas] (∘) | |
| (1) | (2) | (3) | (4) | (5) |
| IRAS 085723915 | 781276 180170 | could not deconvolve AADerived from Cycle 0 data presented by Imanishi & Nakanishi (2013a, 2014). Due to limited data quality and the large synthesized beam size of Cycle 0 data, compared to Cycle 2, 3, and 4 data, constraints on the intrinsic emission size after deconvolution are not strong in many cases. | could not deconvolve AADerived from Cycle 0 data presented by Imanishi & Nakanishi (2013a, 2014). Due to limited data quality and the large synthesized beam size of Cycle 0 data, compared to Cycle 2, 3, and 4 data, constraints on the intrinsic emission size after deconvolution are not strong in many cases. | — |
| Superantennae | 440179 80329 | 490 150 | could not deconvolve | 1210330 270130 |
| IRAS 121120305 NE | 26649 22246 | 631158 19682 | could not deconvolve | 440 180 |
| IRAS 121120305 SW | could not deconvolve | signal too weak | point source | point source |
| IRAS 224911808 | 31337 27340 | could not deconvolve AADerived from Cycle 0 data presented by Imanishi & Nakanishi (2013a, 2014). Due to limited data quality and the large synthesized beam size of Cycle 0 data, compared to Cycle 2, 3, and 4 data, constraints on the intrinsic emission size after deconvolution are not strong in many cases. | could not deconvolve AADerived from Cycle 0 data presented by Imanishi & Nakanishi (2013a, 2014). Due to limited data quality and the large synthesized beam size of Cycle 0 data, compared to Cycle 2, 3, and 4 data, constraints on the intrinsic emission size after deconvolution are not strong in many cases. | could not deconvolve AADerived from Cycle 0 data presented by Imanishi & Nakanishi (2013a, 2014). Due to limited data quality and the large synthesized beam size of Cycle 0 data, compared to Cycle 2, 3, and 4 data, constraints on the intrinsic emission size after deconvolution are not strong in many cases. |
| NGC 1614 | 2260670 1430410 BBMeasured at the southern HNC J=3–2 emission peak in Figure 14. | 1860140 710290 AADerived from Cycle 0 data presented by Imanishi & Nakanishi (2013a, 2014). Due to limited data quality and the large synthesized beam size of Cycle 0 data, compared to Cycle 2, 3, and 4 data, constraints on the intrinsic emission size after deconvolution are not strong in many cases. | 185442 102854 AADerived from Cycle 0 data presented by Imanishi & Nakanishi (2013a, 2014). Due to limited data quality and the large synthesized beam size of Cycle 0 data, compared to Cycle 2, 3, and 4 data, constraints on the intrinsic emission size after deconvolution are not strong in many cases. | 1330330 870560 AADerived from Cycle 0 data presented by Imanishi & Nakanishi (2013a, 2014). Due to limited data quality and the large synthesized beam size of Cycle 0 data, compared to Cycle 2, 3, and 4 data, constraints on the intrinsic emission size after deconvolution are not strong in many cases. |
| IRAS 121271412 | could not deconvolve | could not deconvolve AADerived from Cycle 0 data presented by Imanishi & Nakanishi (2013a, 2014). Due to limited data quality and the large synthesized beam size of Cycle 0 data, compared to Cycle 2, 3, and 4 data, constraints on the intrinsic emission size after deconvolution are not strong in many cases. | could not deconvolve AADerived from Cycle 0 data presented by Imanishi & Nakanishi (2013a, 2014). Due to limited data quality and the large synthesized beam size of Cycle 0 data, compared to Cycle 2, 3, and 4 data, constraints on the intrinsic emission size after deconvolution are not strong in many cases. | could not deconvolve AADerived from Cycle 0 data presented by Imanishi & Nakanishi (2013a, 2014). Due to limited data quality and the large synthesized beam size of Cycle 0 data, compared to Cycle 2, 3, and 4 data, constraints on the intrinsic emission size after deconvolution are not strong in many cases. |
| IRAS 152503609 | 249120 19753 | 46685 6484 | 480 86 | could not deconvolve |
| PKS 134512 | could not deconvolve | 530 380 | could not deconvolve | — |
| IRAS 060357102 | 565161 252196 | — | — | — |
| IRAS 135090442 | 414154 143183 | could not deconvolve | 735148 157146 | point source |
| IRAS 204141651 | — | 290 200 | 340 17 | 656167 265186 |
Note. — Col.(1): Object name. Cols.(2), (3), (4), and (5): Intrinsic emission size of HNC J=3–2, HCN J=4–3, HCO+ J=4–3, and HNC J=4–3 in [mas], respectively, after deconvolution using the CASA task “imfit”. Position angle is 0∘ along the north-south direction, and increases counterclockwise.
| Object | HCN | HCO+ | HNC |
|---|---|---|---|
| (1) | (2) | (3) | (4) |
| IRAS 085723915 | 1.30.2 | 1.40.2 | — |
| Superantennae | 0.90.2 | 0.80.1 | 0.90.2 |
| IRAS 121120305 NE | 0.80.2 | 1.00.2 | 1.40.2 |
| IRAS 121120305 SW nnNo detectable AGN signatures are seen in the optical, infrared, and (sub)millimeter spectra (Table 1). | 1.6 | 1.20.5 | 2.3 |
| IRAS 224911808 | 0.90.2 | 1.50.2 | 1.20.2 |
| NGC 1614 nnNo detectable AGN signatures are seen in the optical, infrared, and (sub)millimeter spectra (Table 1). | 0.60.2 | 1.00.2 | 0.80.4 |
| IRAS 121271412 | 0.90.2 | 0.80.2 | 1.10.3 |
| IRAS 152503609 | 1.30.2 | 1.20.3 | 1.50.2 |
| PKS 134512 | 0.60.1 | 0.80.1 | — |
| IRAS 135090442 nnNo detectable AGN signatures are seen in the optical, infrared, and (sub)millimeter spectra (Table 1). | 0.70.1 | 0.70.1 | 0.90.2 |
| IRAS 204141651 | 1.30.3 | 0.80.1 | — |
Note. — Col.(1): Object. Cols.(2), (3), and (4): Ratio of J=4–3 to J=3–2 flux in (Jy km s-1) for HCN, HCO+, and HNC, respectively. Possible absolute flux calibration uncertainty with maximum 10% in individual ALMA band 6 and 7 data are included.
| Object | HCN/HCO+ | HCN/HNC | ||
|---|---|---|---|---|
| J=4–3 | J=3–2 | J=4–3 | J=3–2 | |
| (1) | (2) | (3) | (4) | (5) |
| IRAS 085723915 | 0.80.1 | 0.90.1 | — | 3.60.6 |
| Superantennae | 1.60.3 | 1.40.2 | 6.81.8 | 6.41.0 |
| IRAS 121120305 NE | 1.40.3 | 1.80.3 | 0.60.1 | 1.00.2 |
| IRAS 121120305 SW nnNo detectable AGN signatures are seen in the optical, infrared, and (sub)millimeter spectra (Table 1). | 1.6 | 0.50.2 | — | 1.40.6 |
| IRAS 224911808 | 1.40.1 | 2.30.2 | 1.10.1 | 1.40.2 |
| NGC 1614 nnNo detectable AGN signatures are seen in the optical, infrared, and (sub)millimeter spectra (Table 1). | 0.180.06 | 0.330.11 | 1.60.7 | 2.21.1 |
| IRAS 121271412 | 1.50.5 | 1.30.2 | 1.30.4 | 1.60.3 |
| IRAS 152503609 | 3.00.7 | 2.60.4 | 0.70.1 | 0.80.1 |
| PKS 134512 | 0.60.1 | 0.70.1 | — | 3.80.9 |
| IRAS 060357102 | — | 0.80.1 | — | 2.70.4 |
| IRAS 135090442 nnNo detectable AGN signatures are seen in the optical, infrared, and (sub)millimeter spectra (Table 1). | 0.80.2 | 0.80.1 | 1.00.2 | 1.20.2 |
| IRAS 204141651 | 2.10.6 | 1.40.2 | 3.91.3 | — |
Note. — Col.(1): Object. Col.(2): Ratio of HCN-to-HCO+ flux in (Jy km s-1) at J=4–3. Col.(3): Ratio of HCN-to-HCO+ flux in (Jy km s-1) at J=3–2. Col.(4): Ratio of HCN-to-HNC flux in (Jy km s-1) at J=4–3. Col.(5): Ratio of HCN-to-HNC flux in (Jy km s-1) at J=3–2. Since HCN and HCO+ line data were taken simultaneously at J=3–2 or J=4–3, only statistical uncertainties for Gaussian fits are considered in Cols. (2) and (3), except Superantennae, for which possible additional 10% systematic uncertainty is added, because the extremely broad molecular emission line profiles make continuum determination ambiguous (Imanishi et al., 2016c). HCN and HNC line data were taken separately. For the HCN-to-HNC flux ratios in Cols. (4) and (5), possible 10% absolute flux calibration uncertainty is added.
| Object | HCN-to-H13CN J=3–2 | HCO+-to-H13CO+ J=3–2 | HNC-to-HN13C J=3–2 |
|---|---|---|---|
| (1) | (2) | (3) | (4) |
| IRAS 085723915 | 19 | 31 | 10 |
| IRAS 121120305 NE | 14 | 77 (29 AAWe assume that H13CO+ J=3–2 has the same emission line profile as H13CN J=3–2, and that the blue component of the H13CO+ J=3–2 emission is overlapped with the stronger SiO J=6–5 emission line in Figure 18.) | 20 |
| IRAS 121120305 SW | 6 | 15 | 4 |
| IRAS 224911808 | 8 | 11 | 31 |
Note. — Col.(1): Object. Col.(2): Ratio of HCN J=3–2 to H13CN J=3–2 flux in (Jy km s-1). HCN J=3–2 flux is taken from Imanishi et al. (2016c). Col.(3): Ratio of HCO+ J=3–2 to H13CO+ J=3–2 flux in (Jy km s-1). HCO+ J=3–2 flux is taken from Imanishi et al. (2016c). Col.(4): Ratio of HNC J=3–2 to HN13C J=3–2 flux in (Jy km s-1).
| Object | HCN J=3–2 | H13CN J=3–2 | HCN/H13CN J=3–2 |
|---|---|---|---|
| (1) | (2) | (3) | (4) |
| Superantennae | 10.60.3 | 0.21 | 51 |
| NGC 1614 | 0.872.0, 0.850.22 | 0.25 AABoth at the northern and southern HCN J=3–2 emission peaks defined in Imanishi et al. (2016c). | 3.5 AABoth at the northern and southern HCN J=3–2 emission peaks defined in Imanishi et al. (2016c). |
| IRAS 121271412 | 1.30.1 | 0.14 | 9 |
| IRAS 152503609 | 5.20.3 | 0.430.16 | 12 |
| PKS 134512 | 2.70.3 | 0.13 | 21 |
| IRAS 060357102 | 4.90.2 | 0.24 | 20 |
| IRAS 135090442 | 1.10.2 | 0.12 | 9 |
Note. — Col.(1): Object. Col.(2): HCN J=3–2 flux in (Jy km s-1) taken from Imanishi et al. (2016c). Col.(3): H13CN J=3–2 flux in (Jy km s-1) derived from integrated intensity (moment 0) maps in ALMA Cycle 2 or 3 data (Table 16). For undetected sources, 3 upper limits are provided. Col.(4): Ratio of HCN J=3–2 to H13CN J=3–2 flux in (Jy km s-1).
| Object | HNC J=3–2 | HCN J=4–3 | HCO+ J=4–3 | HNC J=4–3 |
|---|---|---|---|---|
| (1) | (2) | (3) | (4) | (5) |
| IRAS 085723915 | 1.20.2 | 7.30.7 AATaken from Imanishi & Nakanishi (2014). | 9.70.7 AATaken from Imanishi & Nakanishi (2014). | — |
| 1.90.3 | 5.10.5 AATaken from Imanishi & Nakanishi (2014). | 6.60.5 AATaken from Imanishi & Nakanishi (2014). | — | |
| Superantennae | 3.20.4 | 252 | 161 | 3.70.8 |
| 4.90.6 | 181 | 111 | 2.40.5 | |
| IRAS 121120305 NE | 221 | 244 | 183 | 374 |
| 341 | 173 | 122 | 242 | |
| IRAS 121120305 SW | 1.30.4 | non-detection | 5.92.2 | non-detection |
| 2.00.6 | non-detection | 4.01.5 | non-detection | |
| IRAS 224911808 | 191 | 302 AATaken from Imanishi & Nakanishi (2014). | 222 AATaken from Imanishi & Nakanishi (2014). | 291 AATaken from Imanishi & Nakanishi (2014). |
| 301 | 211 AATaken from Imanishi & Nakanishi (2014). | 151 AATaken from Imanishi & Nakanishi (2014). | 191 AATaken from Imanishi & Nakanishi (2014). | |
| NGC 1614 (2.5”) | 0.30.1 | 0.480.14 BBTaken from Imanishi & Nakanishi (2013a), measured with a 3′′ 3′′ square aperture. | 2.70.2 BBTaken from Imanishi & Nakanishi (2013a), measured with a 3′′ 3′′ square aperture. | 0.300.09 BBTaken from Imanishi & Nakanishi (2013a), measured with a 3′′ 3′′ square aperture. |
| 0.470.18 | 0.340.10 BBTaken from Imanishi & Nakanishi (2013a), measured with a 3′′ 3′′ square aperture. | 1.90.2 BBTaken from Imanishi & Nakanishi (2013a), measured with a 3′′ 3′′ square aperture. | 0.190.06 BBTaken from Imanishi & Nakanishi (2013a), measured with a 3′′ 3′′ square aperture. | |
| IRAS 121271412 | 8.01.5 | 153 AATaken from Imanishi & Nakanishi (2014). | 9.62.4 AATaken from Imanishi & Nakanishi (2014). | 123 AATaken from Imanishi & Nakanishi (2014). |
| 122 | 112 AATaken from Imanishi & Nakanishi (2014). | 6.61.6 AATaken from Imanishi & Nakanishi (2014). | 7.62.2 AATaken from Imanishi & Nakanishi (2014). | |
| IRAS 152503609 | 111 | 141 CCNuclear main emission line component only, after excluding the outflow-origin sub-peak emission component. | 4.81.0 CCNuclear main emission line component only, after excluding the outflow-origin sub-peak emission component. | 212 |
| 171 | 9.90.6 CCNuclear main emission line component only, after excluding the outflow-origin sub-peak emission component. | 3.30.7 CCNuclear main emission line component only, after excluding the outflow-origin sub-peak emission component. | 141 | |
| PKS 134512 | 5.81.3 | 183 | 323 | — |
| 9.02.0 | 122 | 222 | — | |
| IRAS 060357102 | 6.00.7 | — | — | — |
| 9.31.0 | — | — | — | |
| IRAS 135090442 | 9.10.8 | 102 | 132 | 112 |
| 141 | 7.21.1 | 8.61.2 | 7.01.4 | |
| IRAS 204141651 | — | 287 | 132 | 7.51.6 |
| — | 205 | 9.01.1 | 4.91.0 |
Note. — Col.(1): Object. Cols.(2)–(5): Luminosity of HNC J=3–2, HCN J=4–3, HCO+ J=4–3, and HNC J=4–3, in units of (104 L⊙) calculated with Equation (1) of Solomon & Vanden Bout (2005) (first row) and in units of (107 K km s-1 pc2) calculated with Equation (3) of Solomon & Vanden Bout (2005) (second row).
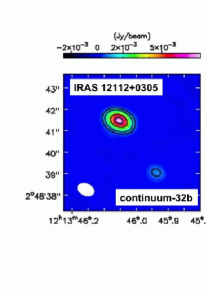
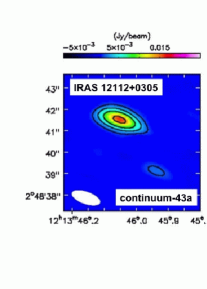
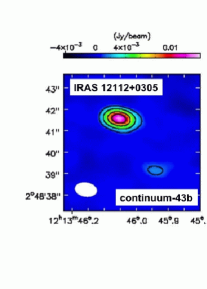
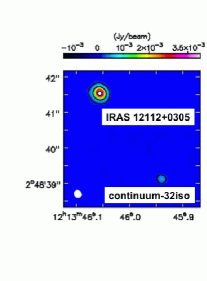
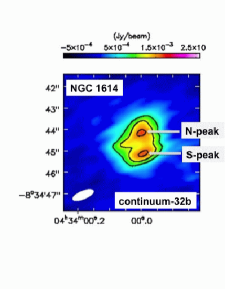
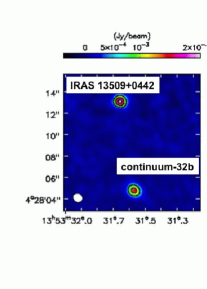
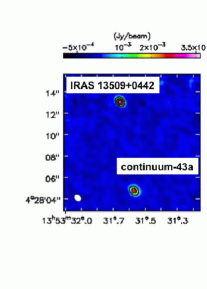
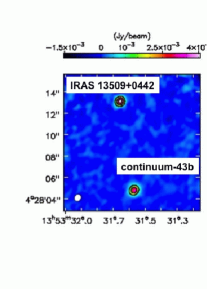


![[Uncaptioned image]](/html/1803.02408/assets/x19.png)
![[Uncaptioned image]](/html/1803.02408/assets/x20.png)
![[Uncaptioned image]](/html/1803.02408/assets/x21.png)
![[Uncaptioned image]](/html/1803.02408/assets/x22.png)
![[Uncaptioned image]](/html/1803.02408/assets/x23.png)
![[Uncaptioned image]](/html/1803.02408/assets/x24.png)
![[Uncaptioned image]](/html/1803.02408/assets/x25.png)
![[Uncaptioned image]](/html/1803.02408/assets/x26.png)
![[Uncaptioned image]](/html/1803.02408/assets/x27.png)
![[Uncaptioned image]](/html/1803.02408/assets/x28.png)
![[Uncaptioned image]](/html/1803.02408/assets/x29.png)
![[Uncaptioned image]](/html/1803.02408/assets/x30.png)
![[Uncaptioned image]](/html/1803.02408/assets/x31.png)
![[Uncaptioned image]](/html/1803.02408/assets/x32.png)
![[Uncaptioned image]](/html/1803.02408/assets/x33.png)


![[Uncaptioned image]](/html/1803.02408/assets/x58.png)
![[Uncaptioned image]](/html/1803.02408/assets/x59.png)
![[Uncaptioned image]](/html/1803.02408/assets/x60.png)
![[Uncaptioned image]](/html/1803.02408/assets/x61.png)
![[Uncaptioned image]](/html/1803.02408/assets/x62.png)
![[Uncaptioned image]](/html/1803.02408/assets/x63.png)
![[Uncaptioned image]](/html/1803.02408/assets/x64.png)
![[Uncaptioned image]](/html/1803.02408/assets/x65.png)
![[Uncaptioned image]](/html/1803.02408/assets/x66.png)


![[Uncaptioned image]](/html/1803.02408/assets/x74.png)
![[Uncaptioned image]](/html/1803.02408/assets/x75.png)
![[Uncaptioned image]](/html/1803.02408/assets/x76.png)
![[Uncaptioned image]](/html/1803.02408/assets/x77.png)
![[Uncaptioned image]](/html/1803.02408/assets/x78.png)
![[Uncaptioned image]](/html/1803.02408/assets/x79.png)
![[Uncaptioned image]](/html/1803.02408/assets/x80.png)
![[Uncaptioned image]](/html/1803.02408/assets/x81.png)
![[Uncaptioned image]](/html/1803.02408/assets/x82.png)
![[Uncaptioned image]](/html/1803.02408/assets/x83.png)
![[Uncaptioned image]](/html/1803.02408/assets/x84.png)
![[Uncaptioned image]](/html/1803.02408/assets/x85.png)
![[Uncaptioned image]](/html/1803.02408/assets/x86.png)
![[Uncaptioned image]](/html/1803.02408/assets/x87.png)
![[Uncaptioned image]](/html/1803.02408/assets/x88.png)
![[Uncaptioned image]](/html/1803.02408/assets/x89.png)
![[Uncaptioned image]](/html/1803.02408/assets/x90.png)
![[Uncaptioned image]](/html/1803.02408/assets/x91.png)
![[Uncaptioned image]](/html/1803.02408/assets/x92.png)
![[Uncaptioned image]](/html/1803.02408/assets/x93.png)
![[Uncaptioned image]](/html/1803.02408/assets/x94.png)
![[Uncaptioned image]](/html/1803.02408/assets/x95.png)
![[Uncaptioned image]](/html/1803.02408/assets/x96.png)
![[Uncaptioned image]](/html/1803.02408/assets/x97.png)
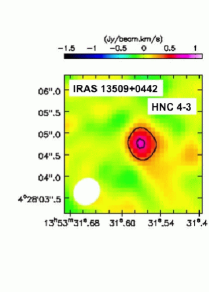
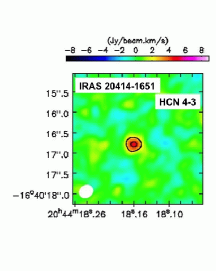
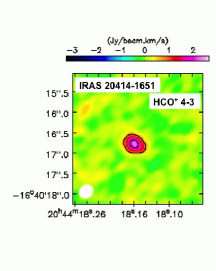
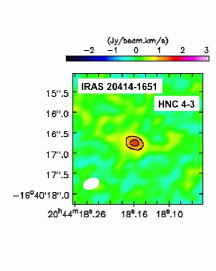
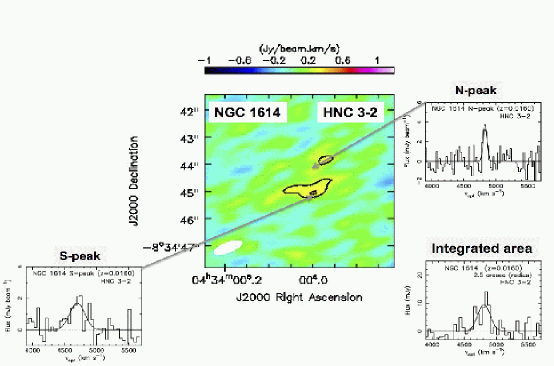
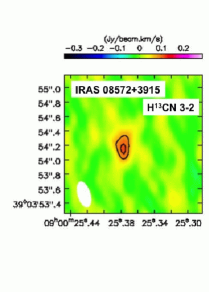
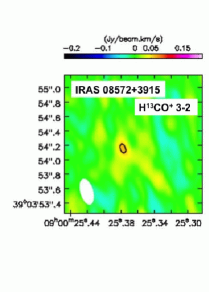
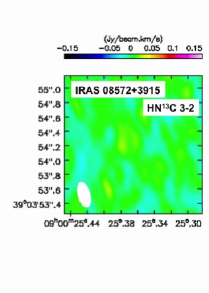
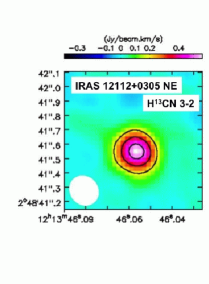
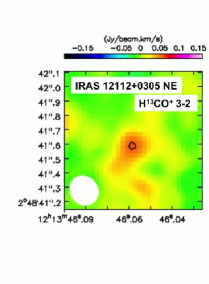
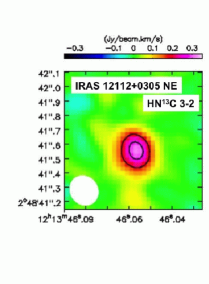
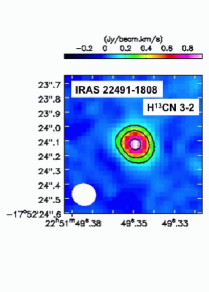
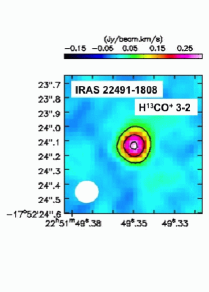
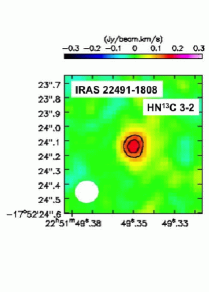


![[Uncaptioned image]](/html/1803.02408/assets/x122.png)
![[Uncaptioned image]](/html/1803.02408/assets/x123.png)
![[Uncaptioned image]](/html/1803.02408/assets/x124.png)
![[Uncaptioned image]](/html/1803.02408/assets/x125.png)
![[Uncaptioned image]](/html/1803.02408/assets/x126.png)
![[Uncaptioned image]](/html/1803.02408/assets/x127.png)
![[Uncaptioned image]](/html/1803.02408/assets/x128.png)
![[Uncaptioned image]](/html/1803.02408/assets/x129.png)
![[Uncaptioned image]](/html/1803.02408/assets/x130.png)
![[Uncaptioned image]](/html/1803.02408/assets/x131.png)
![[Uncaptioned image]](/html/1803.02408/assets/x132.png)
![[Uncaptioned image]](/html/1803.02408/assets/x133.png)
![[Uncaptioned image]](/html/1803.02408/assets/x134.png)
![[Uncaptioned image]](/html/1803.02408/assets/x135.png)
![[Uncaptioned image]](/html/1803.02408/assets/x136.png)


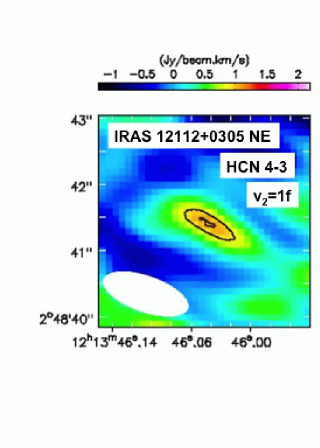
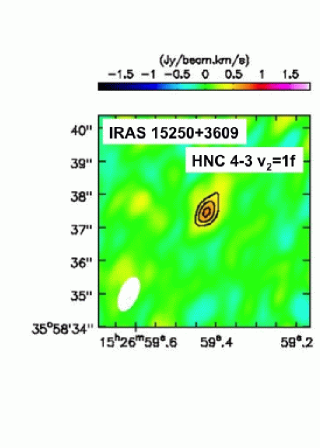
![[Uncaptioned image]](/html/1803.02408/assets/x150.png)
![[Uncaptioned image]](/html/1803.02408/assets/x151.png)
![[Uncaptioned image]](/html/1803.02408/assets/x152.png)
![[Uncaptioned image]](/html/1803.02408/assets/x153.png)
![[Uncaptioned image]](/html/1803.02408/assets/x154.png)
![[Uncaptioned image]](/html/1803.02408/assets/x155.png)
![[Uncaptioned image]](/html/1803.02408/assets/x156.png)
![[Uncaptioned image]](/html/1803.02408/assets/x157.png)
![[Uncaptioned image]](/html/1803.02408/assets/x158.png)
![[Uncaptioned image]](/html/1803.02408/assets/x159.png)
![[Uncaptioned image]](/html/1803.02408/assets/x160.png)
![[Uncaptioned image]](/html/1803.02408/assets/x161.png)
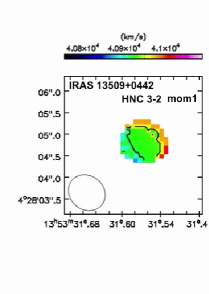
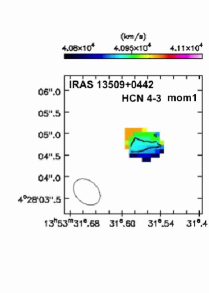
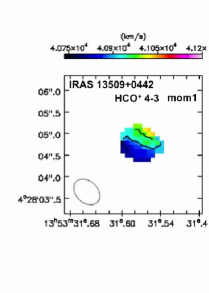
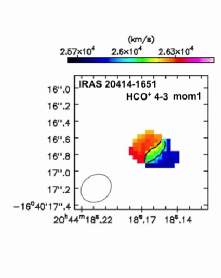
![[Uncaptioned image]](/html/1803.02408/assets/x166.png)
![[Uncaptioned image]](/html/1803.02408/assets/x167.png)
![[Uncaptioned image]](/html/1803.02408/assets/x168.png)
![[Uncaptioned image]](/html/1803.02408/assets/x169.png)
![[Uncaptioned image]](/html/1803.02408/assets/x170.png)
![[Uncaptioned image]](/html/1803.02408/assets/x171.png)
![[Uncaptioned image]](/html/1803.02408/assets/x172.png)
![[Uncaptioned image]](/html/1803.02408/assets/x173.png)
![[Uncaptioned image]](/html/1803.02408/assets/x174.png)
![[Uncaptioned image]](/html/1803.02408/assets/x175.png)
![[Uncaptioned image]](/html/1803.02408/assets/x176.png)
![[Uncaptioned image]](/html/1803.02408/assets/x177.png)
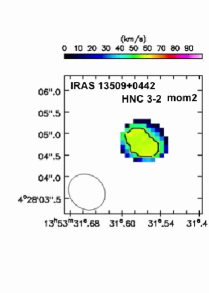
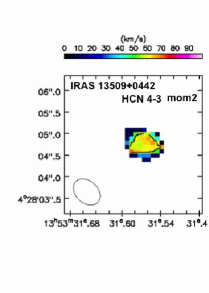
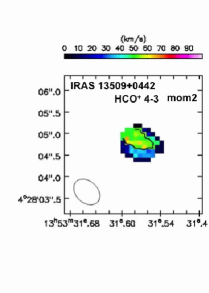
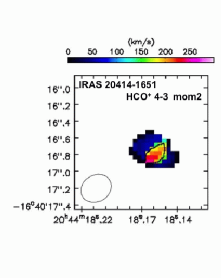


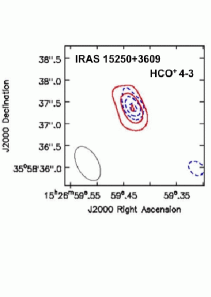
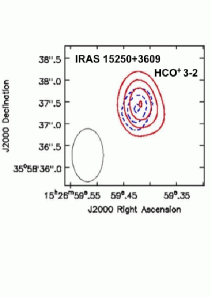
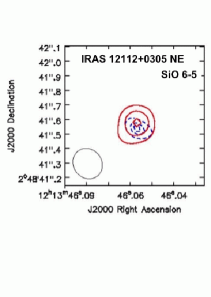

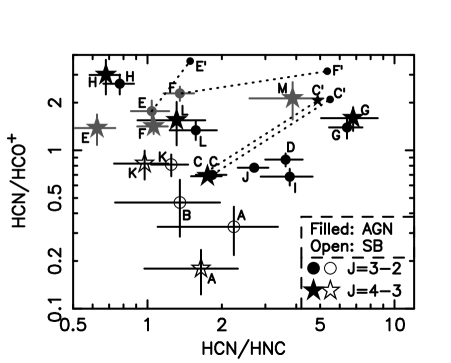


7. Appendix A
Figure 29 displays the continuum emission of ULIRGs, which are dominated by compact nuclear components. The observed properties of serendipitously detected molecular emission lines are summarized in Table 16. Figures 30 and 31 show integrated intensity (moment 0) maps and Gaussian fits in the spectra within the beam sizes of these molecular lines, respectively. Intensity-weighted mean velocity (moment 1) and intensity-weighted velocity dispersion (moment 2) maps of the CS J=5–4 emission line are displayed in Figures 32 and 33, respectively, for IRAS 121120305 NE and IRAS 224911808.
| Object | Line | Integrated intensity (moment 0) map | Gaussian line fit | |||||
|---|---|---|---|---|---|---|---|---|
| Peak | rms | Beam | Velocity | Peak | FWHM | Flux | ||
| Jy beam-1 km s-1 | [′′ ′′] (∘) | [km s-1] | [mJy] | [km s-1] | [Jy km s-1] | |||
| (1) | (2) | (3) | (4) | (5) | (6) | (7) | (8) | (9) |
| 085723915 | CS J=5–4 (244.936) | 0.39 (9.6) | 0.041 | 0.400.19 (16∘) | 1748510 | 1.30.1 | 35022 | 0.440.04 |
| SiO J=6–5 (260.518) | 0.11 (3) | 0.036 | 0.370.18 (16∘) | 17223228 | 0.320.16 | 235 (fix) | 0.0770.037 | |
| SO 6(6)–5(5) (258.256) | 0.12 (3) | 0.040 | 0.370.18 (17∘) | 1747418 | 0.440.06 | 26945 | 0.120.03 | |
| H13CN J=3–2 (259.012) AABased on ALMA Cycle 2 data. | 0.17 (3) | 0.056 | 0.920.51 (8∘) | — | — | — | — | |
| Superantennae | CH3OH (364.859) | 0.67 (3.6) | 0.19 | 0.600.49 (16∘) | 1841860 | 1.50.4 | 418165 | 0.620.30 |
| H13CN J=3–2 (259.012) AABased on ALMA Cycle 2 data. | 0.21 (3) | 0.068 | 1.00.62 (59∘) | — | — | — | — | |
| 121120305 NE | H13CN J=3–2 (259.012) AABased on ALMA Cycle 2 data. | 0.28 (3.2) | 0.086 | 0.840.57 (65∘) | 2175948 | 1.00.3 | 32298 | 0.320.14 |
| HCN v2=1f J=4–3 (356.256) | 1.1 (3.0) | 0.36 | 1.40.55 (71∘) | — | — | — | — | |
| CH3OH (364.859) | 4.3 (13) | 0.33 | 1.00.66 (82∘) | 218468 | 121 | 39423 | 4.60.3 | |
| CS J=7–6 (342.883) | 1.4 (5.5) | 0.25 | 1.40.56 (71∘) | 21688, 21976 (fix) | 1.40.8, 5.11.1 (fix) | 315, 165 (fix) | 1.30.3 | |
| CS J=5–4 (244.936) | 1.4 (29) | 0.048 | 0.230.20 (37∘) | 216604, 219722 | 3.30.1, 3.60.1 | 29210, 1365 | 1.40.1 | |
| HC3N J=27–26 (245.606) | 0.53 (14) | 0.038 | 0.230.20 (37∘) | 2176516, 2198210 | 1.70.1, 0.880.19 | 29447, 12429 | 0.590.17 | |
| SiO J=6–5 (260.518) | 0.18 (7.3) | 0.025 | 0.220.19 (38∘) | — | — | — | — | |
| SO 6(6)–5(5) (258.256) | 0.20 (4.2) | 0.048 | 0.220.20 (39∘) | — | — | — | — | |
| 121120305 SW | CS J=5–4 (244.936) | 0.13 (5.0) | 0.026 | 0.230.20 (37∘) | 2198420 | 0.520.06 | 26546 | 0.140.03 |
| H13CN J=3–2 (259.012) AABased on ALMA Cycle 2 data. | 0.22 (3) | 0.073 | 0.840.57 (65∘) | — | — | — | — | |
| 224911808 | H13CN J=3–2 (259.012) AABased on ALMA Cycle 2 data. | 0.42 (8.1) | 0.052 | 0.410.37 (79∘) | 2327424 | 2.20.2 | 33646 | 0.720.13 |
| HC3N J=30–29 (272.885) | 0.72 (8.8) | 0.081 | 0.400.35 (79∘) | 2330921 | 2.80.3 | 34253 | 0.930.18 | |
| CS J=5–4 (244.936) | 2.4 (46) | 0.052 | 0.190.17 (59∘) | 232784 | 6.30.1 | 4458 | 2.70.1 | |
| HC3N J=27–26 (245.606) | 1.2 (23) | 0.050 | 0.190.17 (59∘) | 232985 | 3.20.1 | 40414 | 1.30.1 | |
| SiO J=6–5 (260.518) | 0.69 (19) | 0.037 | 0.160.15 (80∘) | 232347 | 2.90.1 | 26014 | 0.740.05 | |
| SO 6(6)–5(5) (258.256) | 0.23 (6.7) | 0.035 | 0.170.15 (74∘) | — | — | — | — | |
| NGC 1614 | H13CN J=3–2 (259.012) AABased on ALMA Cycle 2 data. | 0.25 (3) | 0.080 | 1.10.40 (67∘) | — | — | — | — |
| 121271412 | H13CN J=3–2 (259.012) BBBased on ALMA Cycle 3 data. | 0.14 (3) | 0.045 | 0.910.76 (70∘) | ||||
| 152503609 | H13CN J=3–2 (259.012) BBBased on ALMA Cycle 3 data. | 0.43 (4.7) | 0.091 | 1.30.76 (10∘) | 1661524 | 2.30.6 | 18249 | 0.430.16 |
| HNC v2=1f J=4–3 (365.147) | 0.68 (5.3) CCData at = 346.00–346.19 GHz in Figure 8d are summed. | 0.13 CCData at = 346.00–346.19 GHz in Figure 8d are summed. | 1.10.55 (24∘) | 1650835 | 4.00.9 | 15970 | 0.640.32 | |
| CH3OH (364.859) | 3.2 (12) | 0.26 | 1.10.55 (24∘) | 1660212 | 111 | 34434 | 3.70.4 | |
| HC3N J=30–29 (272.885) | 0.81 (9.4) DDNot all of the HC3N J=30–29 emission line is covered in the spectral window, which was used to create the moment 0 map. Thus, the estimated flux is smaller than the Gaussian fit in Figure 31. | 0.086 | 1.20.72 (11∘) | 16580118 | 3.30.4 | 432156 | 1.40.5 | |
| PKS 134512 | CS J=7–6 (342.883) | 0.21 (3.4) | 0.062 | 0.660.59 (53∘) | — | — | — | — |
| H13CN J=3–2 (259.012) BBBased on ALMA Cycle 3 data. | 0.13 (3) | 0.043 | 1.00.85 (49∘) | — | — | — | — | |
| 060357102 | H13CN J=3–2 (259.012) BBBased on ALMA Cycle 3 data. | 0.24 (3) | 0.078 | 1.10.76 (51∘) | — | — | — | — |
| 135090442 | CS J=7–6 (342.883) | 0.16 (3.3) | 0.050 | 0.680.54 (47∘) | — | — | — | — |
| CH3CN (349.346) | 0.84 (9.5) | 0.089 | 0.690.61 (40∘) | — | — | — | — | |
| H13CN J=3–2 (259.012) BBBased on ALMA Cycle 3 data. | 0.12 (3) | 0.040 | 0.950.83 (57∘) | — | — | — | — | |
| 204141651 | CS J=7-6 (342.883) | 0.81 (6.7) | 0.12 | 0.380.34 (67∘) | 2584420, 2627818 | 2.10.2, 1.80.3 | 31956, 18953 | 1.00.2 |
Note. — Col.(1): Object. Col.(2): Line. Rest-frame frequency in [GHz] is shown in parentheses. Col.(3): Integrated intensity in [Jy beam-1 km s-1] at the emission peak. Detection significance relative to the rms noise (1) in the moment 0 map is shown in parentheses. Possible systematic uncertainty is not included. Col.(4): The rms noise (1) level in the moment 0 map in [Jy beam-1 km s-1], derived from the standard deviation of sky signals in each moment 0 map. Col.(5): Beam size in [arcsec arcsec] and position angle in [degree]. Position angle is 0∘ along the north-south direction, and increases counterclockwise. Cols.(6)–(9): Gaussian fits of emission lines in the spectra at the continuum peak position, within the beam size. Col.(6): Optical LSR velocity (vopt) of emission peak in [km s-1]. Col.(7): Peak flux in [mJy]. Col.(8): Observed FWHM in [km s-1]. Col.(9): Flux in [Jy km s-1]. The observed FWHM in [km s-1] in column 8 is divided by () to obtain the intrinsic FWHM in [km s-1].
![[Uncaptioned image]](/html/1803.02408/assets/x201.png)
![[Uncaptioned image]](/html/1803.02408/assets/x202.png)
![[Uncaptioned image]](/html/1803.02408/assets/x203.png)
![[Uncaptioned image]](/html/1803.02408/assets/x204.png)
![[Uncaptioned image]](/html/1803.02408/assets/x205.png)
![[Uncaptioned image]](/html/1803.02408/assets/x206.png)
![[Uncaptioned image]](/html/1803.02408/assets/x207.png)
![[Uncaptioned image]](/html/1803.02408/assets/x208.png)
![[Uncaptioned image]](/html/1803.02408/assets/x209.png)
![[Uncaptioned image]](/html/1803.02408/assets/x210.png)
![[Uncaptioned image]](/html/1803.02408/assets/x211.png)
![[Uncaptioned image]](/html/1803.02408/assets/x212.png)
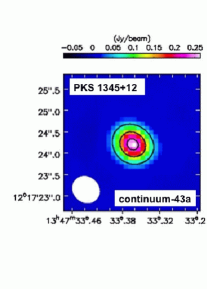
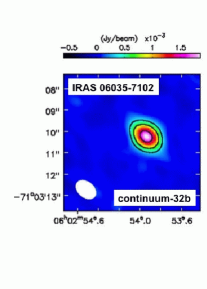
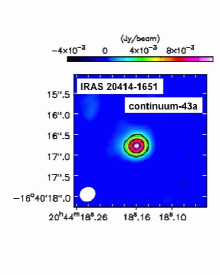
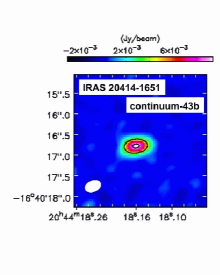
![[Uncaptioned image]](/html/1803.02408/assets/x217.png)
![[Uncaptioned image]](/html/1803.02408/assets/x218.png)
![[Uncaptioned image]](/html/1803.02408/assets/x219.png)
![[Uncaptioned image]](/html/1803.02408/assets/x220.png)
![[Uncaptioned image]](/html/1803.02408/assets/x221.png)
![[Uncaptioned image]](/html/1803.02408/assets/x222.png)
![[Uncaptioned image]](/html/1803.02408/assets/x223.png)
![[Uncaptioned image]](/html/1803.02408/assets/x224.png)
![[Uncaptioned image]](/html/1803.02408/assets/x225.png)
![[Uncaptioned image]](/html/1803.02408/assets/x226.png)
![[Uncaptioned image]](/html/1803.02408/assets/x227.png)
![[Uncaptioned image]](/html/1803.02408/assets/x228.png)
![[Uncaptioned image]](/html/1803.02408/assets/x229.png)
![[Uncaptioned image]](/html/1803.02408/assets/x230.png)
![[Uncaptioned image]](/html/1803.02408/assets/x231.png)
![[Uncaptioned image]](/html/1803.02408/assets/x232.png)
![[Uncaptioned image]](/html/1803.02408/assets/x233.png)
![[Uncaptioned image]](/html/1803.02408/assets/x234.png)
![[Uncaptioned image]](/html/1803.02408/assets/x235.png)
![[Uncaptioned image]](/html/1803.02408/assets/x236.png)
![[Uncaptioned image]](/html/1803.02408/assets/x237.png)
![[Uncaptioned image]](/html/1803.02408/assets/x238.png)
![[Uncaptioned image]](/html/1803.02408/assets/x239.png)
![[Uncaptioned image]](/html/1803.02408/assets/x240.png)
![[Uncaptioned image]](/html/1803.02408/assets/x241.png)
![[Uncaptioned image]](/html/1803.02408/assets/x242.png)
![[Uncaptioned image]](/html/1803.02408/assets/x243.png)
![[Uncaptioned image]](/html/1803.02408/assets/x244.png)
![[Uncaptioned image]](/html/1803.02408/assets/x245.png)
![[Uncaptioned image]](/html/1803.02408/assets/x246.png)
![[Uncaptioned image]](/html/1803.02408/assets/x247.png)
![[Uncaptioned image]](/html/1803.02408/assets/x248.png)
![[Uncaptioned image]](/html/1803.02408/assets/x249.png)
![[Uncaptioned image]](/html/1803.02408/assets/x250.png)
![[Uncaptioned image]](/html/1803.02408/assets/x251.png)