Soft tilt and rotational modes in the hybrid improper ferroelectric Ca3Mn2O7
Abstract
Raman spectroscopy is employed to probe directly the soft rotation and tilting modes, which are two primary order parameters predicted in the hybrid improper ferroelectric material Ca3Mn2O7. We observe a giant softening of the 107-cm-1 octahedron tilting mode by 26 cm-1, on heating through the structural transition from a ferroelectric to paraelectric orthorhombic phase. This is contrasted by a small softening of the 150-cm-1 rotational mode by 6 cm-1. In the intermediate phase, the competing soft modes with different symmetries coexist, bringing about many-faceted anomalies in spin excitations and lattice vibrations. Our work demonstrates that the soft rotation and tilt patterns, relying on a phase-transition path, are a key factor in determining ferroelectric, magnetic, and lattice properties of Ca3Mn2O7.
I Introduction
Hybrid improper ferroelectrics (HIFs) are currently of great interest because they hold promise for the electric field control of nonpolar order parameters as well as for the realization of room-temperature multiferroelectricity Bousquet ; Benedek11 ; Rondinelli ; Benedek12 . In HIFs a polarization is generated by a combination of rotation () and tilt () distortions of the oxygen octahedra (see Fig. 1). In this case, a primary order parameter is given by the amplitude of hybrid distortions, giving rise to rotational (designated R) and tilting (T) soft modes. Despite their technological importance, little is known about their impact on spin, lattice, and ferroelectric dynamics.
The HIF was observed in perovskite superlattices and Ruddlesden-Popper materials Ca3(Ti,Mn)2O7 Bousquet ; Benedek11 ; Harris ; Mulder ; Rondinelli ; Varignon ; Xu ; Oh ; Birol ; Senn15 ; Huang ; Huang16 ; Lee . The prototypical HIF Ca3Mn2O7 consists of an alternating arrangement of the CaO rocksalt layers and CaMnO3 bilayers along the axis as shown in Fig. 1(a). The Ca3Mn2O7 compound is known to undergo a first-order phase transition from a high- tetragonal to a low- orthorhombic phase through a certain intermediate phase Senn15 ; Lobanov ; Gao . An early study has shown that at room temperature the compound comprises a mixture of orthorhombic () and tetragonal () phases, which evolves into a single phase at low temperature Lobanov . However, this structural model was questioned by later refined structural studies Senn15 ; Gao . With decreasing temperature the high- tetragonal structure undergoes a transition to an intermediate paraelectric orthorhombic () and then to a polar symmetry at K. As the temperature is further lowered, a G-type antiferromagnetic order sets in at K Lobanov .
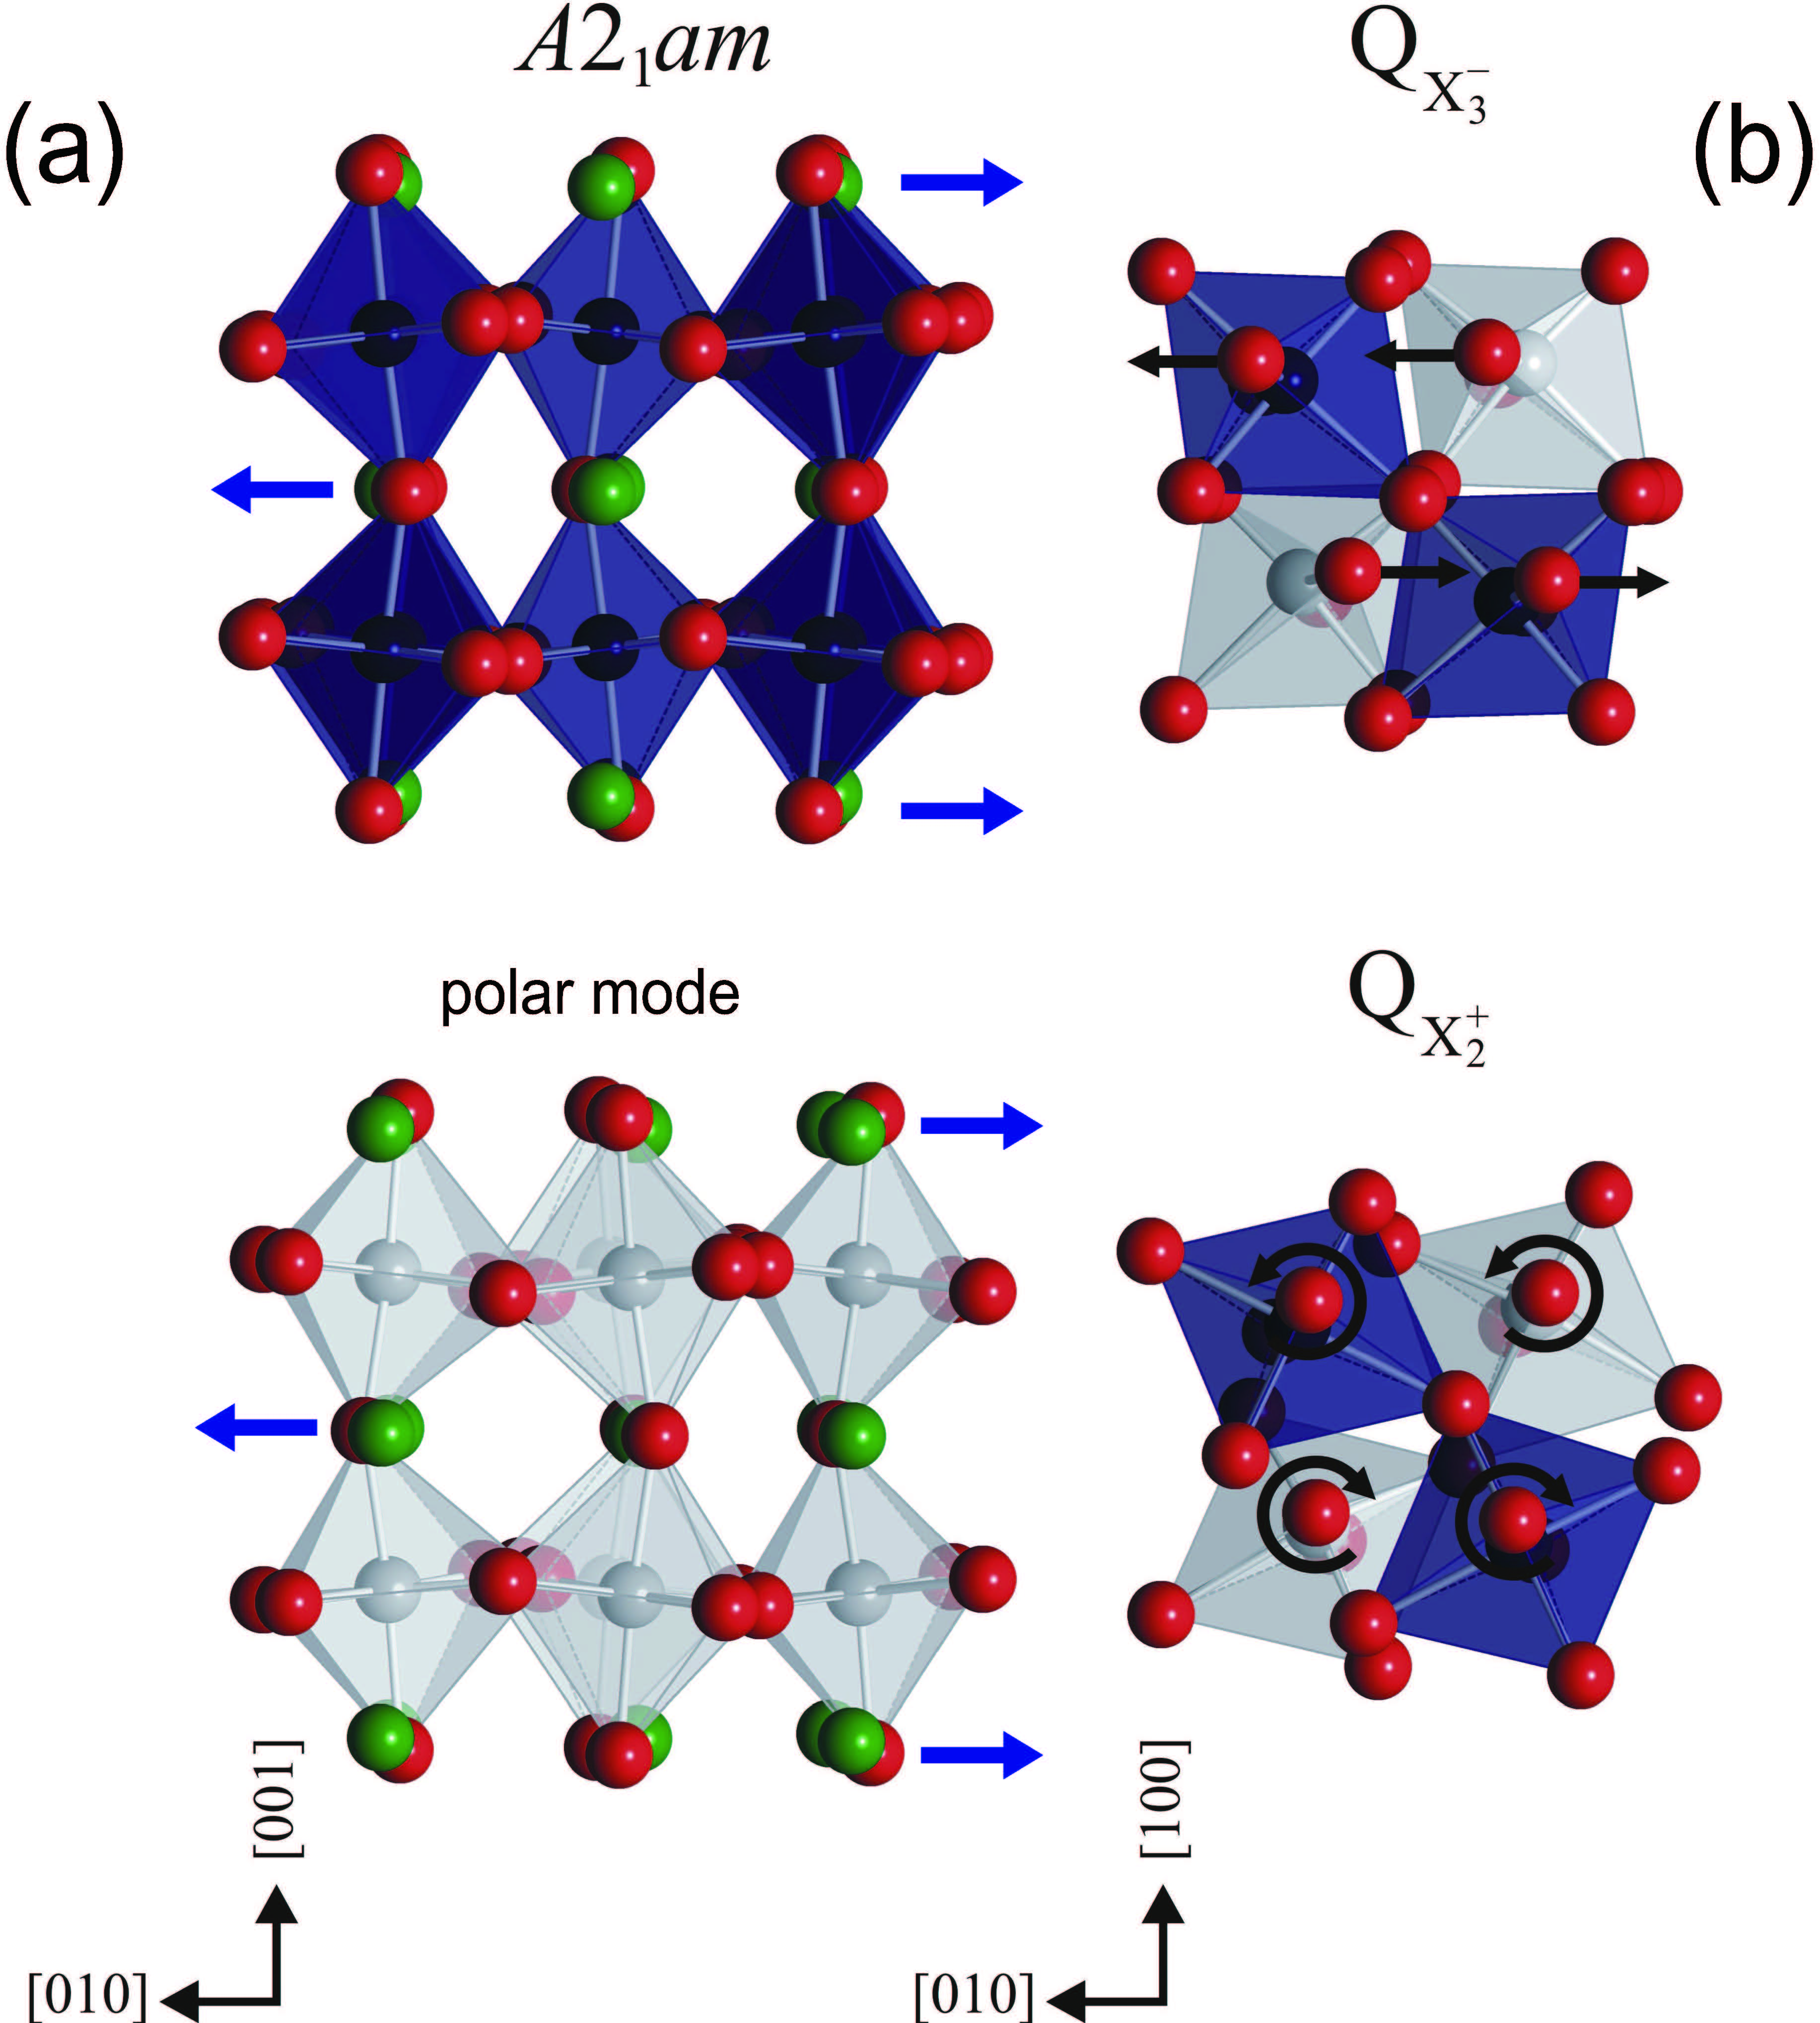
Noteworthy is that the intermediate symmetry is generated by an out-of-phase rotation () of the MnO6 octahedra from the undistorted symmetry. In contrast, the ferroelectric phase below room temperature is associated with the hybridized distortions of the rotation in the plane and the octahedral tilt in the plane. The transition pathway from through to symmetries results in the competition of the out-of-phase and in-phase rotations, thereby bringing about peculiar physical phenomena. Unlike the isostructural Ca3Ti2O7, on the one hand, a polarization is not switchable due to the formation of 90∘ ferroelastic domains stacked alternately along the axis Gao . On the other hand, uniaxial negative thermal expansion, resulting from symmetry trapping of the soft T mode, is observed only in the phase Senn15 ; Senn16 . Thus, tracing the tilt and rotation modes through the phase transitions is indispensable for the in-depth understanding of the HIF of Ca3Mn2O7.
In this paper, we report a successful observation of the soft octahedral tilt and rotational modes in Ca3Mn2O7 using polarization-resolved Raman spectroscopy. The salient finding is that the antiphase octahedron tilting mode undergoes a giant softening upon heating towards , while the rotational mode experiences a small softening. In the intermediate phase, we further find coexistence of the competing soft modes belonging to distinct phases, which is a main cause of ferroelectric, magnetic, and lattice anomalies.
II Experimental Details
Single crystals of Ca3Mn2O7 were grown using a floating zone method Gao . For Raman experiments, samples with dimensions of were installed in an evacuated closed-cycle cryostat at K. The incoming light was normal to the surface as well as parallel to the axis for the polarized Raman scattering experiment. The scattered spectra were collected in (quasi)backscattering geometry and were dispersed by a triple spectrometer (Dilor-XY-500) and a micro-Raman spectrometer (Jobin Yvon LabRam) equipped with a liquid-nitrogen-cooled CCD detector. The laser beam ( mW) was used to avoid the local heating of the sample. For the resonance Raman spectra, both solid-state lasers and an Ar-Kr ion laser with the excitation lines of nm were employed.
III Lattice-dynamical calculations
| Atom | X() | Y() | K(eV/) | Atomic pair | A(eV) | C(eV) | |
| Ca | 2 | 0 | 0 | Ca-O | 1090.4 | 0.3437 | 0 |
| Mn | 4 | 0 | 0 | Mn-O | 1345.15 | 0.324 | 0 |
| O | 0.862 | -2.862 | 74.92 | O-O | 22764.3 | 0.149 | 27.88 |
For the low- space group, the factor group analysis yields the total irreducible representation for Raman-active modes: . In this study, the intermediate phase is assumed to have the symmetry. The total irreducible representation of Raman-active modes for the space group is given by . For the high- space group, the Raman-active modes are factored as .
In order to assign the symmetries and eigenvectors to the observed phonon peaks, we computed the -point phonon modes using shell-model lattice dynamical calculations implemented in the general utility lattice program (GULP) package. In the simple shell model, an ion consists of a point core, carrying the total mass of the ion with charge , and a massless shell with charge , representing the outer valence electrons. The core and shell are coupled by a harmonic spring with a force constant . The parameter is related to the ionic polarizability . The interionic interactions between Ca, Mn, and O ions are described by a combination of long-range Coulomb potentials and short-range Born-Mayer-Buckingham potentials between ions and :
where and denote the strength and the range of the repulsive interaction, respectively, and describes an attractive part with the interatomic distance . With a well-documented set of data, the shell-model parameters are optimized to reach reasonable agreement with experimental Raman data Lewis ; Sherwood . The resulting shell-model parameters are summarized in Table I.
IV Results and discussion
IV.1 First-order phonon excitations
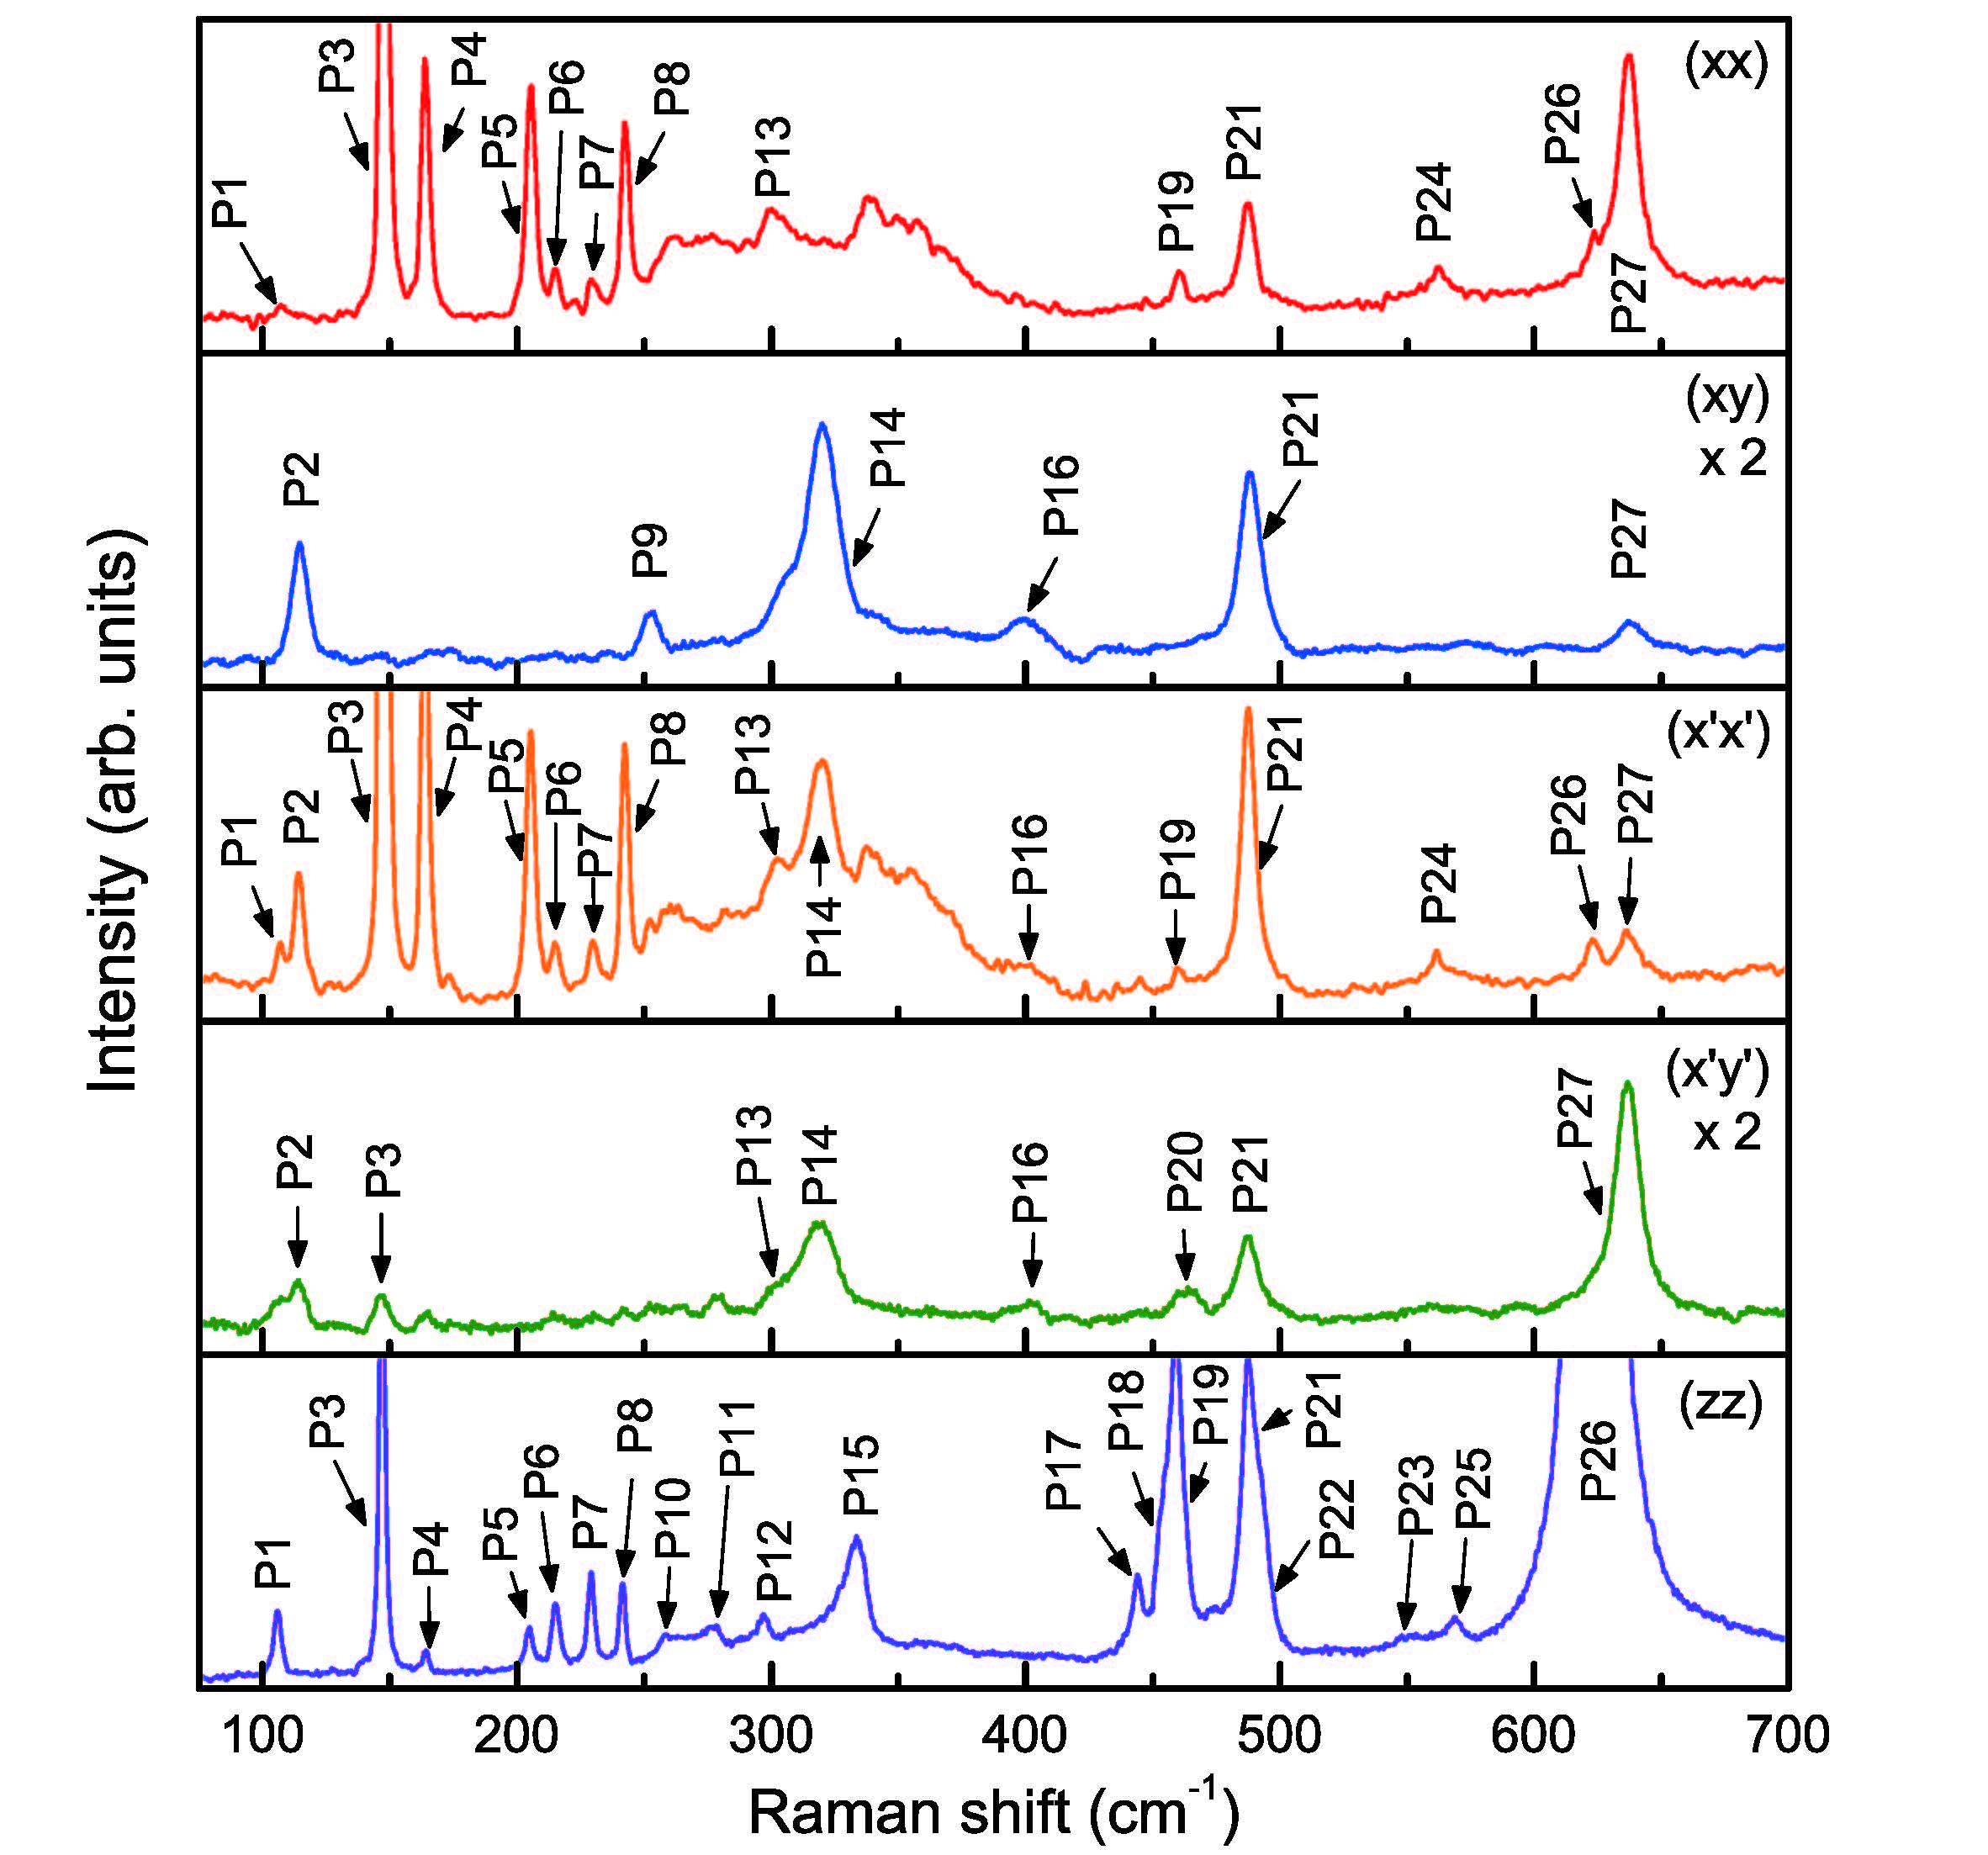
Figure 2 presents the polarized Raman spectra of Ca3Mn2O7 measured at K in five different [(), (), (), () and ()] polarizations. Here, and correspond to the directions along the Mn-O bonds, and corresponds to the out-of-plane direction. and are rotated in-plane by 45∘ with respect to and . These scattering geometries allow probing mainly the and symmetry modes expected for the orthorhombic space group.
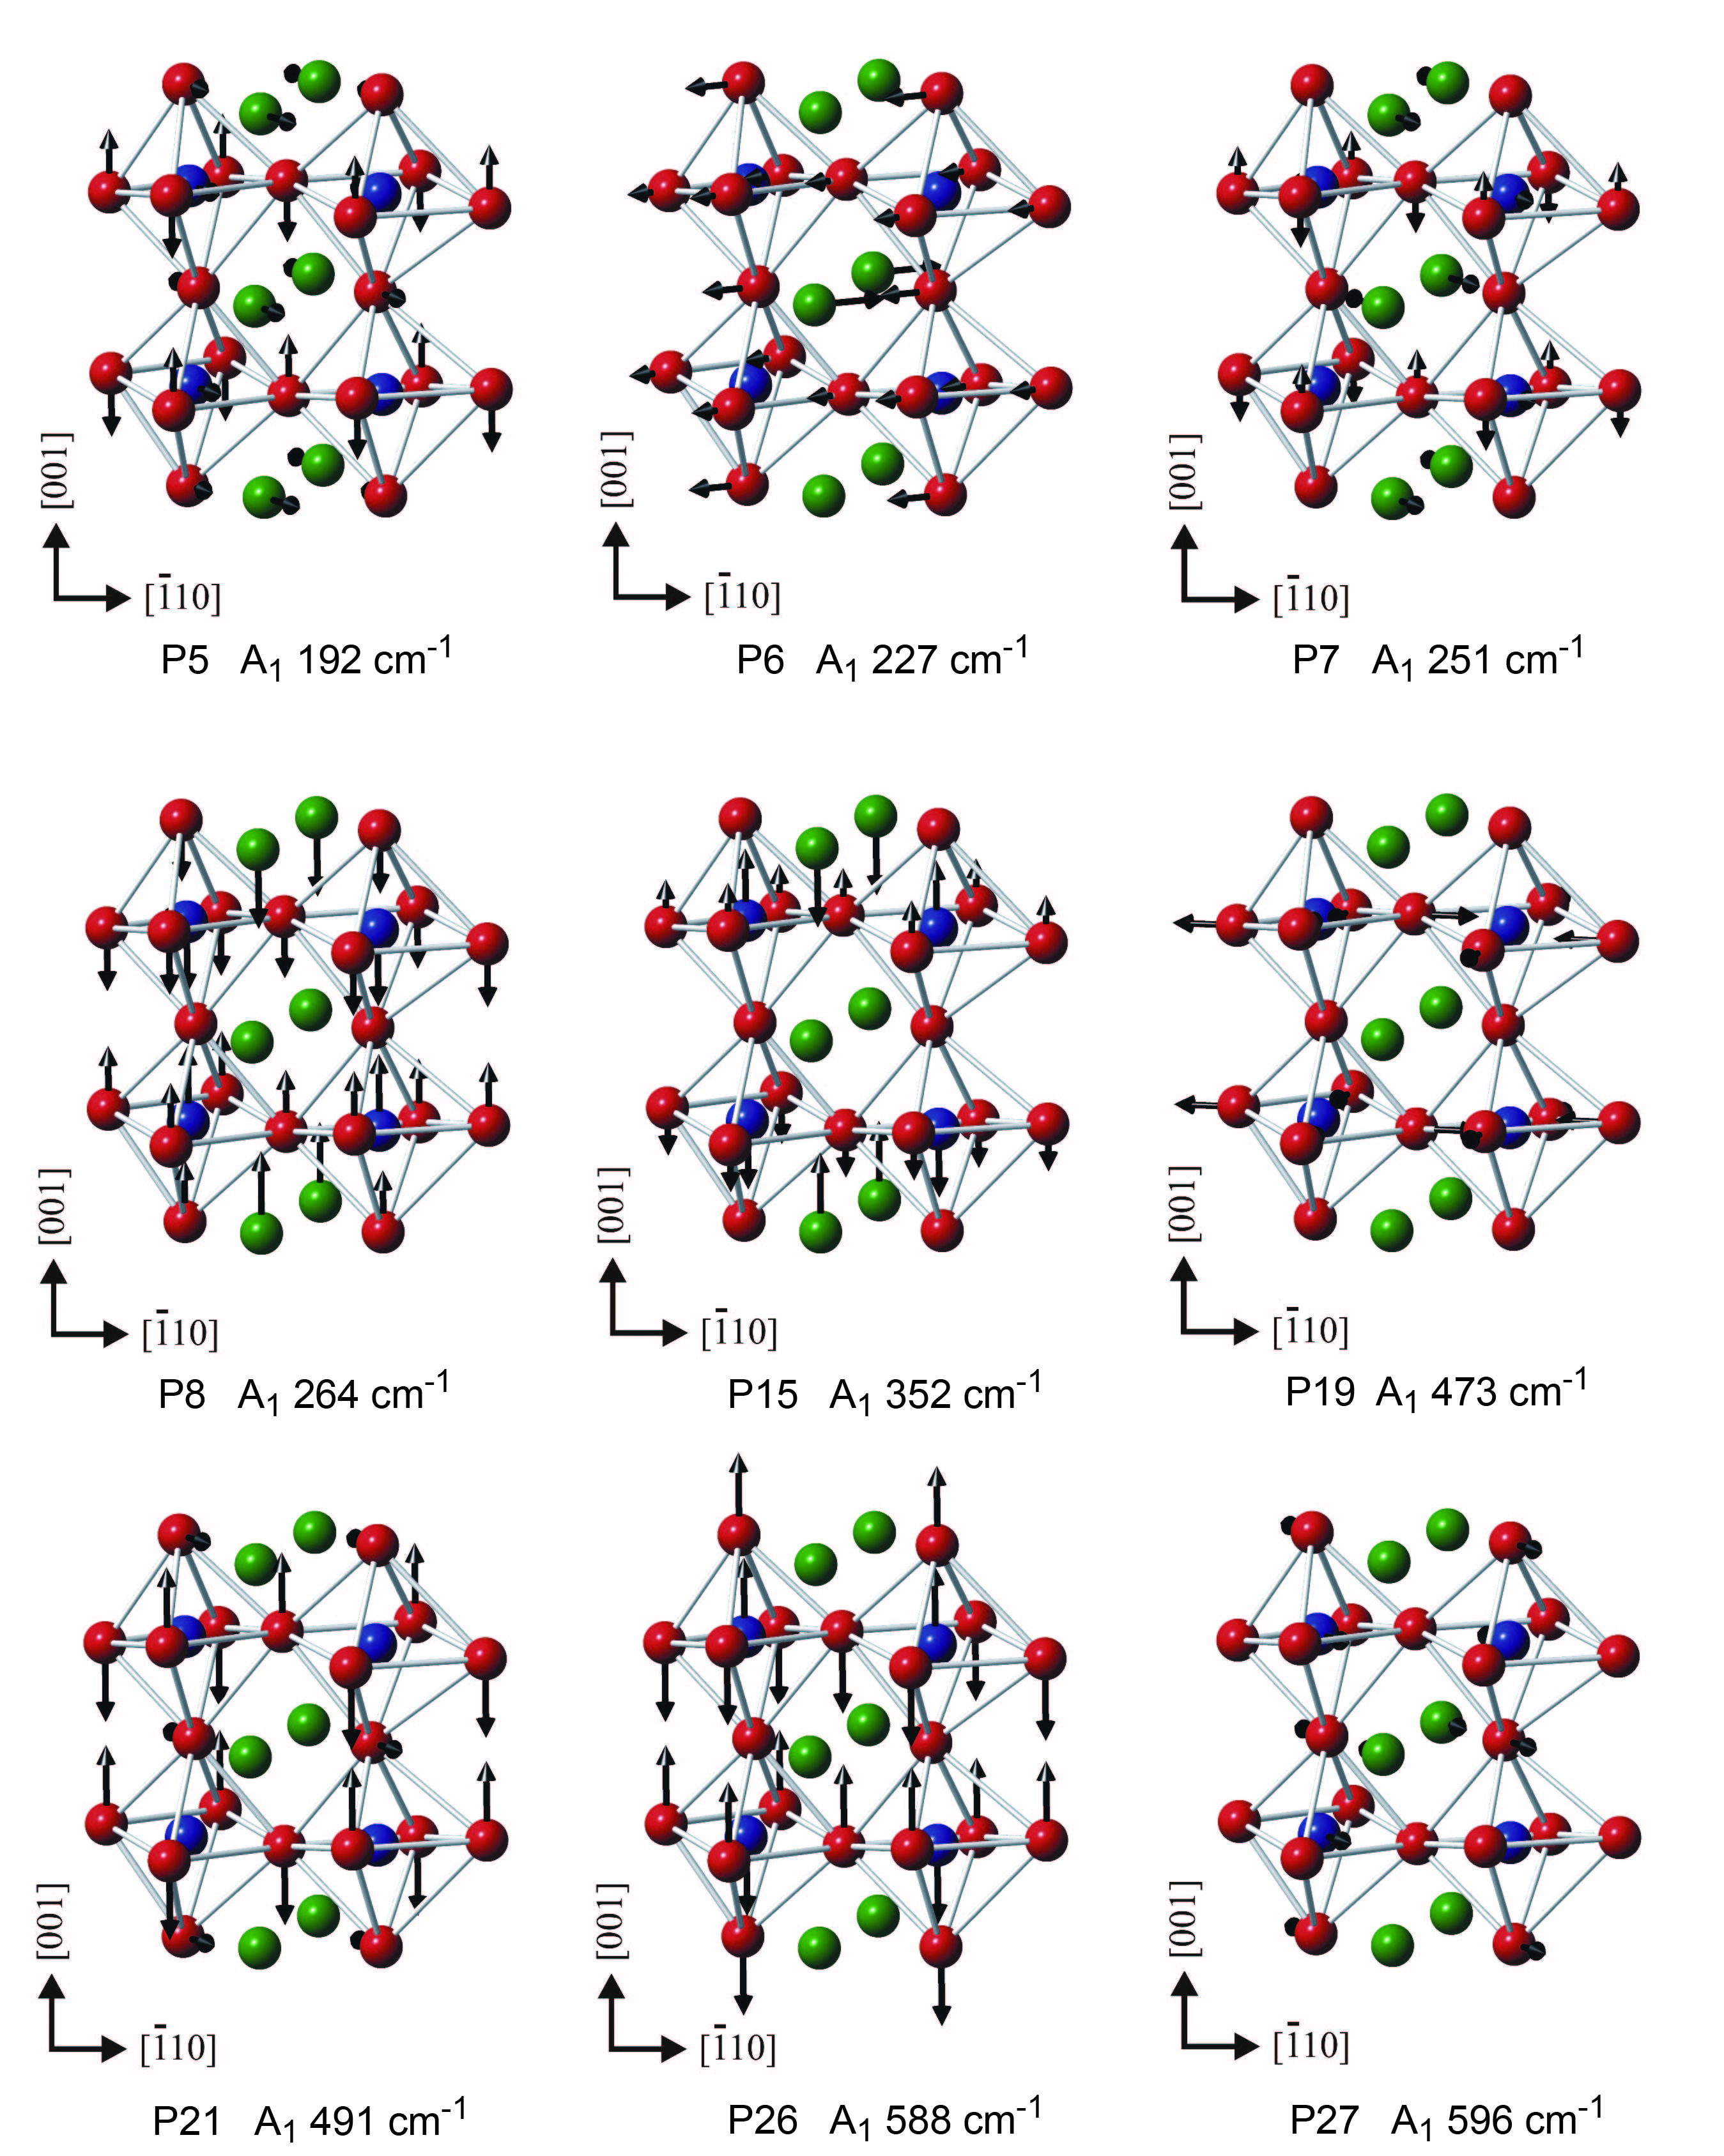
Below 630 cm-1 we were able to resolve ( + ) one-phonon modes, which are smaller than the 35 Raman-active modes predicted for the structure in the selected polarizations, . Assigning the observed phonon modes to the specific symmetry is made on the basis of the polarization-dependent Raman spectra and the lattice-dynamical calculations with the implementation of the Bilbao Crystallographic Server Kroumova (see Sec. III and Table II). The missing modes are ascribed to either a lack of phonon intensity or their overlap with other phonon excitations. In addition, we observe the weak symmetry-forbidden ( + ) phonon modes possibly due to either a leakage of a polarizer or a slight tilting of the aligned crystal toward the axis. The spectra were fitted using a set of Lorentz functions. The extracted frequencies of the Raman-active optical phonon modes are listed in Table II. The calculated and experimental phonon energies agree well with each other. The representative displacement patterns for the modes are sketched in Fig. 3.
| Mode | Exp. | Cal. | Selection rule | Assignment |
|---|---|---|---|---|
| P1 | 107 | 113 | (),(),() | A1 (MnO6 out-of-phase tilting; Ca(2) in-phase motions in the plane) |
| P2 | 114 | 133 | (),(),() | A2 (MnO6 bending in the plane) |
| P3 | 150 | 136 | (),(),(),() | A1 (MnO6 in-phase rotation about the axis) |
| P4 | 164 | 172 | (),(),() | A1 (MnO6 in-phase bending; Ca(1)+Ca(2) out-of-phase motions along the axis) |
| P5 | 205 | 192 | (),(),() | A1 (MnO6 bending; Ca(1)+Ca(2) in-phase motions along the axis) |
| P6 | 215 | 227 | (),(),() | A1 (MnO6 stretching; Ca(1) motions in the plane) |
| P7 | 230 | 251 | (),(),() | A1 (MnO6 out-of-phase rotation; Ca(1)+Ca(2) stretching in the plane) |
| P8 | 242 | 264 | (),(),() | A1 (MnO6 stretching; Ca(2) out-of-phase motions along the axis) |
| P9 | 253 | 274 | () | A2 (MnO6 stretching; Ca(1)+Ca(2) stretching along the axis); |
| 276 | () | A2 (MnO6 bending; Ca(2) stretching along the axis) | ||
| P10 | 260 | 282 | () | A1 (MnO6 in-phase bending; Ca(1)+Ca(2) in-phase motions in the plane) |
| P11 | 278 | 300 | () | B2 (MnO6 in-phase bending; Ca(1)+Ca(2) in-phase motions in the plane) |
| P12 | 297 | 314 | () | A1 (MnO6 in-phase bending; Ca(2) stretching motions in the plane) |
| P13 | 303 | 328 | (),(),() | A1 (MnO6 in-phase bending in the plane) |
| P14 | 320 | 332 | (),(),() | A2 (MnO6 in-phase bending in the plane) |
| 344 | (),(),() | A2 (MnO6 in-phase bending in the plane; Ca(1) stretching in the plane) | ||
| P15 | 338 | 352 | () | A1 (MnO6 out-of-phase stretching; Ca(2) out-of-phase motions along the axis) |
| P16 | 400 | 410 | (),(),() | A2 (MnO6 bending; Ca(1) motions along the axis) |
| P17 | 444 | 469 | () | B1 (MnO6 and Ca(2) stretching vibrations) |
| P18 | 454 | 470 | () | B1 (MnO6 and Ca(2) stretching motions in the plane) |
| P19 | 459 | 473 | (),(),() | A1 (MnO6 stretching in the plane) |
| P20 | 465 | () | two-phonon mode | |
| P21 | 488 | 491 | (),(),(),(), () | A1 (MnO6 bending ) |
| P22 | 492 | 502 | () | B2 (MnO6 bending; Ca(1)+Ca(2) out-of-phase stretching) |
| P23 | 551 | 525 | () | B1 (MnO6 bending in the plane) |
| P24 | 562 | 556 | (),() | B1 (MnO6 bending ) |
| 571 | (),() | B1 (MnO6 bending; Ca(2) out-of-phase motion along the axis) | ||
| P25 | 568 | 581 | () | B1 (MnO6 bending along the axis; Ca(2) out-of-phase motion along the axis) |
| P26 | 623 | 588 | (),(),() | A1 (MnO6 out-of-phase bending in the plane) |
| P27 | 637 | 596 | (),(),(),() | A1 (MnO6 bending in the plane; Ca(1)+Ca(2) in-phase stretching) |
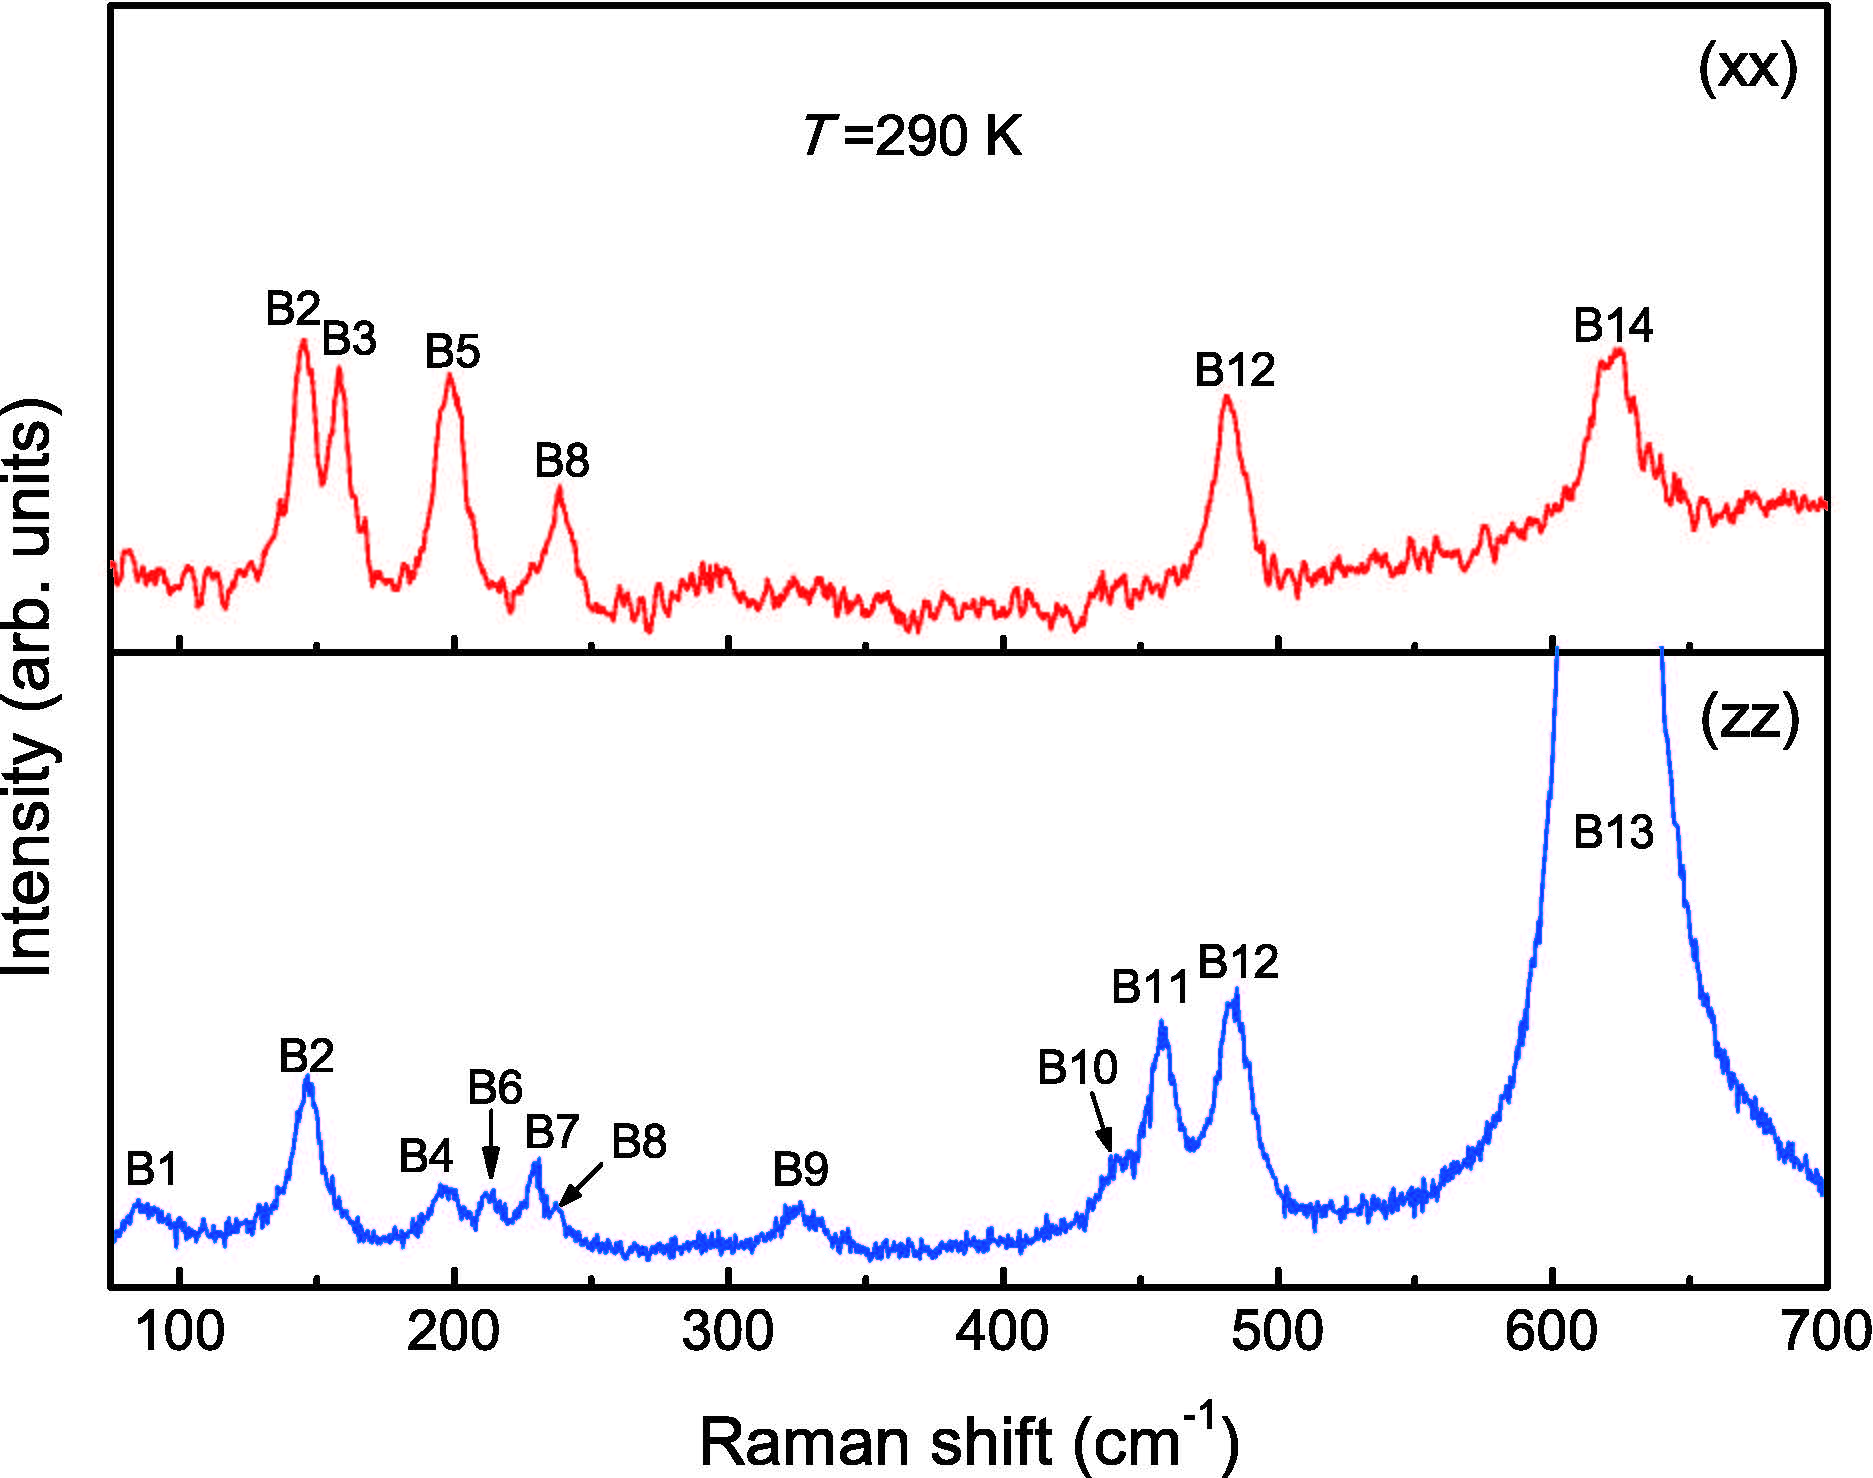
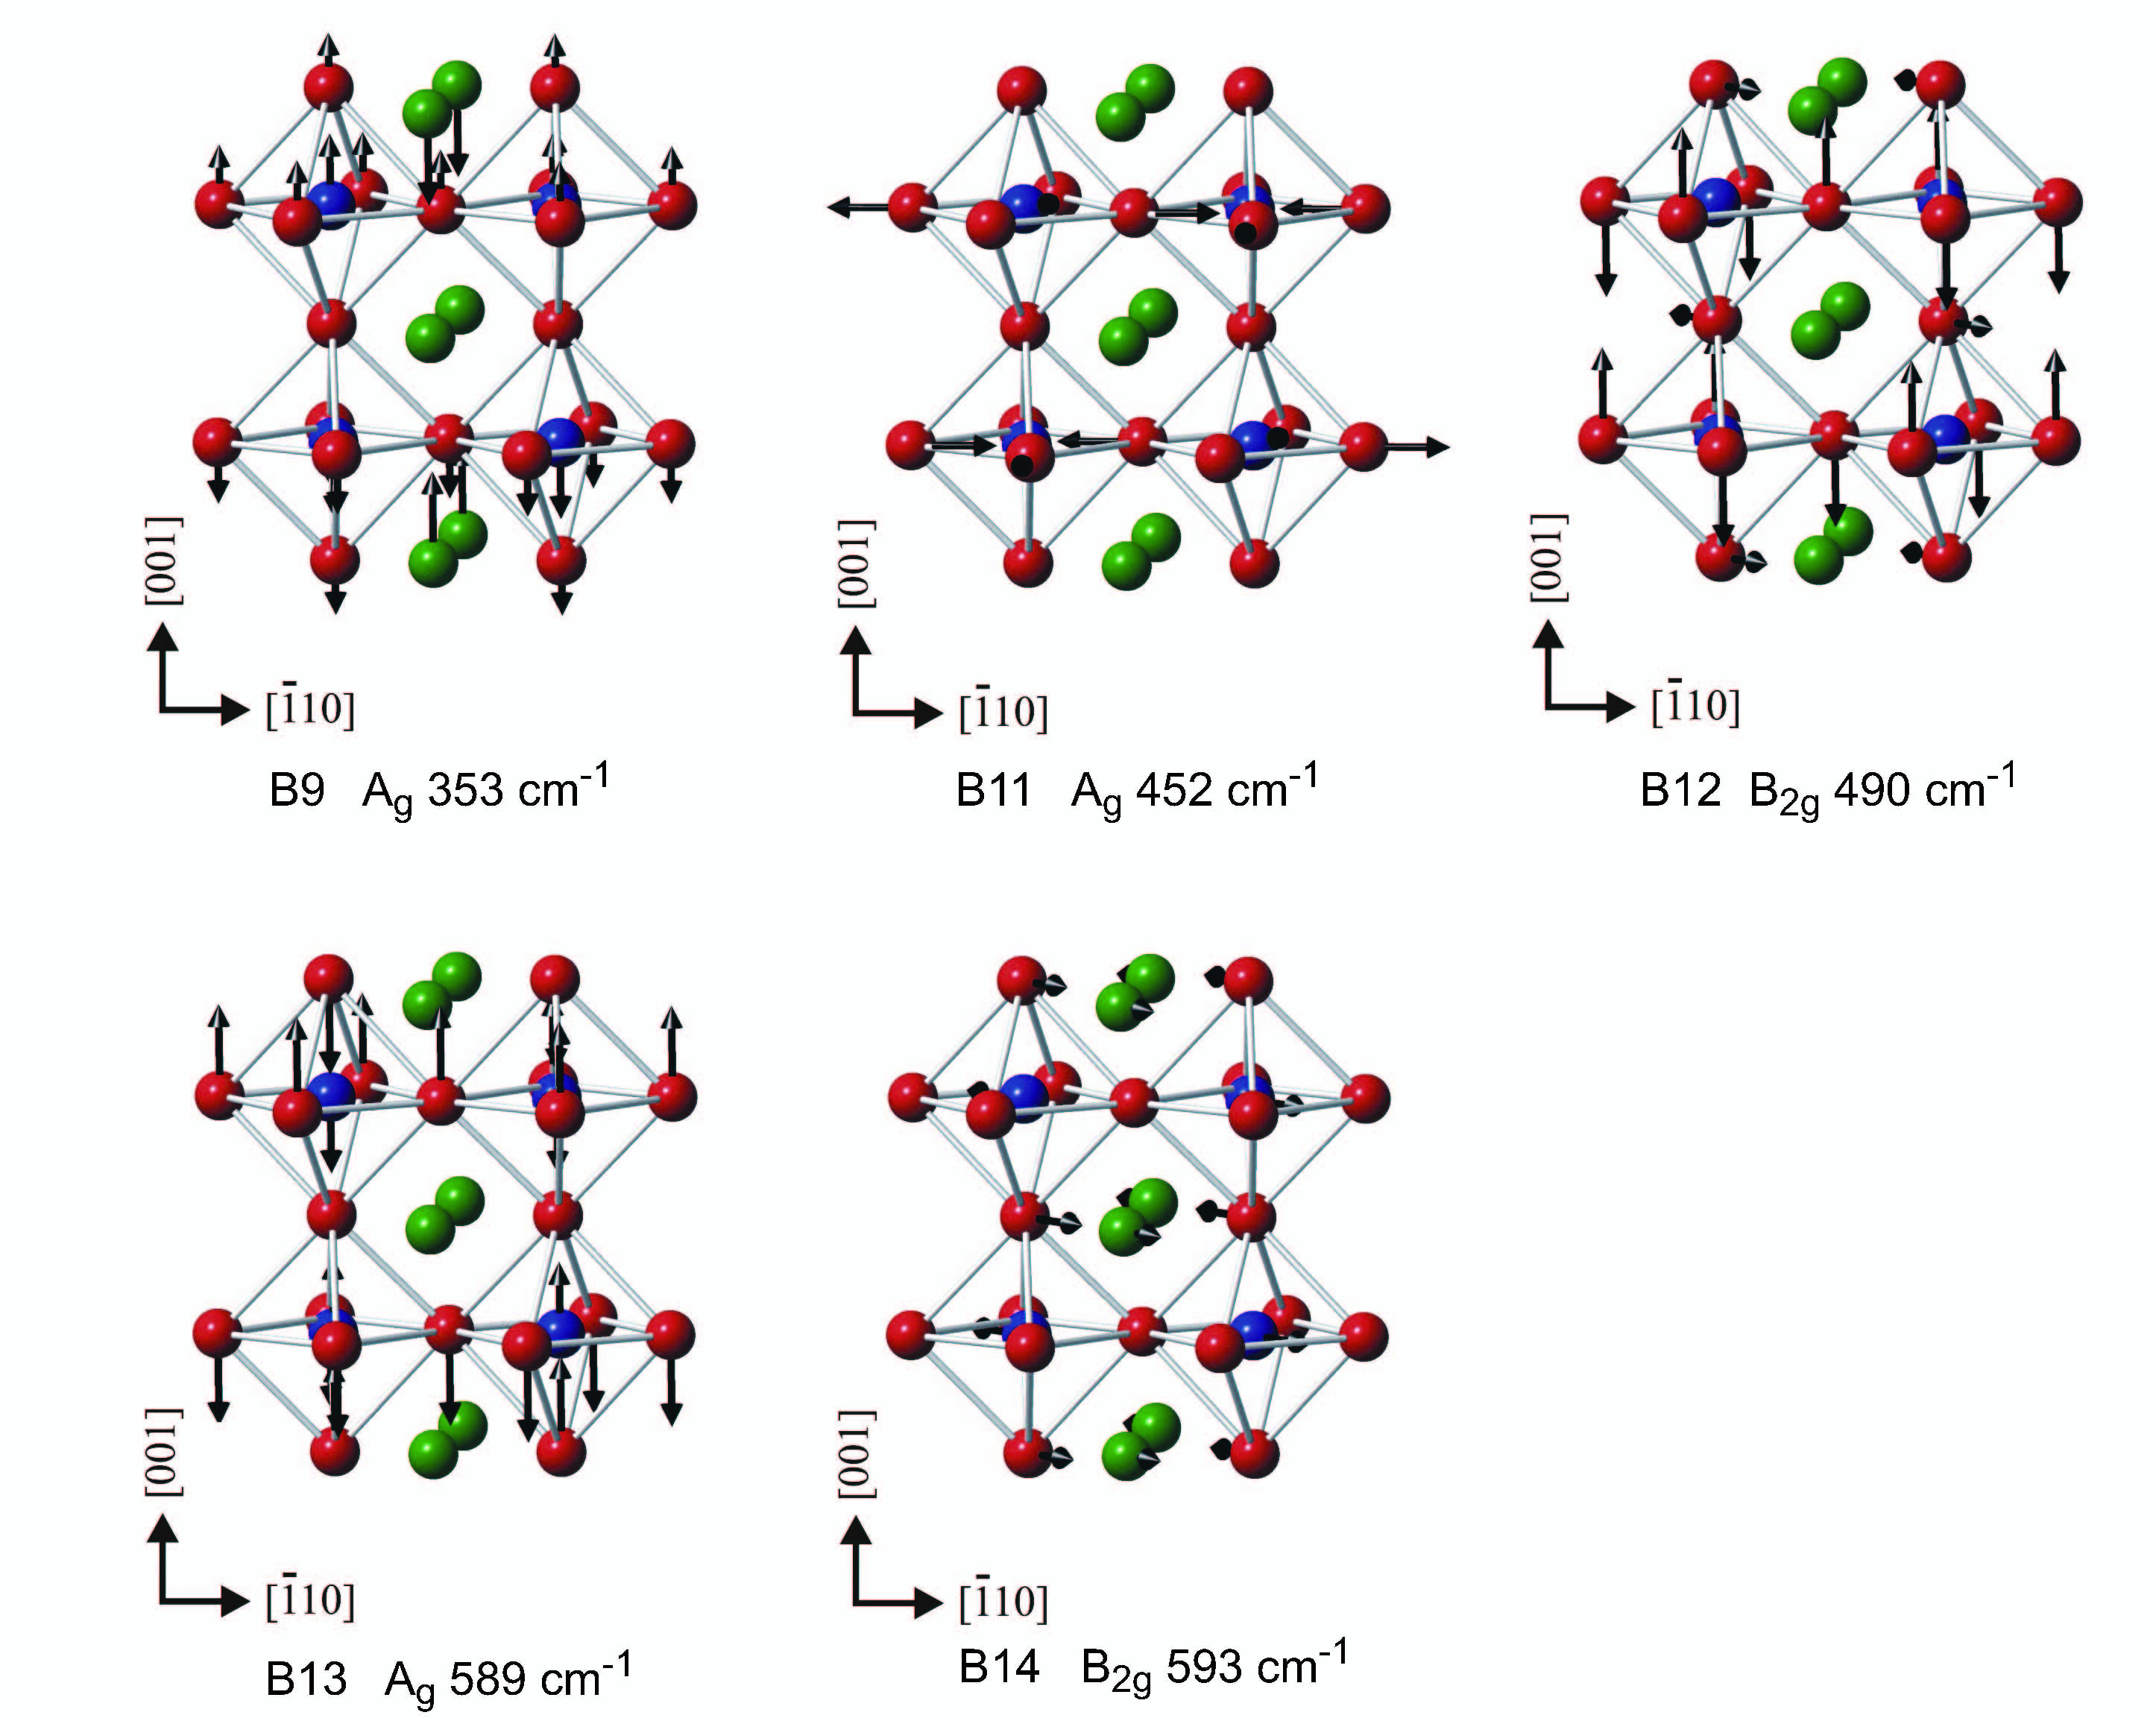
We next turn to the polarized Raman spectra of the intermediate phase recorded in () and () polarizations at K. As shown in Fig. 4, we observe 14 one-phonon modes. The observed phonon number is between the 18 Raman-active modes predicted for the symmetry and the 6 Raman-active modes predicted for the space group. This result is consistent with the coexistence of the low- () and the intermediate- orthorhombic () phases at room temperature Senn15 ; Lobanov ; Gao . Admittedly, it is almost impossible to assign unambiguously the observed phonon modes according to their symmetries as the phonon energies anticipated for the and the symmetries are nearly degenerate.
For ease of discussion, the phonon modes are tentatively described in terms of the symmetry. As listed in Table III, we identify the ( + + ) modes. We sketch the displacement patterns of the representative normal modes in Fig. 5. In this assignment, the symmetry-forbidden ( + ) modes can arise from local lattice distortions or a small mismatch between the laboratory and the crystal coordinates. In reality, the forbidden modes may originate from the modes of the low- phase, which persist to the intermediate- phase.
| Mode | Exp. | Cal. | Selection rule | Assignment |
|---|---|---|---|---|
| B1 | 85 | 99 | () | B2g (MnO6 out-of-phase tilting; Ca(1)+Ca(2) stretching vibrations in the plane) |
| B2 | 146 | 135 | (),() | Ag (MnO6 out-of-phase rotation about the axis) |
| B3 | 158 | 151 | () | B1g (MnO6 out-of-phase rotation about the axis; Ca(2) stretching along the axis) |
| B4 | 198 | 213 | () | B2g (MnO6 bending in the plane; Ca(2) stretching along the axis) |
| B5 | 199 | 213 | () | B1g (MnO6 bending in the plane; Ca(2) stretching along the axis) |
| B6 | 213 | 215 | () | B1g (MnO6 bending; Ca(1)+Ca(2) in-phase motion along the axis) |
| B7 | 229 | 251 | () | B2g (MnO6 bending; Ca(1)+Ca(2) out-of-phase motion along the axis) |
| B8 | 240 | 258 | (),() | Ag (MnO6 tilting; Ca(1)+Ca(2) out-of-phase motion along the axis) |
| B9 | 325 | 353 | () | Ag (MnO6 out-of-phase stretching; Ca(2) out-of-phase motion along the axis) |
| B10 | 441 | () | mode of the space group | |
| B11 | 458 | 452 | () | Ag (MnO6 out-of-phase stretching motions in the plane) |
| B12 | 483 | 490 | (),() | B2g (MnO6 bending vibrations) |
| B13 | 619 | 589 | () | Ag (MnO6 out-of-phase bending in the plane) |
| B14 | 621 | 593 | () | B2g (MnO6 bending in the plane; Ca(1)+Ca(2) in-phase stretching) |
IV.2 Higher-order Raman scatterings
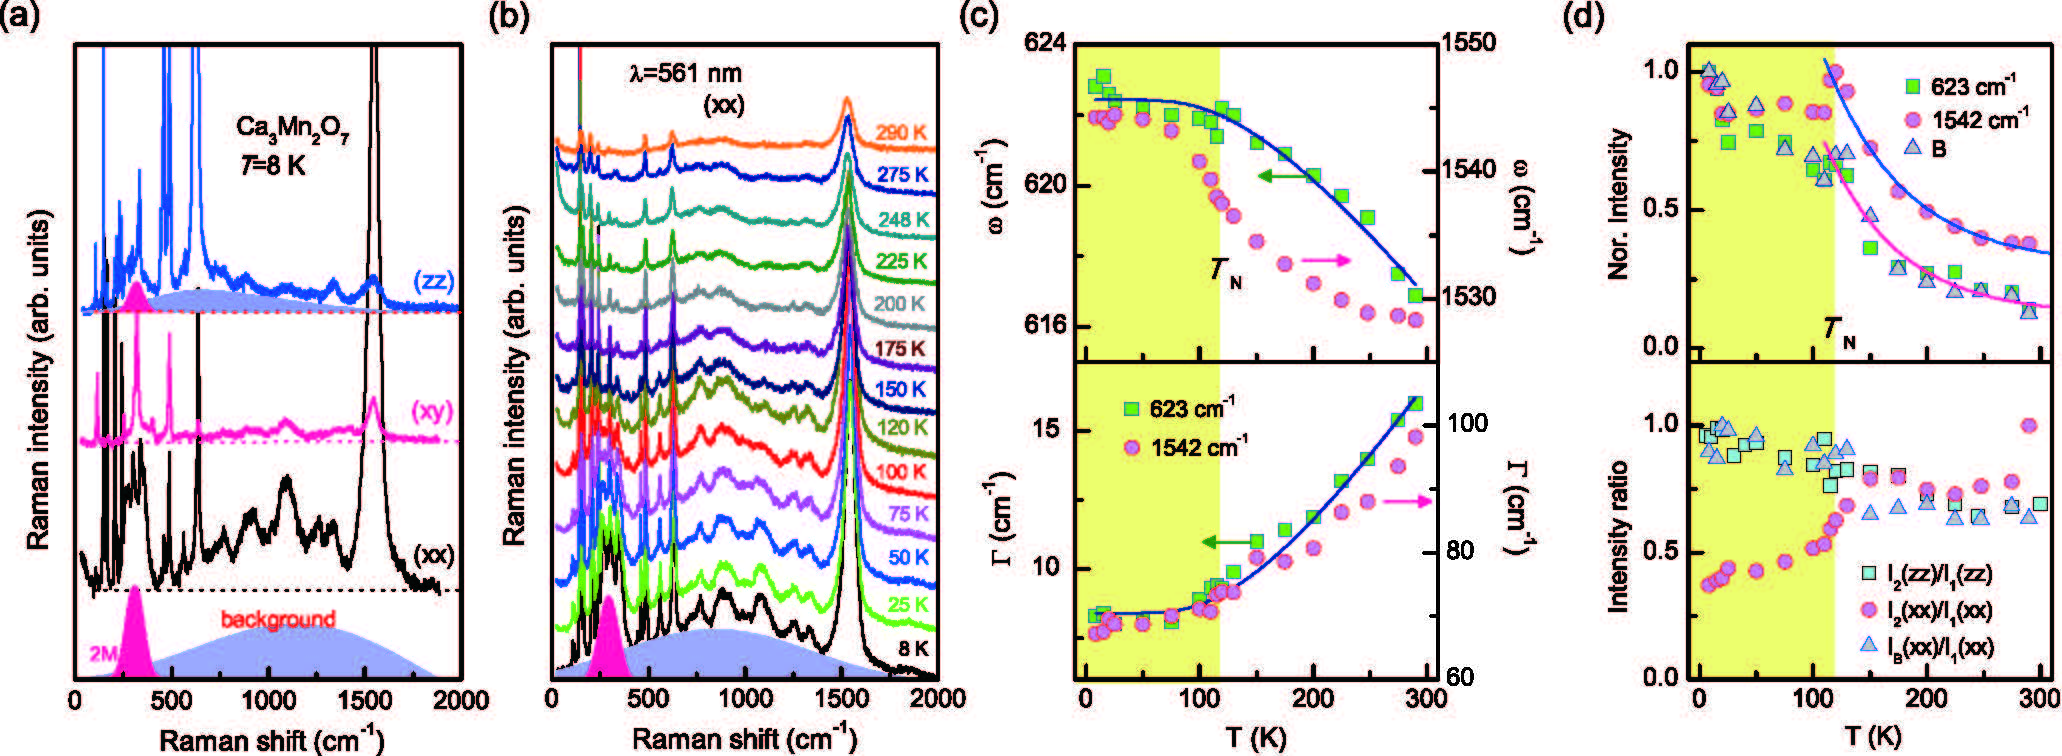
We now focus on the higher-order Raman spectra. Figure 6(a) shows the K Raman spectra of Ca3Mn2O7 taken in a wide frequency range of for (), (), and () polarizations. In addition to the one-phonon modes, we observe the two-magnon (2M) excitation (pink shading) and a dozen higher-order scatterings, which are superimposed on top of the broad background (gray shading). It is remarkable that the higher-order mode at 1542 cm-1 is much more intense than the one-phonon peaks only in the () polarization and the background continuum is anisotropic in its intensity and center position between the () and () polarizations.
Figure 6(b) exhibits the dependence of the () polarized Raman spectra. With increasing temperature, all Raman excitations are drastically suppressed. To quantify their temperature evolution, the Raman spectra are fitted to a sum of Lorentzian profiles. Shown in Fig. 6(c) are the dependences of the frequencies and full widths at half maximum for the representative one-phonon mode at 623 cm-1 and the anomalous higher-order peak at 1542 cm-1. We find that both and of the 623 cm-1 mode, involving stretching vibrations of the MnO6 octahedra, are well described by an anharmonic model [see the solid lines in Fig. 6(c)]. Unlike the one-phonon modes, of the higher-order 1542 cm-1 mode shows a steeper decrease than what is expected for the lattice anharmonicity, starting at . However, exhibits no apparent anomaly.
In Fig. 6(d) we compare the dependence of the normalized intensities of the one-phonon mode, the higher-order peak, and the background continuum. They commonly display an exponential-like decrease as the temperature is raised above [see the solid lines in Fig. 6(d)]. In insulating materials, the phonon intensity is highly susceptible to changes in the dielectric function with respect to the displacement of the normal mode. In contrast, the variation of penetration depth and scattering volume with temperature gives minor contributions. Thus, the exponential drop of above suggests that the dielectric function strongly varies as soon as the magnetic order disappears. Noticeably, the and modes start to soften at , and the extracted empirical energy K is comparable to the frequency of the soft T mode (see Sec. IV. E and Fig. 9 below).
In the bottom panel of Fig. 6(d), we present the ratio of the higher- to first-order scattering intensity. For the () polarization, undergoes a steplike increase with increasing temperature through , while for the () polarization, it decreases monotonically. The opposite polarization dependence of indicates that the higher-order scattering arises from a resonant optical excitation of 2.2 eV (see the following Sec. IV. C) and that an electric state is anisotropic between the in- and out-of-plane directions. A closer look at the higher-order modes reveals that an integer multiple or combination of first-order phonon energies cannot reproduce higher-order peaks. For instance, the energy of the 1542 cm-1 peak corresponds to 2.47 times the one-phonon frequency at 623 cm-1. This points towards a hybrid nature of the 1542 cm-1 peak. In HIFs, higher-order coupling of multiple degrees of freedom can lead to the vibronic couplings of the multiphonon scatterings to magnon and/or soft phonons. This together with strong lattice instabilities may explain the broad (two)-phonon background ranging from 100 to in terms of a (two)-phonon density of states. The selective temperature, polarization, and incident laser dependences exclude fluorescence as its origin.
IV.3 Resonance Raman scattering
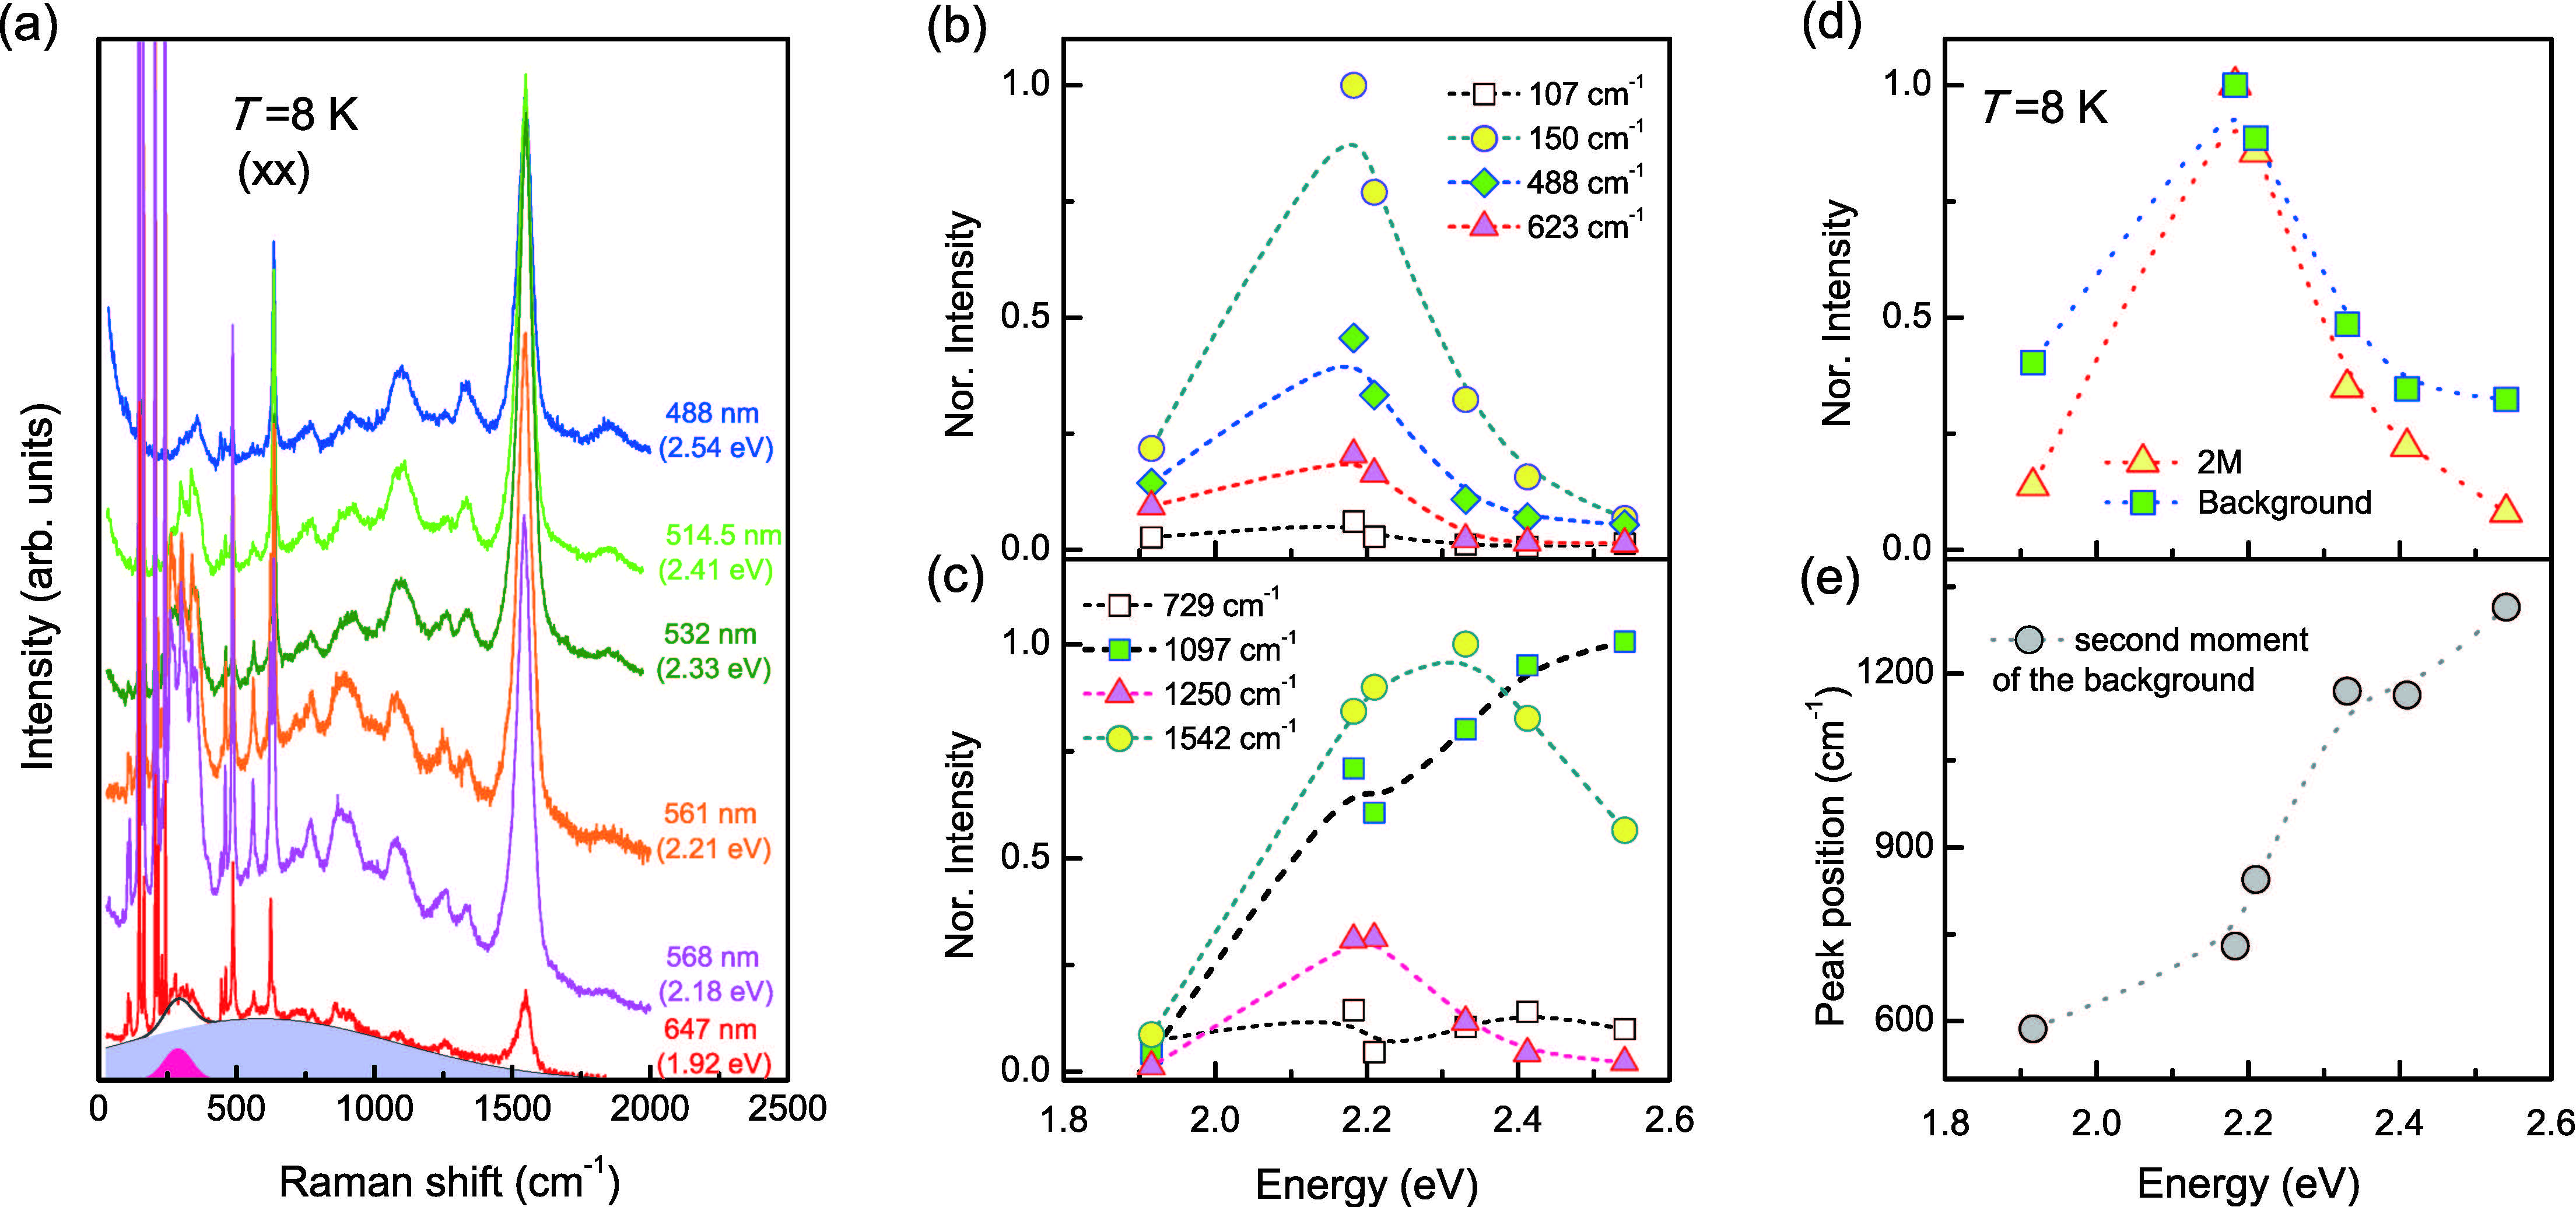
We next discuss resonance behaviors of Ca3Mn2O7. This is a particularly relevant issue because lattice instabilities can give rise to substantial modifications of electronic band structures. Figure 7(a) displays the resonant Raman spectra of Ca3Mn2O7 measured with different wavelengths at K in the () polarization. A large variation of the scattering intensity is observed as a function of the incident laser energies. For an analysis of the resonant behavior, all phonon and magnetic excitations were fitted using a sum of Lorentzian and Gaussian profiles. The resulting intensities versus incident laser energy are plotted in Figs. 7(b)-7(d).
As shown in Fig. 7(b), almost all the first-order phonon modes at 107, 150, 488 and 623 cm-1 are resonant with the excitation energy at around 2.2 eV. This is contrasted by the resonant behavior of the higher-order modes; although the 1250 cm-1 peaks show a resonant profile similar to that of the one-phonon peak, the 729, 1097 and 1542 cm-1 peaks exhibit two selective enhancements at about 2.2 and 2.54 eV [see Fig. 7(c)]. The observed resonant scatterings are ascribed to the spin-allowed electronic transition of Mn4+ ion, 4A2g(4F)-4T2g(4F), the transition 4A2g(4F)-4T1g(4F) and the charge transfer transition O2-() Mn4+() Balykina ; Brik . Figure 7(d) displays the resonant profiles of the magnetic and background continua, which show essentially the same behavior as the one-phonon one. Noticeably, the second moment of the background continuum increases appreciably with increasing excitation energy, while undergoing a steep jump at about 2.2 eV [see Fig. 7(e)]. Overall, our resonant scattering study suggests that the higher-order scatterings are much more selectively enhanced at the 2.54 eV electronic transition than at the 2.2 eV one.
IV.4 Two-magnon scattering
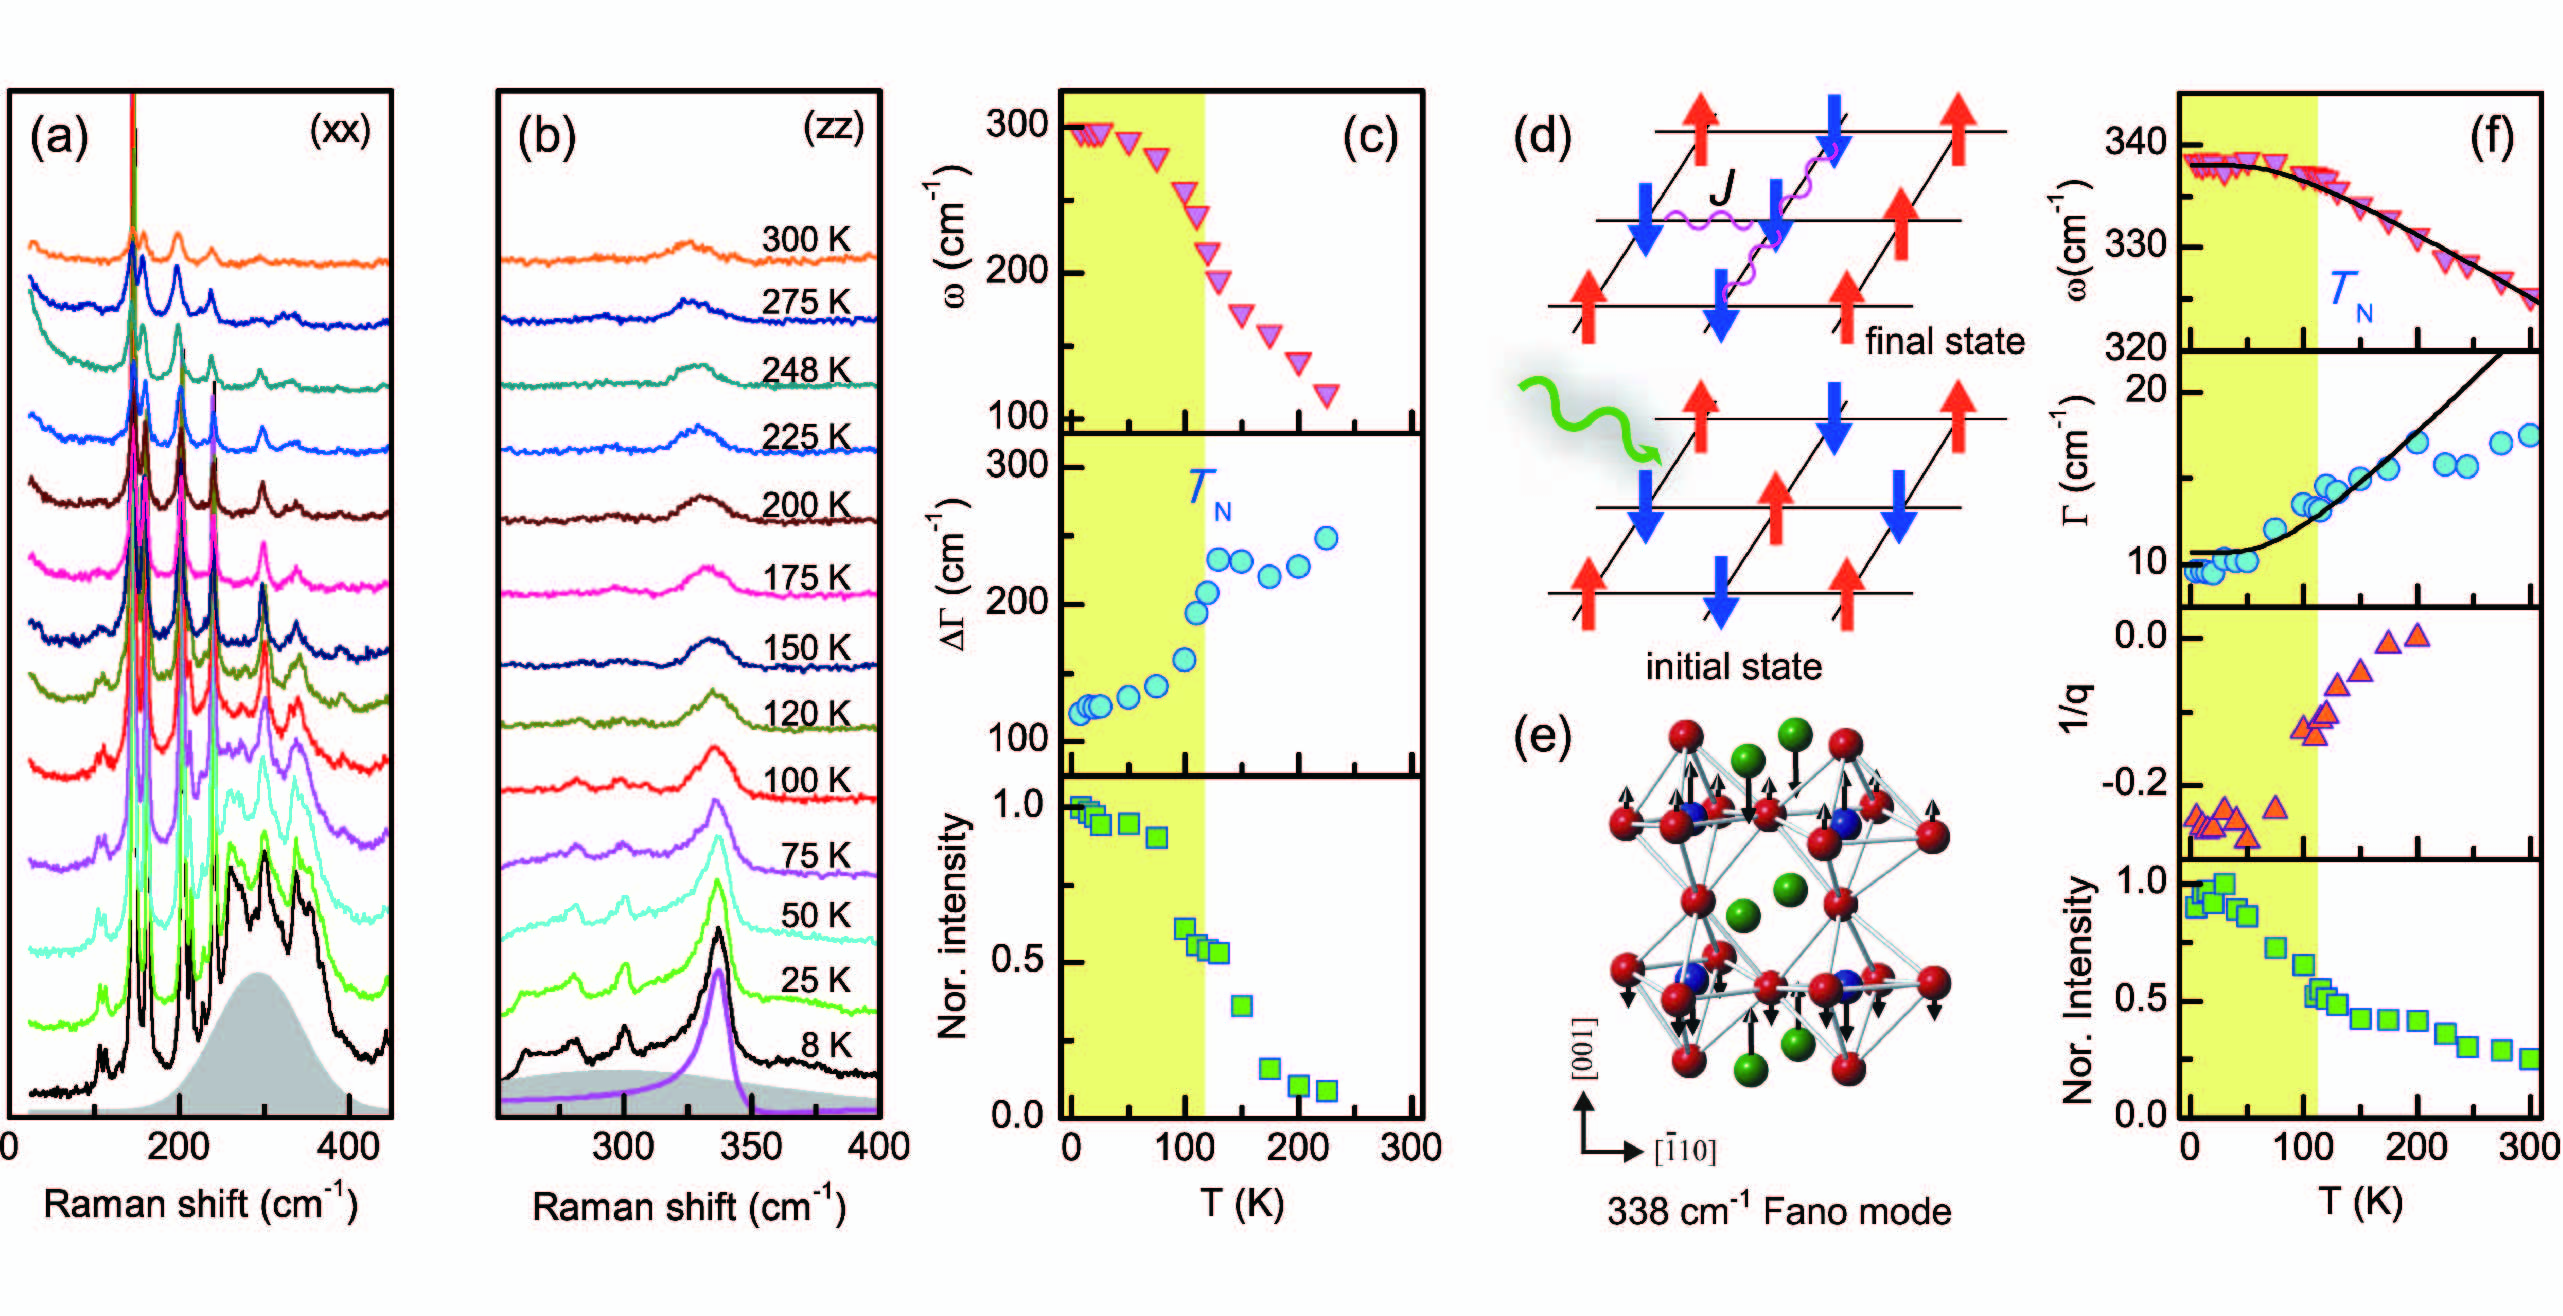
We inspect the 2M scattering arising from double spin-flip processes of a ground state () to a higher state () [see the sketch in Fig. 8(d)] Cottam . As shown in Fig. 8(a), the 2M excitation is observed as a Gaussian-like maximum at about 301 cm-1 in the () polarization. The magnetic excitation is strongly suppressed with increasing temperature through . Figure 8(c) exhibits the dependence of the 2M frequency, FWHM, and intensity. On approaching , the magnon (2M peak) energy is renormalized by 30 % and the magnon lifetime () becomes two times shorter. Compared to the two-dimensional system LaSrMnO4 Choi , Ca3Mn2O7 experiences a stronger thermal damping and renormalization of the magnon despite its apparent smaller spin number. In addition, the 2M scattering does not evolve to a pronounced quasielastic response above unlike conventional 2M excitations, lacking well-defined paramagnons at high temperatures. These anomalies point to the presence of another relaxation channel, possibly due to inherent coupling of the magnetic subsystem to the soft tilt mode. The peak position of the 2M scattering allows the estimation of the exchange coupling constant of the nearest-neighbor Mn spins by the relation , where is the number of nearest-neighbor spins and is the spin number. The value of cm-1 yields K. This is close to the theoretical value of K Matar .
Remarkably, the 2M scattering is also observed with weaker intensity in the () polarization as zoomed in Fig. 8(b). Further evidence for a magnetic continuum is provided by a Fano resonance of the 338-cm-1 mode. The appearance of the 2M excitations in the out-of-plane polarization is totally unexpected for the tetragonal K2NiF4-type antiferromagnets Choi and is linked to the CaMnO3 bilayer structure, leading to significant interlayer interactions. Indeed, Ca3Mn2O7 has the dominant G-type antiferromagnetic ordering of the Mn4+ magnetic moments pointing to the axis Lobanov . The 338 cm-1 symmetry mode involves out-of-phase vibrations of the MnO6 octahedra and the Ca(2) atoms along the axis, as sketched in Fig. 8(e). This mode is fitted using the Fano profile, , where , , , and are the intensity, the bare phonon frequency, the linewidth, and the asymmetric parameter, respectively. In Fig. 8(f), all Fano parameters are plotted as a function of temperature. The dependence of is well described by the conventional anharmonic model. However, deviates for temperatures above 200 K. On heating above 50 K, decreases rapidly toward zero, while the intensity falls off substantially up to and then decreases gradually. The Fano-parameter behaviors lend further support to a quick damping of the magnons above .
IV.5 Soft modes
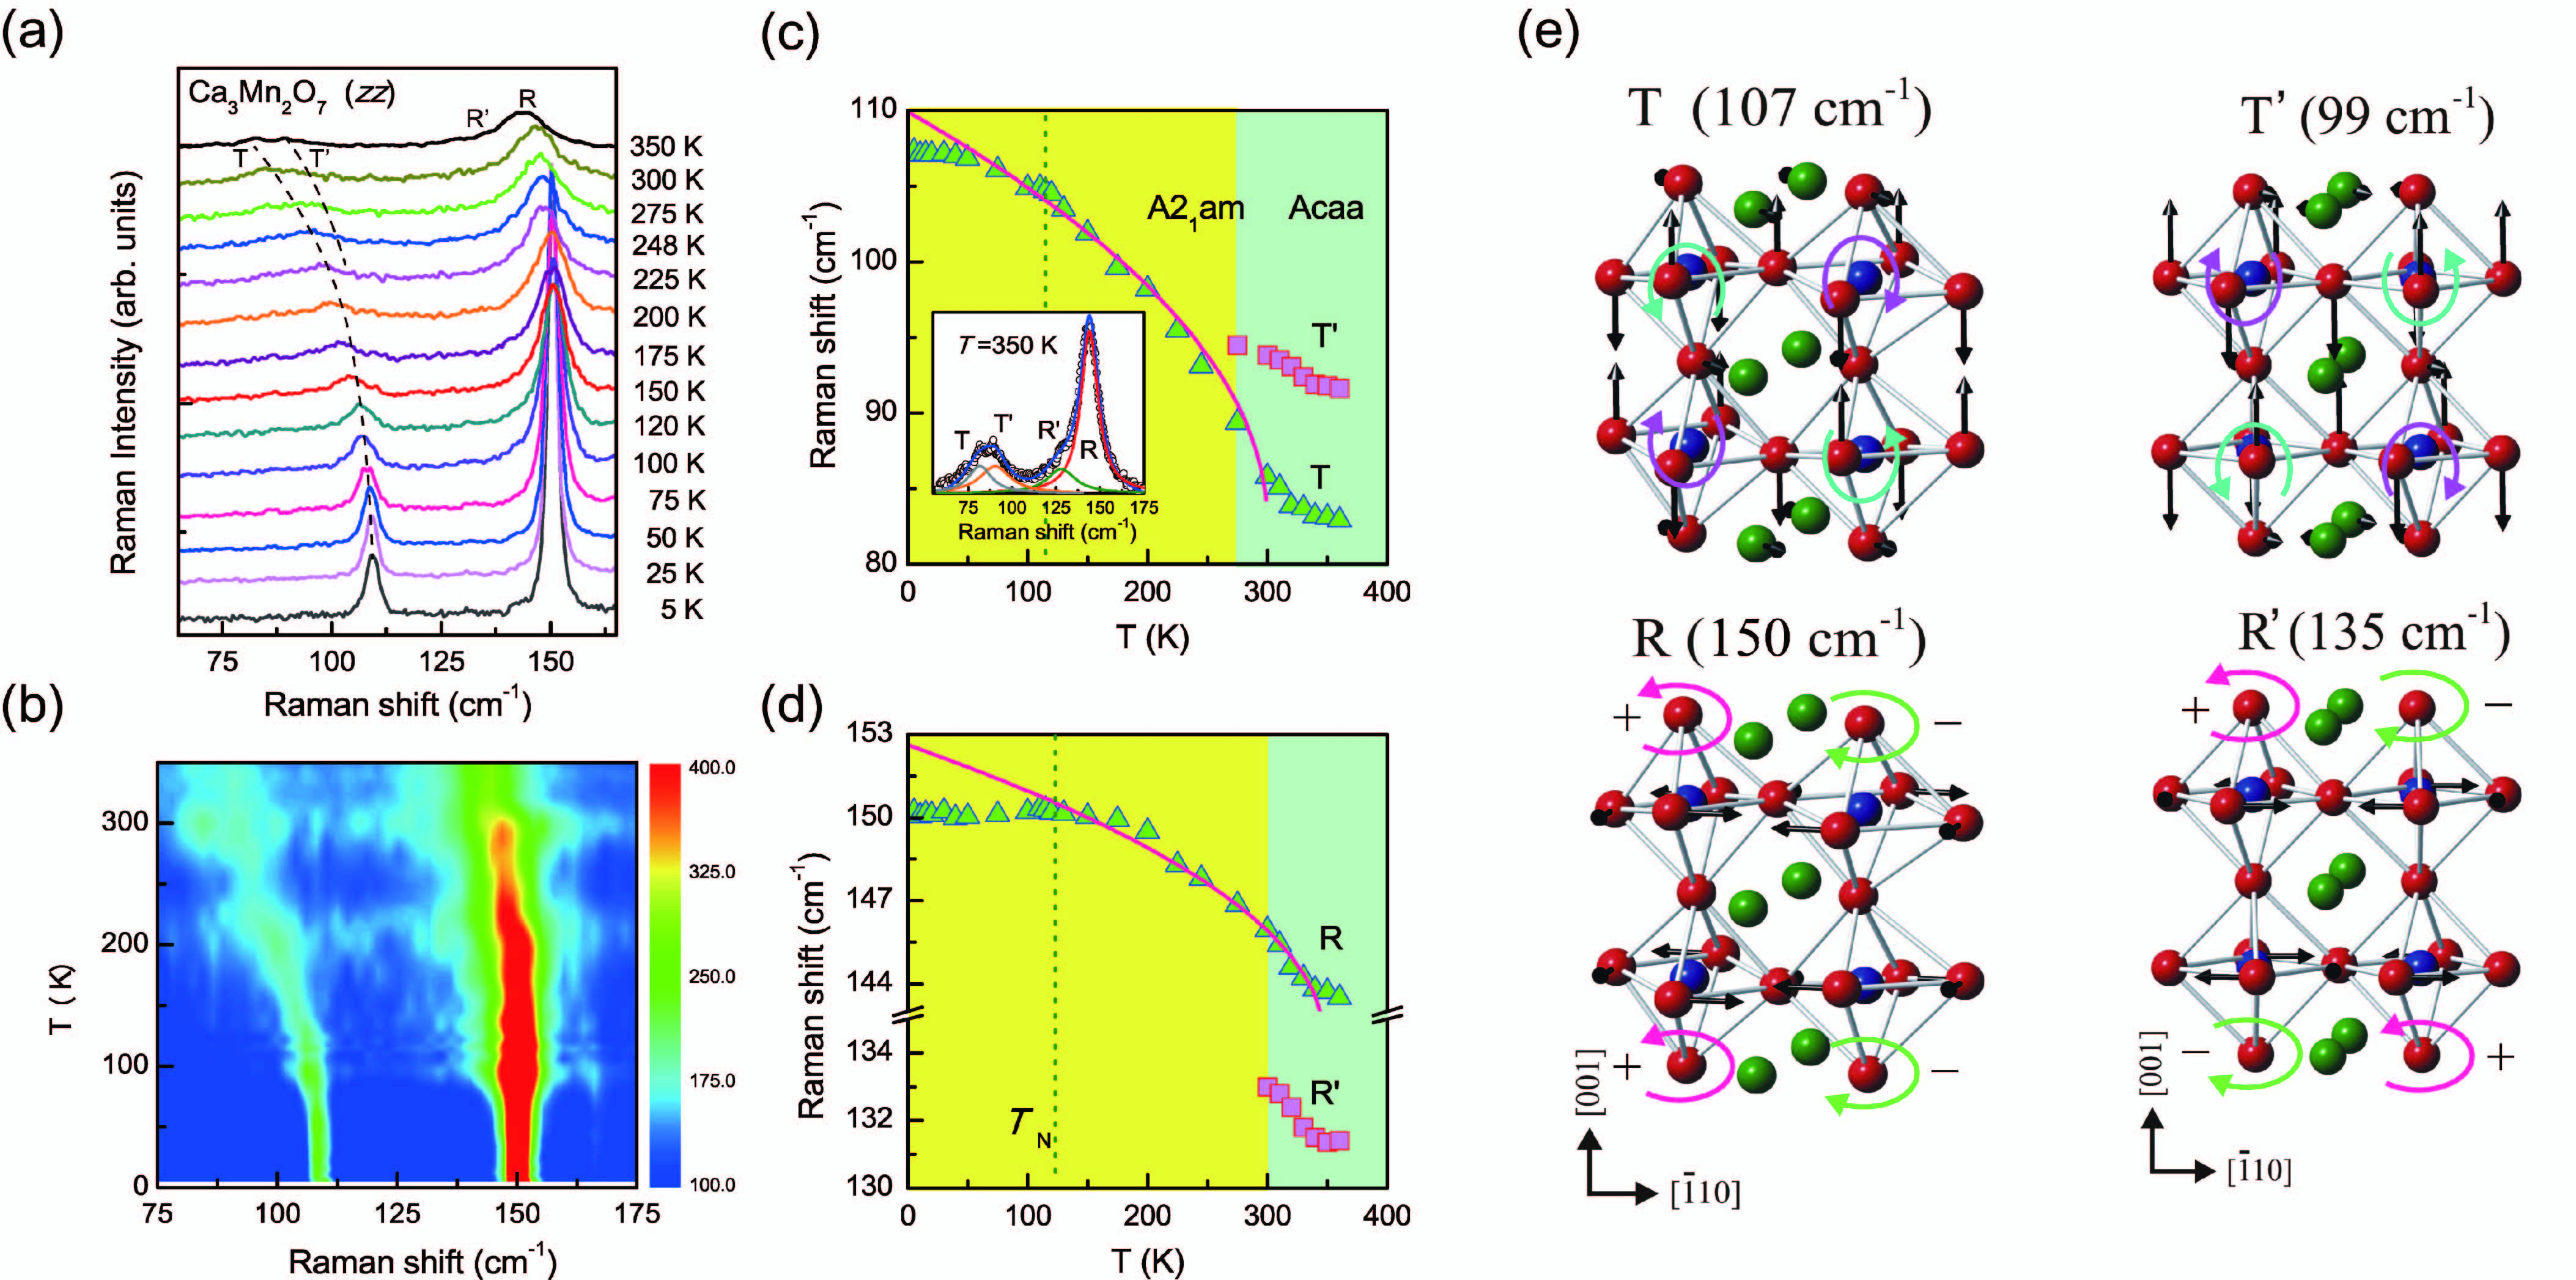
Figure 9(a) zooms in on the two low-frequency phonons at 107 (T) and 150 cm-1 (R) measured on warming. The data were taken in the () polarization in order to separate the T and R modes from other phonon peaks. Based on our lattice dynamical calculation, the 107 cm-1 (150 cm-1) phonon is assigned to the octahedron tilting (rotation) mode whose normal mode displacements are sketched in Fig. 9(e).
With increasing temperature toward the phase, the T (R) mode displays a huge (small) softening by 26 (6) cm-1. For temperatures above 270 K, the T and R modes are split into additional T’ and R’ modes, forming the coexistence regime of the two different orthorhombic phases at least up to 360 K [see the inset of Fig. 9(c)]. This together with the drastic softening of the T mode confirms that the first-order phase transition from the ground state to the intermediate phase is driven by the tilting of oxygen octahedra. Essentially the same conclusion was drawn in a recent neutron and x-ray diffraction study of Ca3Mn1.9Ti0.1O7 that unravels the softness of the antiphase octahedral tilt and robustness of the octahedral rotation Ye . The selective susceptibility of the antiphase tilt mode to the structural transformation is discussed in terms of the decisive role of the partially occupied orbital of the Mn4+ ions in stabilizing the MnO6 distortion. In Fig. 9(b) we show the color contour plot of the soft-mode intensity in the temperature-Raman-shift plane. Upon approaching the structural phase transition, the soft-mode intensities are strongly suppressed.
The frequencies of the T and R modes are shown in Figs. 9(c) and 9(d) in the temperature range of K. Notably, the softening modes do not shift to zero frequency, unlike the zone-center polar soft mode in a proper ferroelectric transition. is described by the mean-field formula . Here, the second constant term accounts for the first-order nature of the structural phase transition. We find a good agreement between the experimental data and the mean-field theory above , confirming the soft-mode driven first-order phase transition. The apparent deviation in the antiferromagnetic ordered state is attributed to strong spin-lattice coupling , leading to a renormalization of the phonon energy by a scalar spin-correlation function .
Last, we pay attention to an alteration of the rotation and tilting displacement patterns through the phase transition from the to the symmetries. Overall, the energies of the tilting and rotational modes between the two phases differ by . This is due to a slightly different pattern of the MnO6 tilting and the rotation distortions between them. The T and T’ modes involve the respective inward and outward tilting of the MnO6 octahedra within the perovskite bilayer, while the R and R’ modes correspond to the in-phase and out-of-phase rotations of the MnO6 octahedra within the perovskite bilayer, respectively [see Fig. 9(e)]. We stress that the intermediate phase is characterized by the coexistence of the soft modes with distinct displacements, which is responsible for the observed non-switchable polarization and uniaxial negative thermal expansion Gao ; Senn15 ; Senn16 . In addition, the competing structural instabilities at the intermediate phase lead to a rapid destabilization of the magnetic excitation, in disfavor of strong magnetoelectric coupling. To achieve simultaneous ferroelectricity and magnetoelectricity, thus, the patterns of octahedral tilt and rotation distortions should be finely controlled through a structural transformation.
V Conclusion
In conclusion, our Raman scattering study of Ca3Mn2O7 has unveiled a set of competing soft modes, which dictate a first-order phase transition from the paraelectric to the ferroelectric orthorhombic phase. The soft rotation and tilt modes are a tuning parameter of all physical properties, leading to pronounced higher-order scatterings, anomalous magnetic excitation, and structural instability. In spite of the intertwined coupling among lattice, magnetic, and structural degrees of freedom, the soft modes with different symmetries prevent strong magnetoelectric coupling and ferroelectric switching. Our work demonstrates that competing octahedral tilting and rotational distortions created through a phase transition should be avoided to achieve room-temperature multiferroics.
Acknowledgments
This work was supported by Korea NRF Grants (No. 2009-0093817 and 2017-012642), DFG Le967/16-1, DFG-RTG 1953/1, Metrology for Complex Nanosystems, and the NTH-School Contacts in Nanosystems: Interactions, Control and Quantum Dynamics, and the Gordon and Betty Moore Foundation s EPiQS Initiative through Grant No. GBMF4413 to the Rutgers Center for Emergent Materials. The crystal growth at Rutgers was supported by the NSF MRI Grant No. MRI-1532006.
References
- (1) E. Bousquet, M. Dawber, N. Stucki, C. Lichtensteiger, P. Hermet, S. Gariglio, J. M. Triscone, and P. Ghosez, Nature (London) 452, 732 (2008).
- (2) N. A. Benedek and C. J. Fennie, Phys. Rev. Lett. 106, 107204 (2011).
- (3) J. M. Rondinelli and C. J. Fennie, Adv. Mater. 24, 1961 (2012).
- (4) N. A. Benedek, A. T. Mulder, and C. J. Fennie, J. Solid State Chem. 195, 11 (2012).
- (5) A. B. Harris, Phys. Rev. B 84, 064116 (2011).
- (6) A. T. Mulder, N. A. Benedek, J. M. Rondinelli, and C. J. Fennie, Adv. Funct. Mater. 23, 4810 (2013).
- (7) J. Varignon, N. C. Bristowe, E. Bousquet, and P. Ghosez, Sci. Rep. 5, 15364 (2015).
- (8) B. Xu, D. Wang, H. J. Zhao, J. I. Iniguez, X. M. Chen, and L. Bellaiche, Adv. Funct. Mater. 25, 3626 (2015).
- (9) Y. S. Oh, X. Luo, F.-T. Huang, Y.Wang, and S.-W. Cheong, Nat. Mater. 14, 407 (2015).
- (10) T. Birol, N. A. Benedek, H. Das, A. L. Wysocki, A. T. Mulder, B. M. Abbett, E. H. Smith, S. Ghosh, and C. J. Fennie, Curr. Opin. Solid State Mater. Sci. 16, 227 (2012).
- (11) M. S. Senn, A. Bombardi, C. A. Murray, C. Vecchini, A. Scherillo, X. Luo, and S. W. Cheong, Phys. Rev. Lett. 114, 035701 (2015).
- (12) F.-T. Huang, F. Xue, B. Gao, L. H. Wang, X. Luo, W. Cai, X.-Z. Lu, J. M. Rondinelli, L. Q. Chen, and S.-W. Cheong, Nat. Commun. 7, 11602 (2016).
- (13) F.-T. Huang, B. Gao, J.-W. Kim, X. Luo, Y. Wang, M.-W. Chu, C.-K. Chang, H.-S. Sheu, and S.-W. Cheong, NPJ Quantum Mater. 1, 16017 (2016).
- (14) M. H. Lee, C.-P. Chang, F.-T. Huang, G. Y. Guo, B. Gao, C. H. Chen, S.-W. Cheong, and M.-W. Chu, Phys. Rev. Lett. 119, 157601 (2017).
- (15) M. V. Lobanov, M. Greenblatt, E. N. Caspi, J. D. Jorgensen, D. V. Sheptyakov, B. H. Toby, C. E. Botez, and P. W. Stephens, J. Phys.: Condens. Matter 16, 5339 (2004).
- (16) Bin Gao, Fei-Ting Huang, Yazhong Wang, Jae-Wook Kim, Lihai Wang, Seong-Joon Lim, and Sang-Wook Cheong, Appl. Phys. Lett. 110, 222906 (2017).
- (17) Mark S. Senn, Claire A. Murray, Xuan Luo, Lihai Wang, Fei-Ting Huang, Sang-Wook Cheong, Alessandro Bombardi, Chris Ablitt, Arash A. Mostofi, and Nicholas C. Bristowe, J. Am. Chem. Soc. 138, 5479 (2016).
- (18) G. V. Lewis and C. R. A. Catlow, J. Phys. C: Solid State Phys. 18, 1149 (1985).
- (19) D. Sherwood, K. Ragavendran, and B. Emmanuel, J. Phys. Chem. B 109, 12791 (2005).
- (20) E. Kroumova, M. I. Aroyo, J. M. Perez Mato, A. Kirov, C. Capillas, S. Ivantchev, and H. Wondratschek, Phase Transitions 76 (1-2), 155 (2003).
- (21) E. A. Balykina, E. A. Ganshina, G. S. Krinchik, A. Yu. Trifonov, and I. O. Troyanchuk, Journal of Magnetism and Magnetic Materials 117, 259 (1992).
- (22) M. G. Brik and A. M. Srivastava, Journal of Luminescence 133, 69 (2013).
- (23) M. G. Cottam and D. J. Lockwood, Light Scattering in Magnetic Solids (Wiley, New York, 1986).
- (24) K.-Y. Choi, P. Lemmens, D. Heydhausen, G. Guntherodt, C. Baumann, R. Klingeler, P. Reutler, and B. Büchner, Phys. Rev. B 77, 064415 (2008).
- (25) S. F. Matar, V. Eyert, A. Villesuzanne, and M.-H. Whangbo, Phys. Rev. B 76, 054403 (2007).
- (26) F. Ye, J. Wang, J. Sheng, C. Hoffmann, T. Gu, H. J. Xiang, W. Tian, J. J. Molaison, A. M. dos Santos, M. Matsuda, B. C. Chakoumakos, J. A. Fernandez-Baca, X. Tong, B. Gao, J. W. Kim, and S.-W. Cheong, Phys. Rev. B 97, 041112(R) (2018).