A multi-wavelength study of the evolution of Early-Type Galaxies in Groups: the ultraviolet view
Abstract
The ultraviolet-optical color magnitude diagram of rich galaxy groups is characterised by a
well developed Red Sequence, a Blue Cloud and the so-called Green Valley.
Loose, less evolved groups of galaxies which are probably not virialized yet
may lack a well defined Red Sequence. This is actually explained in the
framework of galaxy evolution.
We are focussing on understanding galaxy
migration towards the Red Sequence, checking for signatures of such a transition
in their photometric and morphological properties.
We report on the ultraviolet properties of a sample of
early-type (ellipticals+S0s) galaxies inhabiting the Red Sequence.
The analysis of their structures, as derived by fitting a
Sérsic law to their ultraviolet luminosity profiles, suggests
the presence of an underlying disk. This is the hallmark of
dissipation processes that still must have a role in the
evolution of this class of galaxies. Smooth Particle Hydrodynamic
simulations with chemo-photometric implementations
able to match the global properties of our targets are used
to derive their evolutionary paths through
ultraviolet-optical colour magnitude diagrams, providing some
fundamental information such as the crossing time through the
Green Valley, which depends on their luminosity.
The transition from the Blue Cloud to the
Red Sequence takes several Gyrs, being about 3-5 Gyr for the
the brightest galaxies and more long for fainter ones, if it occurs.
The photometric study of nearby galaxy structures in ultraviolet is seriously
hampered by either the limited field of view the cameras
(e.g in Hubble Space Telescope) or by the low spatial resolution
of the images (e.g in the Galaxy Evolution Explorer).
Current missions equipped with telescopes and
cameras sensitive to ultraviolet wavelengths, such as
Swift-UVOT and Astrosat-UVIT, provide a
relatively large field of view and better resolution than the
Galaxy Evolution Explorer.
More powerful ultraviolet
instruments (size, resolution and field of view) are obviously bound
to yield fundamental advances in
the accuracy and depth of the surface photometry
and in the characterisation of the galaxy environment.
Keywords Galaxies: elliptical and lenticular, cD – Galaxies: fundamental parameters – ultraviolet: galaxies – Galaxies: evolution– interactions
1 Introduction
The Galaxy Evolution Explorer, (GALEX hereafter) (Martin et al., 2005; Morrissey et al., 2007) opened an opportunity for direct mapping of the star formation in galaxies in the Local Universe. Its large field of view (1.2∘ diameter) enabled the first ultraviolet all sky survey (e.g. Gil de Paz et al., 2007; Bianchi, 2011), which provided a new look at galaxy structures at these wavelengths, to be compared with the optical mapping (see e.g. Boselli & Gavazzi, 2014, and references therein).
Ultraviolet-optical color magnitude diagrams, e.g. near ultraviolet (NUV-) vs. Mr111 is one of the Sloan Digital Sky Survey optical bands., help in defining an evolutionary scenario for galaxies. Figure 1 of Salim et al. (2007) shows this diagram for about 50.000 nearby (), optically selected galaxies. Galaxies distributed in two well populated areas, a Red Sequence and a Blue Cloud separated by a relative large ( 3 mag) intermediate zone, the so-called Green Valley. The Blue Cloud is basically populated by late-type galaxies, while early-type galaxies dominate the Red Sequence. Since Salim et al. (2007), it became clear that on-going and/or recent star formation is not restricted to the Blue Cloud. H line emitters can be found in the Red Sequence which therefore includes galaxies with some star formation activity. Bona-fide early-type galaxies in the Green Valley, in particular S0s, show H nuclear emission more typical of star forming galaxies. Schawinski et al. (2007) suggested that as many as 30% of early-type galaxies may have hosted recent star formation. However, it has been known for a long time that many, if not most, early-type galaxies have low-ionization emission line regions (LINERs) (see e.g. Phillips et al., 1986; Annibali et al., 2010, and references therein), i.e. their nuclear H emission cannot be directly associated to star formation (see e.g Figure 1 in Salim et al., 2007) rather to AGN emission.
One of the GALEX breakthroughs has been the discovery of extended ultraviolet emission in the galaxy outskirts (Thilker et al., 2007; Thilker, 2008). Star formation has been detected in early-type galaxies not only in their central part but also in the disk, or in rings/arm-like structures (see e.g. Rampazzo et al., 2007; Marino et al., 2009; Jeong et al., 2009; Thilker et al., 2010; Marino et al., 2011a; Rampazzo et al., 2011; Marino et al., 2011b, and references therein).
Here we review our investigation on early-type galaxies in low density environments, highlighting the importance of ultraviolet observations which able to detect even extremely low star formation rates and to constrain Smooth Particle Hydrodynamic (SPH hereafter) simulations with chemo-photometric implementation (SPH-CPI hereafter) to determine galaxy evolution. In § 2 we summarise results of our analysis of the (NUV-) - Mr color magnitude diagram of galaxy groups of different richness and dynamical properties. In § 3 we discuss the results of our multi-wavelength analysis of the luminosity profiles of 11 early-type galaxies observed with Swift-UVOT. In § 4 we briefly describe the recipes of our SPH-CPI simulations able to reproduce the global properties of our targets, i.e. their absolute magnitudes, spectral energy distribution (SED hereafter), morphology, and other galaxy properties that we will use to better understand their evolution. In § 5 we summarize our results and preliminary conclusions, and derive our expectations in § 6 from on-going and future ultraviolet missions.
2 (NUV-) vs. Mr color magnitude diagram as a tracer of the co-evolution of galaxies in nearby groups
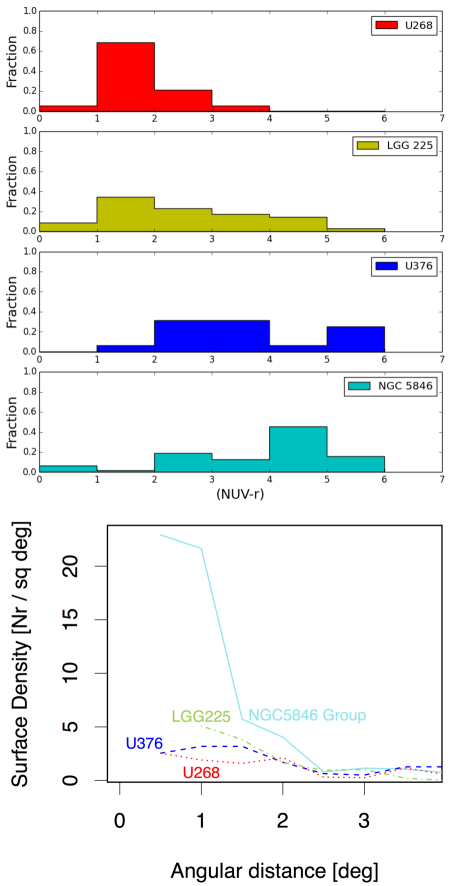
Augustus Oemler and collaborators remarked that “the properties of many galaxies have evolved during recent epochs … and the end point of this evolution results in galaxy populations that vary over space ..” (see Oemler et al., 2017, and references therein). Groups are key structures to understand the path of this evolution in low density environments and their ultraviolet-optical color magnitude diagrams are a useful tool to investigate the co-evolution of these cosmic structures and their member galaxies. We have obtained the (NUV-) - Mr color magnitude diagram of four groups USGC U268, LGG 225, U 376 and U677 (alias NGC 5486 group). (Marino et al., 2013; Mazzei et al., 2014a; Marino et al., 2016; Mazzei et al., 2018a, and references therein). These groups span a wide range both in galaxy populations and dynamical properties. Two of them, namely USGC U 268 and LGG 225 are not yet virialized. These Local Group analogs are mostly populated by late-type galaxies. At odds, the NGC 5846 group is the third largest nearby galaxy association after Virgo and Fornax clusters. This group is dominated by early-type galaxies and the dynamical analysis of its 99 known members indicates that it is virialized.
Assuming that the range 56.5 defines the Red Sequence region (Yi et al., 2005; Salim et al., 2007), we derive the fraction of galaxies in this region in the above groups. The comparison between our virialized and not virialized groups is shown in the top four panels of Figure 1. The galaxy population in the red sequence increases from the loose, not virialized groups (USGC U268 and LGG 225) to the rich and virialized NGC 5846 group. Note also the increasing fraction of galaxies in the green valley, defined as 3.55, from LGG 225 to USGC U376 and NGC 5846. The bottom panel of Figure 1 shows the group surface density as a function of distance from the group centre of mass. The surface density varies greatly from USGC 268 to NGC 5846 and so does the galaxy population, from late-type galaxies in loose groups, to early-type in more dense ones. In the reasonable assumption that these are all aspects of different phases of group evolution, less evolved, more primitive groups have indeed a shallower surface density than the virialized NGC 5846 group. Groups and galaxies seem indeed co-evolving via different mechanisms, e.g. via encounters and merging, whose effects still need to be deeply investigated in terms of morphological, structural and star formation consequences (see e.g. Weigel et al., 2017, and references therein).
One question raised by the analysis of group color magnitude diagrams is related to the morphology of galaxies in the red sequence and in the green valley. Are the galaxies in the Red Sequence, mostly ellipticals and S0s, fairly unperturbed, at odds with galaxies in the Green Valley? Far (FUV) and near (NUV) ultraviolet images of galaxies in our groups obtained by GALEX show that signatures of interaction are rare both in loose and dense groups. For example, 1 out of 4 members in LGG 225 either shows morphological distortions or are considered pairs (Mazzei et al., 2018a) while NGC 5846 has a much lower fraction. However, galaxy-galaxy encounters are the main drivers of the evolution within groups. An intriguing case is that of the pair NGC 3447/3447A in LGG 225, highlighting the problem of “false” galaxy pairs and the growth of disk instabilities in galaxy groups we recently analysed in Mazzei et al. (2018a, see§ 4.2). Mergers, which can be the final phase of an encounter, alter the galaxy morphology and may fuel the star formation rate via proper gas pipelines. We have considered the interesting case of the NGC 454 system, a galaxy pair which is still in the merging process (Plana et al., 2017). Signatures of past interactions are given by asymmetries or morphological distortions. However, some structures, such as bars and rings, can also arise (therefore, we pay attention also to these features). In particular, rings are enhanced in ultraviolet and far from being as symmetric as in the optical bands (Rampazzo et al., 2017).
To go further with our analysis we selected groups which may mark the transition from the non virialized to the virialized phase. These intermediate phases are expected to be characterized by sub-structures and clumps in groups populated by some early-type galaxies with interaction signature such as shells and/or rings. Early-type galaxies should represent the end-product of galaxy evolution: mapping their ultraviolet-optical properties in particular when they are the bright end of a group population, gives precious insight of the main evolutionary mechanisms at work in the group itself.
| Galaxy | D25 | D | scale | m-M | MB | MHI | LX(gas) |
|---|---|---|---|---|---|---|---|
| Ident. | [arcmin] | [Mpc] | [kpc arcmin-1] | [mag] | [mag] | [109 M⊙] | [1040 erg s-1] |
| NGC 1366 | 2.1 | 21.12.1 | 6.1 | 31.620.50 | -18.880.54 | 1.0 | 0.03 |
| NGC 1415 | 3.7 | 22.72.5 | 6.5 | 31.780.55 | -19.230.59 | 1.2a | 0.1 |
| NGC 1426 | 2.9 | 24.12.4 | 7.0 | 31.910.50 | -19.700.52 | …. | 0.03 |
| NGC 1533 | 3.2 | 21.42.1 | 6.2 | 31.650.50 | -19.860.52 | 7.4b | 0.11 |
| NGC 1543 | 3.6 | 20.02.0 | 5.8 | 31.500.50 | -20.110.53 | 0.8 | 0.16 |
| NGC 2685 | 4.4 | 16.01.6 | 4.8 | 31.020.50 | -19.090.51 | 3.0c | |
| NGC 2974 | 3.5 | 21.52.0 | 6.2 | 31.660.46 | -20.010.48 | 0.7d | 0.2 |
| NGC 3818 | 2.4 | 36.33.6 | 10.4 | 32.800.50 | -20.220.58 | … | 0.55 |
| NGC 3962 | 4.2 | 35.33.5 | 10.2 | 32.740.50 | -21.290.53 | 2.8e | 0.33 |
| NGC 7192 | 2.4 | 37.83.8 | 10.7 | 32.890.50 | -20.810.51 | 0.7e | 1.0 |
| IC 2006 | 2.3 | 20.22.0 | 5.9 | 31.530.50 | -19.340.51 | 0.3 | 0.08 |
Note: The apparent diameters (col. 2) and the adopted distances (col. 3) are derived from the Extragalactic Distance Database (EDD: http://edd.ifa.hawaii.edu), as in Papers I and II. Absolute total magnitudes in col. 6 are derived from col. 5 using B-band observed total magnitudes and extinction corrections from Hyperleda (Makarov et al., 2014) catalogue. The HI masses (col. 7) are obtained using the distance in col. 3 and fluxes from NED and from the following references: a Courtois & Tully (2015); b Ryan-Weber, Webster & Starvely-Smith (2003); cJózsa et al. (2009); d Kim et al. (1988); e Serra & Oosterloo (2010). X-ray gas luminosity (col. 8) is from Table 7 of Trinchieri et al. (2015). The table is adapted from Mazzei et al. (2018b)
To this end, we have selected the nearby, very extended (several square degrees)
Dorado group and its numerous and diversified galaxy population (see Firth et al., 2006) for
imaging observations at high resolution with the OmegaCam@VST 2.6m ESO telescope
at Cerro Paranal (Chile).
Dorado is an example of a still evolving group, as suggested by
its clumpy structure, the significant number of
on-going and past interaction signatures, suc as the shell structure
of NGC 1549 and NGC 1553 (Malin & Carter, 1983), and the presence
of kinematic anomalies (Rampazzo, 1988).
We have already investigated the peculiar ultraviolet structure of NGC 1533 in Dorado
with GALEX and studied it in the context of galaxy evolution with SPH-CPI simulations
(see e.g. Marino et al., 2011a; Mazzei et al., 2014b).
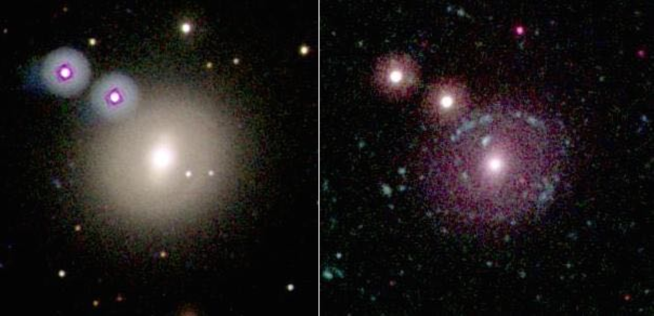
Figure 2 exemplifies our findings
by comparing optical and ultraviolet colour composite images.
Swift offers a new perspective to study galaxies (Gehrels et al., 2004; Citterio et al., 1994; Burrows et al., 2005). It is equipped with the 30cm UVOT telescope with a relatively large FoV (17′17′), (Å), (Å), (Å) ultraviolet filters and a PSF (FWHM=292 for , 245 for , 237 for ) significantly improved with respect to GALEX. This PSF is, in general, still to large to study the bulge of nearby galaxies. Therefore, Swift-UVOT data are useful to analyse the main body and the galaxy outskirts, which have revealed unexpected features useful to understand the evolutionary history of galaxies (Rampazzo et al., 2017).
3 The ultraviolet surface brightness structure with Swift and the evolution of early-type galaxies
We start our multi-wavelength investigation of bright early-type galaxies in low density environments analyzing 11 galaxies (Trinchieri et al., 2015; Rampazzo et al., 2017) using Swift (see Table 1). All these galaxies are located either in groups or at the edge of rich associations, like Fornax, where galaxy densities are comparable to those of groups.
These galaxies have been selected from the Revised Shapley Ames catalogue (Sandage & Tammann, 1987) and investigated in mid infrared by Rampazzo et al. (2013) using the Spitzer-IRS spectrograph. This study identified galaxies with clear signatures of AGN and/or on-going star formation activity in their nuclear region (3 ). Our aim is to look for residual recent star formation in the galaxy outskirts which will appear prominent in ultraviolet, and we used mid infrared nuclear spectra to select early-type galaxies that are either passively evolving or with a low degree of activity.
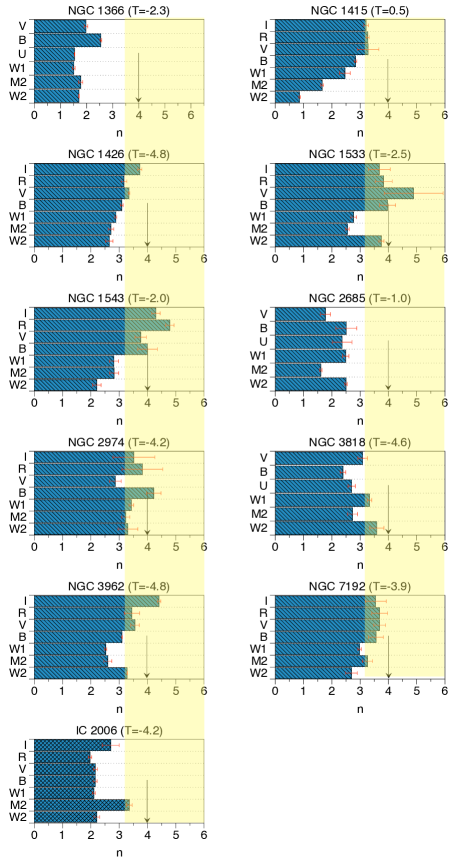
In ultraviolet images about 50% of early-type galaxies show the presence of bright ring/arm-like structures (Rampazzo et al., 2017). We investigated the overall structure by fitting the ultraviolet, optical and near infrared surface brightness profiles with a single Sérsic law (Sérsic, 1968), deriving the Sérsic index, , for each wavelength band. Figure 3 shows the synoptic view of Sérsic indices obtained by fitting the same galaxy region. Ultraviolet indices are generally lower than optical and near infrared ones, in the range , suggesting the presence of an underlying disk structure prominent at these wavelengths. Similar analyses, limited to optical and near infrared bands, have been performed by La Barbera et al. (2010), Vulcani et al. (2014), and Kennedy et al. (2016). These studies outlined that the Sérsic indices increase with wavelength for late-type galaxies while they are almost independent of wavelength for early-type ones. The Sérsic index behaviour for late-type galaxies is interpreted with the presence of a disk, due to a radial change in the galaxy stellar populations and/or dust reddening. With the extension of our investigation to the ultraviolet range, we were able to discover a similar trend in the early-type population which allowed us to suggest for these “red and dead” galaxies the presence of an underlying disk (Rampazzo et al., 2017). This presence indicates that dissipative processes are still working in these early-type galaxies.
Multi-wavelength observations (Table 1) give important constraints on simulations. In the following section we present the recipes of our SPH-CPI simulations, focussing on results for a few cases. The complete analysis of each galaxy and results from the entire sample are still ongoing (Mazzei et al., 2018b).
4 Modelling galaxy formation and evolution
We use a grid of Smooth Particle Hydrodynamics simulations with Chemo-Photometric implementation (SPH-CPI hereafter) to investigate the evolution of galaxies (Mazzei et al., 2014a, b). All simulations start from collapsing triaxial systems composed of dark matter and gas, as in Mazzei & Curir (2003). The simulated halos, as detected by the Hubble flow, share all the same initial conditions: the virial ratio (0.1), the average density, and the spin parameter. In more detail, each system is built up with a spin parameter, , given by E0.5/(GM0.5), where E is the total energy, J is the total angular momentum, and G is the gravitational constant; is equal to 0.06 and aligned to the shorter principal axis of the dark matter halo. The initial triaxiality ratio of the dark matter halos, = (a2 - b2)/(a2 - c2), is 0.84 (Mazzei et al., 2014a, b; , 2012; Curir et al., 2006, their Table 1) where a bc. The simulations include self-gravity of gas, stars and dark matter, radiative cooling, hydrodynamical pressure, shock heating, viscosity, star formation, feedback from evolving stars and type II supernovae, and chemical enrichment. A Salpeter initial mass function (IMF) (0.01 - 100 M⊙) is adopted, although alternative IMFs have been tested (Mazzei & Curir, 2003). The chemo-photometric implementation is based on Padova evolutionary population synthesis models including stellar populations of six metallicity values sZ=0.0004, 0.001,0.004,0.008, 0.02,0.05. The SPH-CPI simulations provide the spectral energy distribution (SED) from 0.05 m to 1 mm at each snapshot (=3.7107 years), accounting for extinction and re-emission by dust in a self-consistent way (see Mazzei et al., 2014a, b, 2018a, for details and references). All the model parameters have been tested in previous works (Mazzei & Curir, 2003, and references therein) devoted to analysing the evolution of the global properties of isolated triaxial system initially composed of dark matter and gas.
We performed a grid of simulations of mergers and encounters between galaxies with different mass ratio (1:1 10:1) and gas fraction, exploring different orbital parameters, starting from systems built up with the same initial conditions and using as model parameters those tuned in the above cited papers. For each early-type galaxy under study, a large set of SPH-CPI simulations is explored until its absolute magnitude (B-band for example), multi-wavelenght SED and morphology are matched. The galaxy kinematics, when available, is used to further constrain the simulation (e.g. Mazzei et al., 2014b, 2018a). We are investigating all the galaxies in Table 1 (Mazzei et al., 2018b, in preparation). In the next two sub-sections we focus on two examples of the above set: NGC 1426, showing no peculiar features, and NGC 1533 showing bright ring/arm-like structure in ultraviolet (in § 4.1). In § 4.2 we present two remarkable examples of the evolution of early and late-type galaxies in low density environments.
4.1 Early-type galaxies in groups
NGC 1426 is classified as an E4 but our multi-wavelength structural analysis shows that there is a disk, suggesting a new classification as S0. The galaxy is located in the Fornax Eridanus cloud with an environmental galaxy density of galaxy Mpc-3 (Tully, 1988). No peculiar features, neither in the near nor in the far ultraviolet, are revealed by both GALEX and Swift observations. NGC 1426 is considered an old and passively evolving galaxy. Using Lick line-strength indices Annibali et al. (2007) calculated that the galaxy has an optical luminosity weighted age of 9.02.5 Gyr and nearly solar metallicity, . Mid infrared spectroscopic observations of its nuclear region (Panuzzo et al., 2011; Rampazzo et al., 2013, MIR class=0) indicate that there are neither emission lines (Annibali et al., 2010), nor Polycyclic Aromatic Hydrocarbon emissions, signatures of a recent star formation episode (Vega et al., 2010). NGC 1426 is not detected in HI, and Trinchieri et al. (2015) measured an upper limit to the X-ray luminosity of its hot gas of log L38.95 erg sec-1.
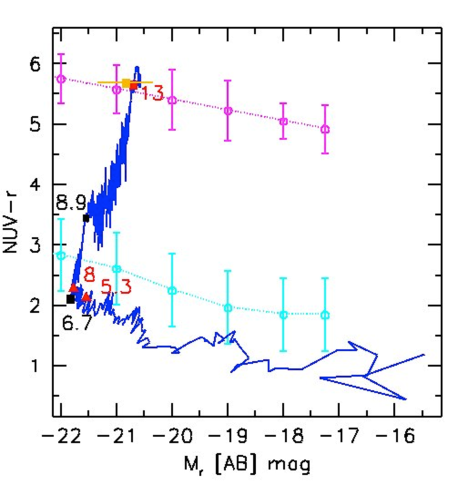
Figure 4 shows the evolutionary path, in the rest-frame (NUV- ) - Mr color magnitude diagram, predicted for NGC 1426 by the SPH-CPI simulation which best fits its global properties. The derived SED, the morphology and total magnitude, including the ultraviolet and optical luminosity profiles, are consistent with all the observational constraints (Mazzei et al., 2018b, in preparation). In particular, according to this simulation, the total B-band absolute magnitude of the galaxy is -19.40.5 vs. -19.70.5 mag as observed (Table 1).
The evolution of NGC 1426 is driven by a major merger between two halos of equal mass (M M⊙). At the beginning the simulation considers 8104 particles to describe the halos of gas and dark matter. The halos centers of mass are moving, at a separation of 654 kpc, with a relative velocity of 142 km s-1. The red triangles in Figure 4 mark the position of the galaxy at , corresponding to a galaxy age of 8 Gyr, and at , to 5.3 Gyr. The simulation shows that the star formation rate drops significantly when the galaxy is older than 6.7 Gyr, indicated with the big black square in the figure. The galaxy age, from the onset of the star formation to =0, is 13 Gyr. When weighted by B-band luminosity the recovered age is of 7 Gyr. Its total mass, including the dark matter, is 5.791010 M⊙, that of stars 3.75 1010 M⊙ within D25. The simulation predicts 6.7 Gyr between the maximum value of its star formation rate, i.e. the brightest point of the color magnitude diagram, and the following quenching. From z1, when the stellar mass is prevailing over the mass of the dark matter inside a radius R25, the galaxy assembles about 54% of its present stellar mass, and only 15% from to .
NGC 1533, classified (RL)SB00 (Comerón et al., 2014), has a prominent UV-bright incomplete ring structure (Figure 2). It is located in a clump of the Dorado group ( galaxies Mpc-3, Tully (1988)), in a large cloud of HI (7.4 M⊙ see Table 1).
Mazzei et al. (2014b) provided details on the evolution of NGC 1533, from the simulation accounting for its global properties. The simulation succeeded in reproducing its absolute magnitude, SED, morphology including the ring (their Fig. 6), with a merger between halos with mass ratio 2:1 and perpendicular spins. The predicted galaxy age is 13.7 Gyr, that estimated from weighting the age of its stellar populations by B-band luminosity is 6 Gyr, younger than that of NGC 1426. Using line-strength indices, Annibali et al. (2007) calculated a luminosity weighted age of 11.96.9 Gyr with the large uncertainty due to the presence of emission lines which perturb the measure of H. However, the far and near ultraviolet emissions revealed by GALEX (Marino et al., 2011c) and by our Swift-UVOT images suggest quite recent SF events in the outer ring of this galaxy.
Summarizing, the local () global properties of both NGC 1426 and NGC 1533, the first without, the second with peculiar features in the ultraviolet respectively, are explained in terms of a major merger event. In these cases, together with multi-wavelength photometric data, high resolution velocity fields, derived by our 2D wide field Fabry-Perot observations, are available to constrain our simulations.
4.2 Amidst true and ‘false’ galaxy pairs in groups
Since the very beginning of extragalactic astronomy, about a century ago, pairs of galaxies fascinated astronomers (see e.g. Lundmark, 1927) who accumulated evidence indicating that gravitational interaction affects the evolution of pair members (Holmberg, 1937; , 2011). Catalogues of nearby pairs prospered for a long time (e.g. Karachentsev, 1972; Turner, 1976; Reduzzi & Rampazzo, 1995; Soares et al., 1995), however, identifying physical pairs, i.e. gravitationally bound objects, has been non-trivial even after redshifts have become available. Karachentsev (1989) calculated that in his catalogue 32% are “false” double systems, i.e. the two galaxies have similar redshifts but are physically un-bound.
In the context of the evolution of galaxies in nearby groups,
we have studied the particularly intriguing case of the NGC 3447/3447A.
This system is located in a Local Group Analog, LGG 225,
i.e. a group that, as the Local Group of Galaxies, is mostly populated
by late-type galaxies with few of them dominant in the group
(see e.g. Marino et al., 2010). The
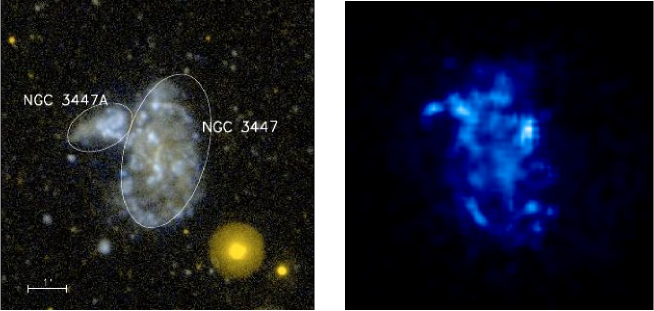
NGC 3447/3447A system morphology, shown in the left panel of Figure 5,
has been interpreted as a pair distorted by an on-going interaction. In our recent study
(Mazzei et al., 2018a), we investigated its optical and ultraviolet surface photometry
revealing that NGC 3347 has an extended disk that includes NGC 3447A.
The 2D velocity field and velocity dispersion map we obtained
using the Fabry-Perot PUMA@2.2m in San Pedro Martir (Mexico) suggest
that neither NGC 3447 nor NGC 3447A have
a coherent rotation velocity, but rather that there is a
small velocity gradient between the two. These multi-wavelength data allowed us to
constrain our large grid of SPH-CPI simulations. In the right panel Figure 5
we show the far-ultraviolet image of NGC 3447/3447A derived from the
snapshot of the simulation provides an excellent match to the
ultraviolet morphology and brightness, in addition to the best fit of the system
SED, the B-band magnitude, and the best match of the velocity field.
According to this simulation, the peculiar morphology of the system
can be interpreted as a consequence
of the disk instability driven by the halo instability itself, enhanced by the
on-going encounter with a distant ( degree) companion, 0.5 mag fainter.
The simulation suggests that NGC 3447/NGC 3447A is a single object.
The predicted age of the system is 12 Gyr, while its stellar populations,
weighted by B-band luminosity, are 1.3 Gyr old. NGC 3347A/NGC 3347
represents a new class of false pairs, that is, galaxies which appear as pairs but are a single distorted galaxy.
Karachentsev (1972, 1989) warned about the potential danger of an
underestimation of the role of false pairs since they gave ”anomalously high
values of average orbital mass for binary galaxies”.
The problem reverberates to new large pair surveys.
The evolution of this dark matter-dominated system (Mazzei & Curir, 2001; Mazzei et al., 2018a),
which results from an encounter with a still far away companion
giving rise to a very common intermediate luminosity galaxy,
is a building block in galaxy assembly.
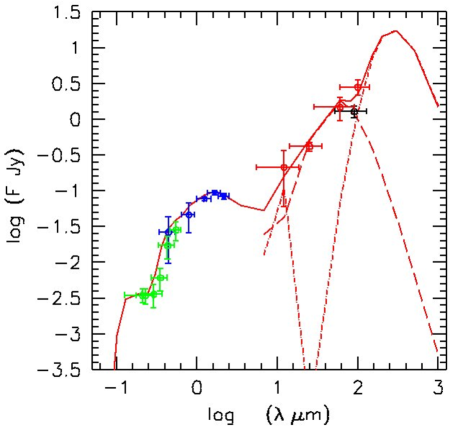
We also analysed the NGC 454 system (RR23 in the catalogue of Southern isolated pairs of Reduzzi & Rampazzo, 1995) which unlike NGC 3447/3447A system, is a physical pair. This is composed of a distorted early-type galaxy and a completely damaged late-type galaxy so that it is considered an example of on-going mixed merger. We exploited the Swift-UVOT archival optical and near ultraviolet photometric data and our 2D kinematical information obtained with the SAM+FP at the SOAR 4.1m telescope at Cerro Pachón, Chile. This high spatial resolution Fabry-Perot provided us with the H intensity distribution, the 2D velocity and velocity dispersion fields (Plana et al., 2017). The two members in the NGC 454 system, nearly superposed in projection, result to have a virtually null velocity separation. The velocity field of the late-type member is characterised by a small velocity gradient without any rotation pattern.
We used UVOT observations to the SED of the system towards the near ultraviolet (see Fig.6) and to demonstrate quantitatively that NGC 454 has a disk: Sérsic indices run from to . The early-type member of the NGC 454 system is a bona fide S0. The global properties of this system, that is its total B-band absolute magnitude, multi-wavelength SED, and morphology, are well matched by an on-going major merger between halos with a mass ratio 1:1 and perpendicular spin. In the current phase of the encounter, the far-IR SED accounts for a B-band attenuation of 0.85 mag so that the absolute B-band magnitude of the best-fit snapshot, shown in Figure 6, is -21.0 mag to be compared with -20.640.41 mag. About 33% of the far infrared emission is due to a warm dust component, heated by the ultraviolet radiation of H II regions, and a cold component heated by the general radiation field, both including PAH molecules as described in Mazzei et al. (1992, 1994) and Mazzei & Zotti (1994). The shape of the far infrared SED suggests the presence of a large amount of dust: the ratio between the far infrared luminosity and the observed luminosity, in the ultraviolet to near infrared spectral range, is 2.5.
Our SPH-CPI simulation predicts that this system is 12.4 Gyr old and that the merger will be completed within 0.2 Gyr (Plana et al., 2017).
As expected, both exemples point to the conclusion that encounters are the driver of the galaxy morphological and physical evolution in groups.
5 Summary and conclusions
We have investigated galaxy groups at the two extremes of their evolution: i.e groups still non virialized, likely at the beginning of their evolution/assembling (as USGC U268), and groups in an advanced phase as the NGC 5846 group.
We have analysed the ultraviolet structure of their early-type galaxy members to explore the presence of recent star formation episodes. Furthermore, we have used the wealth of multi-wavelength information and, when available, the 2D kinematics to constrain our large grid of SPH-CPI simulations and shed light on the evolution of these galaxies. The main results of our works can be summarised as follows :
-
•
Bright early-type galaxies located in the Red Sequence of galaxy groups of different richness and dynamical evolutionary phase are not passively evolving (Yi et al., 2011; Marino et al., 2016); several of these galaxies host recent star formation both in their nuclei and in their outskirts, often showing ring/arm-like structures.
-
•
A synoptic view of the behaviour of the Sérsic indices from ultraviolet to optical and near-infrared bands of 11 early-type galaxies unveils the presence of an underlying ultraviolet disk highlightening the role of dissipative mechanisms along the whole evolution of these galaxies (Rampazzo et al., 2017). Larger samples are needed to draw firm conclusions.
-
•
Our SPH-CPI simulations are able to reproduce the multi-wavelength properties of early-type galaxies, i.e. their absolute magnitudes, SEDs, morphology including ultraviolet bright rings. They predict that up to 30% of their stellar mass is assembled during the galaxy transition from the Blue Cloud to the Red Sequence, i.e. from to . This transition takes several Gyrs depending on galaxy luminosity, about 3-5 Gyr for the brightest ones. Fainter galaxies may experience rejuvenation episodes more frequently than the brightest and massive ones (Mazzei et al., 2014a).
-
•
These simulations indicate that Es in LGG 225 are at least 1 Gyr younger than those in USGC 376 (Mazzei et al., 2014a). NGC 3457 is the result of a galaxy encounter and NGC 3522 of a major merger, while all the Es in USGC 376 derive from a merger.
-
•
At odds with rich and dense cluster environments, where external gas removal (e.g. ram-pressure stripping) are the most credited mechanisms (see Poggianti et al., 2017, and references therein), our SPH-CPI simulations suggest that star formation quenching in low density environment is intrinsic to the galaxy evolution.
-
•
The study of pairs with our multi-wavelength approach constrains SPH-CPI simulations providing unexpected scenarios, like the importance of disk instabilities during interactions leading to false pairs, as in the case of NGC 3447/3447A (Mazzei et al., 2018a).
6 Future Directions
We are enlarging our sample of early-type galaxies with ultraviolet,
mainly using the near ultraviolet Swift-UVOT archived
data, optical and near infrared
data, to perform multi-wavelength structural
analysis with the purpose of testing our result
that the Sérsic index decreases at the ultraviolet wavelengths.
We remark that both a PSF comparable with optical data
and large field of view are necessary ingredients
for an accurate ultraviolet surface photometry of galaxies in the nearby
Universe. Recent deep optical imaging shows
how the investigation of outskirts may tell us about the galaxy
evolution (see e.g. Abraham et al., 2016; Duc, 2016).
Ultraviolet imaging has proven, even with very small telescopes, to
be indispensable for detecting and for interpreting some galaxy components
(youngest stellar populations, lowest star formation rates), in regimes
where optical and near infrared images [from the largest telescopes] had failed to
detect such components. This indicates that more powerful ultraviolet
instruments (size, resolution and field of view) are obviously bound
to yield fundamental advances and to possibly open new paths.
The UVIT (, 2017) ultraviolet sensitive cameras with a field of view of 28′ diameter and a PSF of about 1″ is a great improvement over the roughly 3″ PSF of Swift-UVOT. The field of view of the Cosmological Advanced Survey Telescope for Optical and Ultraviolet Research (CASTOR) (Côte et al., 2012) of 0.473, with three simultaneous near ultraviolet, U and filters and a HST-like spatial resolution, would have a deep impact on nearby galaxy studies, allowing surface photometric analysis of both more compact objects and of galaxy associations. Progress in the field of galaxy evolution would greatly benefit from optical designs that combine both wide field of view and high resolution imaging cameras for the next generation of ultraviolet telescopes.
Acknowledgements P. Mazzei and R. Rampazzo acknowledge partial support from INAF through grants PRIN-2014-14 ‘Star formation and evolution in galactic nuclei” (PI Michela Mapelli). This research has made use of the NASA/IPAC Extra galactic Database (NED) which is operated by the Jet Propulsion Laboratory, California Institute of Technology, under contract with the National Aeronautics and Space Administration. Part of this work is based on archival data, software or online services provided by the Space Science Data Center - ASI.
References
- Abraham et al. (2016) Abraham, R., Merritt, A., Zhang, J. et al. 2016, in Formation and Evolution of Galaxy Outskirts, Proceedings of the International Astronomical Union, IAU Symposium, Volume 321, pp. 137-146
- Annibali et al. (2007) Annibali, F., Bressan, A., et a. 2007, Astron. Astrophys.,
- Annibali et al. (2010) Annibali, F., Bressan, A., Rampazzo, R., Zeilinger, W. W., Vega, O., Panuzzo, P. 2010, Astron. Astrophys., 519, A40
- Bianchi (2011) Bianchi, L., 2011 ApSS, 335, 51; DOI: 10.1007/ s10509-011-0612-2
- Boselli & Gavazzi (2014) Boselli A., Gavazzi G., 2014, Annu. Rev. Astron. Astrophys., 22, 74
- Burrows et al. (2005) Burrows, D. N., Hill, J. E., Nousek, J. A., et al. 2005, Space Sci. Rev., 120, 165
- Citterio et al. (1994) Citterio, O., Conconi, P., Ghigo, M., et al. 1994, in SPIE Conf. Ser., ed. R. B. Hoover, & A. B. Walker, 2279, 480
- Courtois & Tully (2015) Courtois, H. M., Tully, R. B. 2015, Mem. R. Astron. Soc., 447, 1531
- Comerón et al. (2014) Comerón, S., Salo, H., Laurikainen, E. et al. 2014, Astron. Astrophys., 562, A121
- Côte et al. (2012) Côte, P., Scott, A., Balogh, M., Buckingham, R., Aldridge, D. et al. 2012, Proc. of SPIE, 8442, 844215
- Curir et al. (2006) Curir, A., Mazzei, P., Murante, G., 2006, Å, 447, 453
- de Vaucouleurs (1948) de Vaucouleurs, G. 1948, Ann. Astrophys. , 11, 247
- Duc (2016) Duc, P.-A. 2016, in Formation and Evolution of Galaxy Outskirts, Proceedings of the International Astronomical Union, IAU Symposium, Volume 321, pp. 180-182
- Firth et al. (2006) Firth, P., Evstigneeva, E. A., Jones, J. B., Drinkwater, M. J., Phillipps, S., Gregg, M. D. 2006, Mem. R. Astron. Soc., 372, 1856
- Gehrels et al. (2004) Gehrels, N., Chincarini, G., Giommi, P., et al. 2004, Astrophys. J., 611, 1005
- Gil de Paz et al. (2007) Gil de Paz et al. 2007, Astrophys. J. Suppl. Ser., 173, 185
- Ho et al. (2011) Ho, L.C., Li, Z.-Y., Barth, A. J., Seigar, M. S., Peng, C. Y. 2011, Astrophys. J. Suppl. Ser., 197, 21
- Holmberg (1937) Holmberg, E. 1937, A study of double and multiple galaxies - Annals of the Observatory of Lund, 6, 5
- Karachentsev (1972) Karachentsev, I.D. 1972 Catalogue of isolated pairs in the Northern Hemisphere, Soobshch. Spets. Astrofiz. Obs., 7, 3
- Karachentsev (1989) Karachentsev, I.D. 1989, in Pairs and Interacting Galaxies, NASA Conference Publication 3098, pag. 3
- Kennedy et al. (2016) Kennedy, R., Bamford, S. P., Häußler, B., et al. 2016, MNRAS, 460, 3458
- Kim et al. (1988) Kim, D.-W., Guhathakurta, P., Van Gorkom, J.H. et al. 1988, Astrophys. J.330, 684
- Jeong et al. (2009) Jeong, H., Yi, S. K., Bureau, M., Davies, R. L., Falón-Barroso, J. et al. 2009, Mem. R. Astron. Soc., 398, 2028
- Józsa et al. (2009) Józsa, G.I.G., Oosterloo, T.A., Morganti, R. et al. 2009, Astron. Astrophys., 494, 489
- La Barbera et al. (2010) La Berbera, F., de Cravalho, R. R., de la Rosa, I. G., et al. 2010, MNRAS, 408, 1313
- Li et al. (2011) Li, Z.-Y., Ho, L. C., Barth, A. J., Peng, C. Y. 2011, Astrophys. J. Suppl. Ser., 197, 22
- Lundmark (1927) Lundmark, K. 1927, Uppsala Obs. Medd., 30, 3
- Malin & Carter (1983) Malin, D. F., Carter, D., 1983, Astrophys. J., 274, 534
- Makarov et al. (2014) Makarov, D., Prugniel, P., Terekhova, N., Courtois, H., Vauglin, I. 2014, Astron. Astrophys., 570, A13
- Marino et al. (2009) Marino, A., Iodice, E., Tantalo, R. et al. 2009, Astron. Astrophys., 508, 1235
- Marino et al. (2010) Marino, A., Bianchi L., Rampazzo R., et al., 2010, A&A, 511, A29
- Marino et al. (2011a) Marino, A., Bianchi, L., Rampazzo, R. et al. 2011a, Ap&SS, 335, 243
- Marino et al. (2011b) Marino, A., Bianchi, L., Rampazzo, R. et al. 2011b, Astrophys. J., 736, 154
- Marino et al. (2011c) Marino, A.; Rampazzo, R.; Bianchi, L.; Annibali, F.; Bressan, A. et al., 2011c, Mem. R. Astron. Soc., 411, 311
- Marino et al. (2013) Marino, A, Plana, H., Rampazzo, R., Bianchi, L., Rosado, M. et al. 2013, Mem. R. Astron. Soc., 428, 476
- Marino et al. (2016) Marino, A., Mazzei, P., Rampazzo, R., Bianchi, L. 2016, Mem. R. Astron. Soc., 459, 2212
- Martin et al. (2005) Martin, D.C., Fanson, J., Schiminovich, D. et al. 2006, Astrophys. J., 619, L1
- Mazzei et al. (1992) Mazzei, P., Xu, C., de Zotti, G. 1992, A&A, 256, 45
- Mazzei et al. (1994) Mazzei, P., de Zotti, G., Xu, C. 1994, ApJ, 422, 81
- Mazzei & Zotti (1994) Mazzei, P., de Zotti, G. 1994, MNRAS, 266, 5
- Mazzei & Curir (2001) Mazzei, P., Curir, A. 2001, A&A, 372, 803
- Mazzei & Curir (2003) Mazzei, P., Curir, A. 2003, ApJ, 591, 784
- Mazzei et al. (2014a) Mazzei, P., Marino, A., Rampazzo, R. 2014a, Astrophys. J., 782, 53
- Mazzei et al. (2014b) Mazzei, P., Marino, A., Rampazzo, R. 2014b, Advances in Space Research, 53, 920
- Mazzei et al. (2018a) Mazzei, P. , Marino, A., Rampazzo, R. et al. 2018a, Astron. Astrophys., in press
- Mazzei et al. (2018b) Mazzei, P. et al. 2018b, in preparation.
- Morrissey et al. (2007) Morrissey, P., Conroy, T., Barlow, T.A., et al. 2007, Astrophys. J. Suppl. Ser., 173, 682
- Oemler et al. (2017) Oemler, A. Jr., Abramson, L.E., Gladders, M.D. et al., 2017, 844, 45
- Panuzzo et al. (2011) Panuzzo, P., Rampazzo, R., Bressan, A. et al. 2011, Astron. Astrophys., 528, A10
- Phillips et al. (1986) Phillips, M. M., Jenkins, C. R., Dopita, M. A., Sadler, E. M., Binette, L. 1986, Astron. J., 91, 1062
- Plana et al. (2017) Plana, H.M., Rampazzo, R., Mazzei, P., Marino, A., Amram, P., Ribeiro, A.L.B. 2017, Mon. Not. R. Astron. Soc., in press
- Poggianti et al. (2017) Poggianti, B, M., Moretti, A., Gullieuszik, M., et al. 2017, Astrophys. J., 844, 48
- Rampazzo (1988) Rampazzo, R. 1988, Astron. Astrophys., 204, 81
- Rampazzo et al. (2007) Rampazzo, R., Marino, A., Tantalo, R., Bettoni, D., Buson, L. M. et al 2007, Mem. R. Astron. Soc., 381, 245
- Rampazzo et al. (2011) Rampazzo, R., Annibali, F., Marino, A. et al. 2011, Astrophys. Space Sci., 335, 201
- Rampazzo et al. (2013) Rampazzo, R., Panuzzo, P., Vega, O. et al. 2013, Mem. R. Astron. Soc.,
- Rampazzo et al. (2016) Rampazzo, R., Mazzei, P., Marino, A., Trinchieri, G., Uslenghi, M., Wolter, A. (2016). The evolution of S0s with UV bright rings A SWIFT-UVOT study. Proceedings of the International Astronomical Union, 11(S321), 295-295. doi: 10.1017/ S1743921316009315
- Rampazzo et al. (2017) Rampazzo, R., Mazzei, P., Marino, A., Uslenghi, M., Trinchieri, G., Wolter, A. 2017, Astron. Astrophys., 602, A97
- Reduzzi & Rampazzo (1995) Reduzzi, L., Rampazzo, R. 1995 Astrophyiscal Letters & Comm., 30, 1
- Ryan-Weber, Webster & Starvely-Smith (2003) Ryan-Weber, E., Webster, R., Starvely-Smith, L.. 2003, Mem. R. Astron. Soc., 343, 1195
- Salim et al. (2007) Salim, S. et al. 2007, Astrophys. J. Suppl. Ser., 173, 267
- Sandage & Tammann (1987) Sandage, A., Tammann, G. A. 1987, Carnegie Institution of Washington Publication, Washigton: Carnegie Intistution 2nd edition
- Schawinski et al. (2007) Schawinski, K., Kaviraj, S., Khochfar, S., Yoon, S.-J., et al. 2007, ApJS, 173, 512
- (64) Schneider, M., Frenk, C., Cole, S., 2012, Cosmol. Astropart. Phys., 5, 30
- Serra & Oosterloo (2010) Serra, P., Oosterloo, T.A. 2010, Mem. R. Astron. Soc., 401, L29
- Sérsic (1968) Sérsic, J. L. (ed.) 1968, Atlas de Galaxias Australes (Cordoba, Argentina: Observatorio Astronomico)
- Soares et al. (1995) Soares, D. S. L., de Souza, R. E., de Carvalho, R. R., Couto da Silva, T. C. 1995, Astron. Astrophys. Suppl. Ser., 110, 371
- (68) Struck, C. 2011, Galaxy Collisions. Forging New Worlds from Cosmic Crashes, Springer
- (69) Tandon, S. N., Hutchings, J. B., Ghosh, S. K., Subramaniam, A., Koshy, G. et al. 2017, Journal of Astrophysics and Astronomy, 38, 28
- Thilker et al. (2007) Thilker, D. A.; Bianchi, L., Meurer, G., Gil de Paz, A., Boissier, S. et al. 2010, Astrophys. J. Suppl. Ser., 173, 538
- Thilker (2008) Thilker, D. A., Galaxies in the Local Volume, Astrophysics and Space Science Proceedings, ISBN 978-1-4020-6932-1. Springer Netherlands, 2008, p. 109
- Thilker et al. (2010) Thilker, D. A., Bianchi, L., Schiminovich, D., Gil de Paz, A., Seibert, M. et al. 2010, Astrophys. J., 714, L171
- Trinchieri et al. (2015) Trinchieri, G., Rampazzo, R., Mazzei, P. Marino, A., Wolter, A. 2015, Mem. R. Astron. Soc., 449, 3021
- Tully (1988) Tully R. B., 1988, Nearby Galaxies Catalog. Cambridge Univ. Press, Cam- bridge
- Turner (1976) Turner, E.L. 1976, Astrophys. J., 208, 20
- Vega et al. (2010) Vega, O., Bressan, A., Panuzzo, P., Rampazzo, R., Clemens, M.S. et al. 2010, ApJ, 721, 1090
- Vulcani et al. (2014) Vulcani, B., Bamford, S. P., Häußler, B., et al. 2014, Mem. R. Astron. Soc., 441, 1340
- Weigel et al. (2017) Weigel, A.K., Schawinski, K., Caplar, N. et al. 2017, Astrophys. J., 845, 145
- Werk et al. (2010) Werk, J. K., Putman, M. E., Meurer, G. R., et al. 2010, Astron. J., 139, 279
- Wyder et al. (2007) Wyder, T.K., Martin, D. C., Schiminovich, D., Seibert, M. et al. 2007, Astrophys. J. Suppl. Ser., 173, 293
- Yi et al. (2005) Yi S. K., Yoon, S.-J., Kaviraj, S., Deharveng, J.-M., Rich, R. M. et al., 2005, Astrophys. J., 619, L111
- Yi et al. (2011) Yi, S.K., Lee, J., Sheen, Y-K., Jeong, H., Suh, H., Oh, K. 2011, Astrophys. J. Suppl. Ser., 195, 22