Galaxy And Mass Assembly (GAMA): impact of the group environment on galaxy star formation
Abstract
We explore how the group environment may affect the evolution of star-forming galaxies. We select 1197 Galaxy And Mass Assembly (GAMA) groups at and analyze the projected phase space (PPS) diagram, i.e. the galaxy velocity as a function of projected group-centric radius, as a local environmental metric in the low-mass halo regime . We study the properties of star-forming group galaxies, exploring the correlation of star formation rate (SFR) with radial distance and stellar mass. We find that the fraction of star-forming group members is higher in the PPS regions dominated by recently accreted galaxies, whereas passive galaxies dominate the virialized regions. We observe a small decline in specific SFR of star-forming galaxies towards the group center by a factor with respect to field galaxies. Similar to cluster studies, we conclude for low-mass halos that star-forming group galaxies represent an infalling population from the field to the halo and show suppressed star formation.
1 Introduction
The properties of galaxies, such as their star formation rate (SFR), morphology and stellar mass, correlate strongly with the galaxy number density in the surrounding Universe (Dressler, 1980; Kodama & Smail, 2001; Smith et al., 2005; Peng et al., 2010). This correlation is most visible in galaxy clusters, which are the largest halos that have had time to virialize in the Universe, where their cores are found to be dominated by passive galaxies while in their outskirts there is a higher fraction of star-forming galaxies (e.g., Balogh et al., 1997; Hashimoto et al., 1998; Poggianti et al., 1999; Couch et al., 2001). The observed correlation with cluster-centric radius reveals radial distance as a crude metric of the time since a particular galaxy has entered the cluster environment - with core galaxies being early virialized cluster members and populations at large radii being increasingly dominated by recently infalling galaxies. However, equating radial distance to the time since infall is a blunt approach as this does not take into account projection effects, and washes out potentially important populations such as, first-pass infalling galaxies which happen to be in the cluster core at the time of observation, backsplash galaxies which have already traversed the cluster core and are observed close to the maximum distance before their second infall, and galaxies which have already undergone multiple passes but appear at large radii. A more sophisticated approach is to classify galaxies based on both position and velocity, considering their dynamical state within the cluster. The projected phase space diagram (PPS), i.e. the galaxy velocity as a function of projected cluster-centric radius, has been extensively used to separate the different cluster populations and to study their spectral features (e.g., Pimbblet et al., 2006; Mahajan et al., 2011; Oman et al., 2013; Muzzin et al., 2014; Jaffé et al., 2015; Oman & Hudson, 2016). These works show that galaxy spectral properties correlate strongly with their position on the PPS. Finally, there is evidence for a relationship between SFR and galaxy density and projected cluster-centric radius, in the sense that star-forming galaxies in clusters show suppressed star formation with respect to field galaxies, and many studies have been dedicated to understanding the underlying physics driving this suppression in galaxy clusters (e.g., Lewis et al., 2002; Gómez et al., 2003; von der Linden et al., 2010; Paccagnella et al., 2016).
The PPS and the role of the environmental mechanisms in affecting galaxy star formation are less clear in low-mass halos, i.e. galaxy groups with mass . Galaxy groups are the most common galaxy environment (Eke et al., 2005) and their study offers an important tool for a more complete understanding of galaxy formation and evolution. Similar to cluster environments, several works have found that the galaxy morphology correlates with group-centric distance and local galaxy density for group galaxies (e.g., Postman & Geller, 1984; Tran et al., 2001; Girardi et al., 2003; Brough et al., 2006; Wetzel et al., 2012). Moreover, the analysis of massive clusters revealed that the low fraction of star-forming galaxies observed in the dense cluster centers persists in group-like regions beyond the cluster sphere of influence (Lewis et al., 2002). This scenario opens the possibility that galaxies are “pre-processed” in groups before they fall into clusters according to a hierarchical scenario of structure formation (Hou et al., 2014; Haines et al., 2015; Roberts & Parker, 2017).
Many studies probed the impact of the group environment on star formation in galaxies, spanning a range of epochs (e.g., Balogh et al., 2011; McGee et al., 2011; Hou et al., 2013; Mok et al., 2014; Davies et al., 2016a). In particular, Rasmussen et al. (2012) and Ziparo et al. (2013) analyzed how the SFR of galaxies in nearby groups depends on radius and local galaxy density. However, they reached conflicting results since Rasmussen et al. (2012) found a decrease by % of the specific SFR (sSFR=SFR/) as a function of the projected group-centric distance for star-forming galaxies in 23 nearby galaxy groups () relative to the field, while Ziparo et al. (2013) observed no decline in SFR and sSFR for the whole galaxy population in 22 groups in the redshift range . Wijesinghe et al. (2012) and Schaefer et al. (2016) both considered group and field galaxies together but obtained opposing conclusions. Wijesinghe et al. (2012) showed that the SFRlocal galaxy density relation is only visible when both the passive and star-forming galaxy populations are considered together, implying that the stellar mass has the largest impact on the current SFR of a galaxy while any environmental effect is not detectable. On the contrary, Schaefer et al. (2016) found that star formation rate gradients in star-forming galaxies are steeper in dense environments with a reduction in total SFR. Finally, the environmental processes responsible for SFR suppression in the halos and the quenching time-scales are still an issue (Wetzel et al., 2013; McGee et al., 2014; Wetzel et al., 2014; Peng et al., 2015; Grootes et al., 2017).
We focus on galaxy groups, considering also clusters to compare the results, and we study the high-fidelity Galaxy And Mass Assembly (GAMA) group catalog since it contains a statistically high number of groups. The aim of this paper is to explore whether and how group environments affect star formation properties of member galaxies. We use the PPS as a proxy for environment and we expand the investigation of the PPS to halos with lower mass and containing a higher number of galaxies with respect to previous works on groups, in order to probe whether the results found for clusters are seen for lower-mass halos.
This paper is organized as follows. We present our GAMA group sample, the galaxy member selection and spectral classification in Section 2. In Section 3 we analyze the distributions of passive and star-forming galaxies in radial space, projected phase space and velocity space. We investigate the SFRs of star-forming galaxies as a function of the projected group-centric radius and galaxy stellar mass. Finally, we discuss our results in Section 4 and conclude in Section 5. Throughout this work we assume , and as cosmological parameters.
2 Dataset
2.1 The Galaxy And Mass Assembly survey
Galaxy And Mass Assembly (GAMA; Driver et al., 2011; Hopkins et al., 2013; Liske et al., 2015) is a spectroscopic and photometric survey of 300,000 galaxies, down to mag and over 286 degrees2 divided in 5 regions called G02, G09, G12, G15 and G23. The redshift range of the GAMA sample is with a median value of . The majority of the spectroscopic data were obtained using the AAOmega multi-object spectrograph at the Anglo-Australian Telescope. GAMA incorporates previous spectroscopic surveys such as the SDSS (York et al., 2000), 2dFGRS (Colless et al., 2001, 2003), WiggleZ (Drinkwater et al., 2010) and the Millennium Galaxy Catalog (MGC; Liske et al., 2003; Driver et al., 2005).
The multi-wavelength photometric and spectroscopic data of GAMA cover 21 photometric bands spanning from the far-ultraviolet to the far-infrared, and the spectra cover an observed wavelength range from 3750 to 8850 Å at a resolution of . Considering the combination of the wide area, the high spectroscopic completeness (98.5% in the equatorial regions; Liske et al., 2015), the high spatial resolution and the broad wavelength coverage, the GAMA survey provides a unique tool to investigate the formation and evolution of galaxies in groups.
We use the following already measured optical data: positions and spectroscopic redshifts (Driver et al., 2011; Liske et al., 2015), equivalent widths and fluxes of the H, H, [OIII], H and [NII] spectral lines (Hopkins et al., 2013; Gordon et al., 2017), SFR estimators based on the H emission lines (Gunawardhana et al., 2013) and on the full spectral energy distribution fits (Davies et al., 2016b; Driver et al., 2016), and stellar masses (Taylor et al., 2011).
2.2 Group sample
Our group sample is based on the GAMA Galaxy Group Catalog (G3C; Robotham et al., 2011), built on a Friends-of-Friends (FoF) algorithm which examines both radial and projected comoving distances to assess overlapping galactic halo membership. The radial comoving distances used in the FoF algorithm are derived from the redshifts obtained from the GAMA II data described in Liske et al. (2015). The group catalog contains 23654 groups (each with 2 members) and 184081 galaxies from the G09, G12 and G15 regions observed down to mag. We select 1197 GAMA galaxy groups by:
-
•
Group edge: 1.
-
•
Redshift: .
-
•
Membership: at least 5 members.
-
•
Mass: .
The respective reasons for these chosen criteria are:
-
•
The group edge quantifies the fraction of the group within the survey volume and group edge=1 means that the group is entirely contained within the survey and we are not just considering a fraction of it.
-
•
The minimum is selected in order to minimize the impact of aperture effects due to the 2′′ fiber used to collect the GAMA galaxy spectra (Kewley et al., 2005). Only 45 groups are present at . We choose as the maximum redshift because beyond this the detection of the H line is unreliable due to the presence of the telluric OH forest at the red end of the spectra. In addition, this allows us to probe low-mass galaxies with stellar mass over the whole redshift range.
- •
-
•
As group mass estimator we use which is defined as the mass of a spherical halo with a mean density that is 200 times the critical cosmic density at the halo redshift. This study is focused on galaxy groups with , but we also include clusters with ( in order to compare the results for low-mass halos with those for the high-mass ones. There is no known sharp mass cutoff that divides clusters and groups, but we assume as a partition mass. is estimated using the raw group velocity dispersions calculated by Robotham et al. (2011) and according to the relation of Munari et al. (2013):
(1) where and is the Hubble parameter. We calculate the group radius as the radius of a sphere with mass .
2.3 Selection of member galaxies
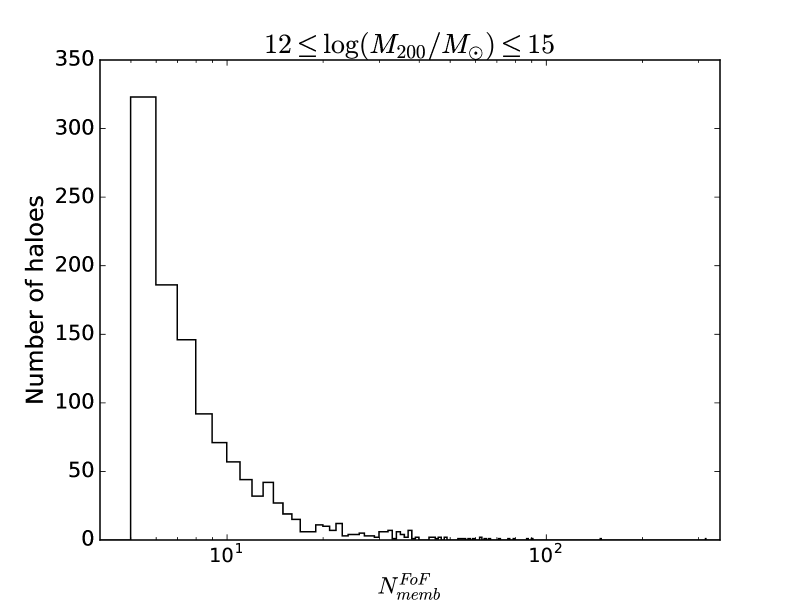
The FoF algorithm tends to assign group membership to galaxies in the very central region of groups, out to . However, we want to investigate the star formation in galaxies out to a projected distance of , and close to the group redshift. In this Section, we outline our method, which uses both galaxy redshifts and projected distance from the group center, as well as , to extend the existing spectroscopically confirmed FoF group membership out to .
The reasons for probing such a large group-centric distance are twofold. First, we would like to compare our results with those of Rasmussen et al. (2012), who probed out to . Second, analyzing out to such large radii (i.e. ) means that we naturally include a benchmark sample of field galaxies that are well beyond the regions where processes related to the group environment are expected to be important. This benchmark sample will be drawn from the same redshift and galaxy stellar mass distributions as the group galaxies, and will therefore allow for an unbiased comparison to be made between the group galaxy properties and those of the benchmark field sample. One potential concern is that of stellar mass-segregation, which may lead to more massive galaxies being preferentially found close to the group center. However, Kafle et al. (2016) showed that there is negligible mass-segregation as a function of radius in the GAMA groups out to 2.
In order to extend our study to 9, probing the group surroundings, we consider also galaxies in the same redshift range, but not assigned to groups by the FoF algorithm. We assign additional galaxies to groups in a manner similar to Smith et al. (2004), i.e. by minimizing the parameter as a function of redshift and projected location. Each additional galaxy is assigned only to one group and the parameter is proportional to the logarithm of the probability that a galaxy is a member of a group assuming that the group velocity distribution is a Gaussian:
| (2) |
where c is the speed of light, is the group velocity dispersion, and are the redshift of the galaxy and the group respectively, is the projected distance between the galaxy and the group center, and is fixed at 9. The group center is estimated by Robotham et al. (2011) as the coordinates of the central galaxy defined with an iterative procedure.
In order to investigate low- and high-mass halos separately and to perform a robust member selection, we define two samples according to their mass: groups with and clusters with . For each sample we stack both FoF members as well as the galaxies assigned to halos out to 9 and we calculate the infall velocities, i.e. the maximum allowed line-of-sight velocities for group/cluster galaxies. We define only galaxies within these velocities as members. Figure 2 shows the stacked PPS diagram in normalized units, i.e. as a function of where the galaxy rest-frame velocity is defined as:
| (3) |
The infall velocity, , is estimated as a function of , by considering separately galaxies in each range of halo mass and assuming a Navarro-Frenk-White mass density profile (Navarro et al., 1996):
| (4) |
where is the circular velocity scaled by and given by:
| (5) |
The concentration parameter is estimated according to the relation of Dolag et al. (2004) and depends on the median and of the group sample:
| (6) |
where and for our cosmological model. The relationship between the concentration and the halo mass justifies our choice to determine the infall velocities for the two samples with different ranges: we use , and , for groups and clusters, respectively. In Figure 2 the different curves indicate the infall velocities for groups and clusters.
| Groups | 1104 | 10027 | 11762 | 21789 | |
|---|---|---|---|---|---|
| Clusters | 93 | 2774 | 5200 | 7974 |
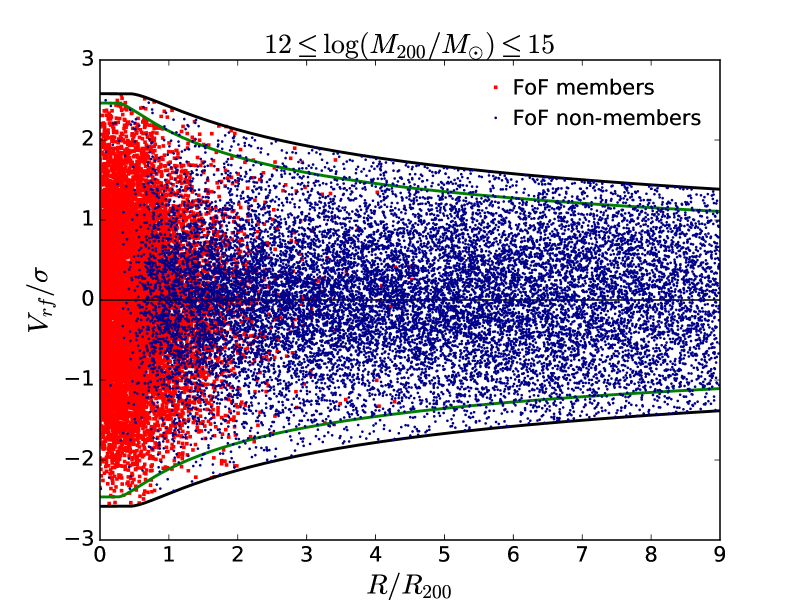
Table 1 lists the halo mass range of each sample (), the number of halos (), the number of members identified by the FoF algorithm (), the number of galaxies not selected by the algorithm but assigned to a halo () and the resulting total number of members ().
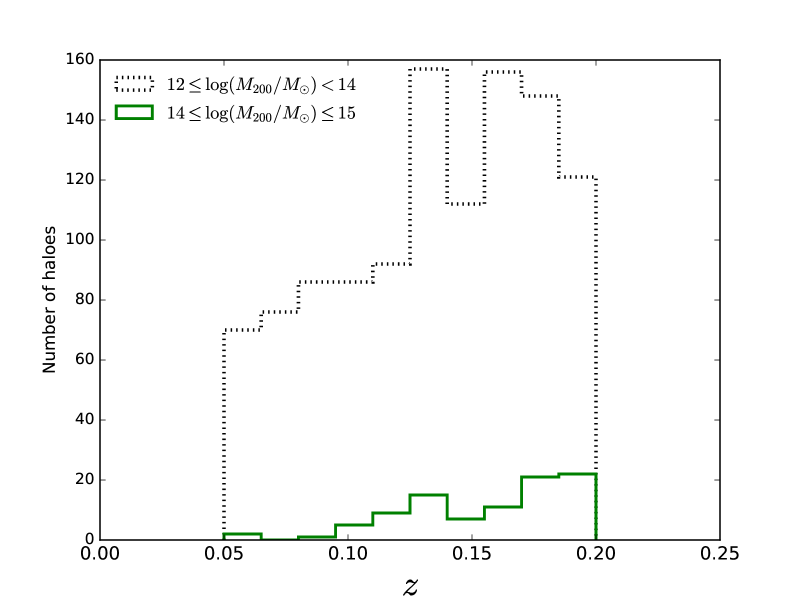
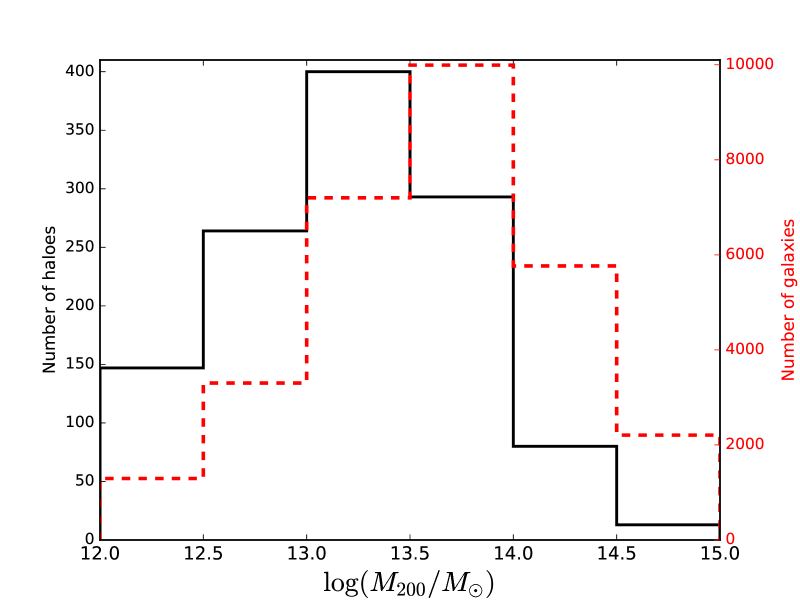
Figure 3 shows the number of halos as a function of redshift and halo mass. Groups and clusters show peaks at higher redshift because in that range a larger volume of targets has been probed. Most halos have and the majority of member galaxies belong to these groups. In this context, this study represents a further step with respect to that of Oman & Hudson (2016), as well as of von der Linden et al. (2010), since both of these works contain low-mass halos with masses , but their satellite numbers are dominated by galaxies in clusters with mass , while we are probing the group mass regime with the majority of galaxies.
2.4 Spectroscopic classification of galaxies
Our primary aim in this paper is to investigate the properties of star-forming galaxies in groups. We select member galaxies with stellar mass to include both low- and high-mass galaxies and we identify the passive and star-forming populations. We consider only galaxies with a signal-to-noise ratio (S/N) per pixel greater than 3 in the 63836536 Å window.
Our spectroscopic classification is outlined below. First, we divide galaxies into two broad categories according to the features of their spectra: absorption- and emission-line galaxies. The absorption-line spectra are typical of galaxies dominated by an old and evolved stellar population, while emission-line galaxies can be characterized by young and new stars, by an AGN or by a Low-Ionization Nuclear Emission-line Region that have low levels of star formation activity and old stars. We use the convention of positive equivalent widths (EW) for emission lines and a negative sign for the absorption features. Since the H emission line is an excellent tracer of star formation, we use it to select emission-line galaxies. We follow Cid Fernandes et al. (2011) and define emission-line galaxies as those having Å, and add the additional criteria that the S/N of the [NII] line must be larger than 3. The latter criterion helps to guard against spurious single line detections. Absorption-line galaxies are all the remaining ones with Å (see Table 2).
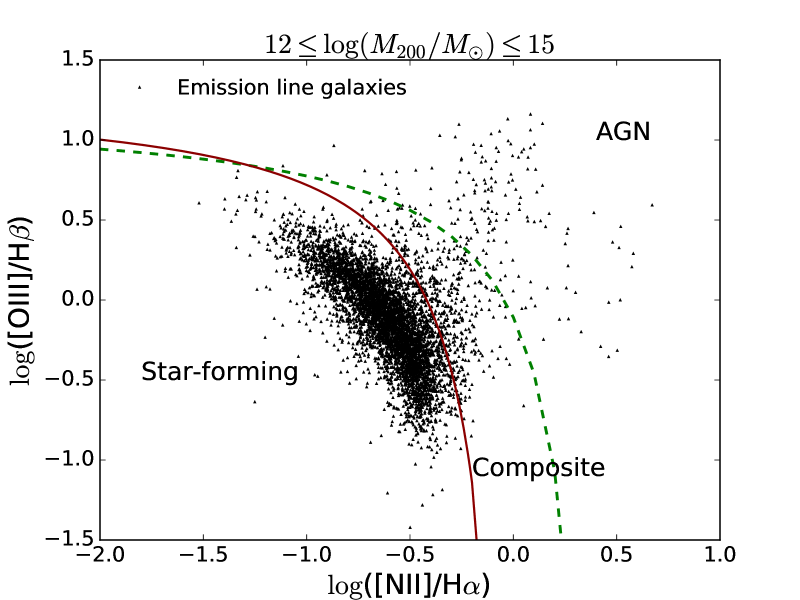
From the absorption-line galaxies we select the passive members with Å in order to avoid the contamination from H strong and post-starburst galaxies (Goto, 2007; Paccagnella et al., 2017). However, the H strong and post-starburst galaxies are % and their inclusion does not affect our results. For the emission-line galaxies a further classification is needed to determine whether the emission is due to star formation, since the Å cut does not necessarily imply that a galaxy is star-forming, as it includes AGN and composite systems. Thus, the emission-line galaxies with of the H, [OIII], H and [NII] lines are classified as star-forming or AGN according to the Kauffmann et al. (2003) prescription, based on the flux ratios [NII]/H and [OIII]/H:
| (7) |
We choose the Kauffmann et al. (2003) classification in order to avoid contamination by composite galaxies. Prior to measuring the line ratios, the fluxes of the Balmer lines are corrected for the underlying stellar absorption in the following way (Hopkins et al., 2003):
| (8) |
where is the observed H flux with or , and Å is the constant correction factor (Hopkins et al., 2013; Gordon et al., 2017). Figure 4 displays the BPT (Baldwin, Phillips, & Terlevich, 1981) diagram, i.e. log([OIII]/H) versus log([NII]/H), used to identify star-forming galaxies and AGNs. There are 7990 galaxies where either H or H or [OIII] had . For those cases, we follow Cid Fernandes et al. (2011) and define star-forming galaxies as those with log([NII]/H).
Table 2 summarizes the constraints for the spectroscopic classification of member galaxies (Col. from 2 to 5) and reports their numbers (Col. 6).
| Spectral type | EW H | EW H | log([NII]/H) | S/N [NII] | |
|---|---|---|---|---|---|
| Å | Å | ||||
| Absorption | 12000 | ||||
| Emission | 13500 | ||||
| Passive | 10663 | ||||
| Star-forming | 10239 | ||||
| AGN/Composite | 3261 |
2.5 SFR estimators
In this work we analyze whether and how the star formation activity is affected by the group/cluster environment with respect to the field. We use two different estimators of SFR taking advantage of the spectroscopic and photometric GAMA data. The spectroscopic estimator only probes the emission lines in the aperture of the fiber and measures an “instantaneous” SFR, as it probes star formation from the last 10 Myrs. The photometric SFR measurement includes light from the whole galaxy and is averaged over a longer timescale. Therefore, the two probes are complementary (see Davies et al., 2016b for the details on scaling relations).
The spectroscopic SFR () is calculated assuming a Salpeter (1955) initial mass function:
| (9) |
where the H luminosity (LHα) is estimated following the procedure outlined in Hopkins et al. (2003) and Gunawardhana et al. (2013). Briefly, the galaxy’s -band magnitude is used in combination with the fibre-based EW(H) to determine an approximately aperture-corrected, total LHα. A constant 2.5Å is added to EW(H) to account for stellar-absorption, and the Balmer decrement is used to correct for dust obscuration (see Gunawardhana et al., 2011, 2013 for a detailed explanation).
The photometric SFR () is obtained with the spectral energy distribution (SED)-fitting code MAGPHYS (da Cunha et al., 2008; Davies et al., 2016b; Driver et al., 2016), which compares models of ultraviolet/optical/near-infrared spectral templates of stellar populations and mid-/far-infrared templates of dust emission with the observed photometry of a given galaxy, determining the overall best fit stellar+dust template. The MAGPHYS code provides an estimate of the galaxy SFR averaged over the last 100 Myr using a best-fitting energy balance model, where the obscuration-corrected SED is determined by balancing energy absorbed in the ultraviolet/optical with that emitted in the infrared.
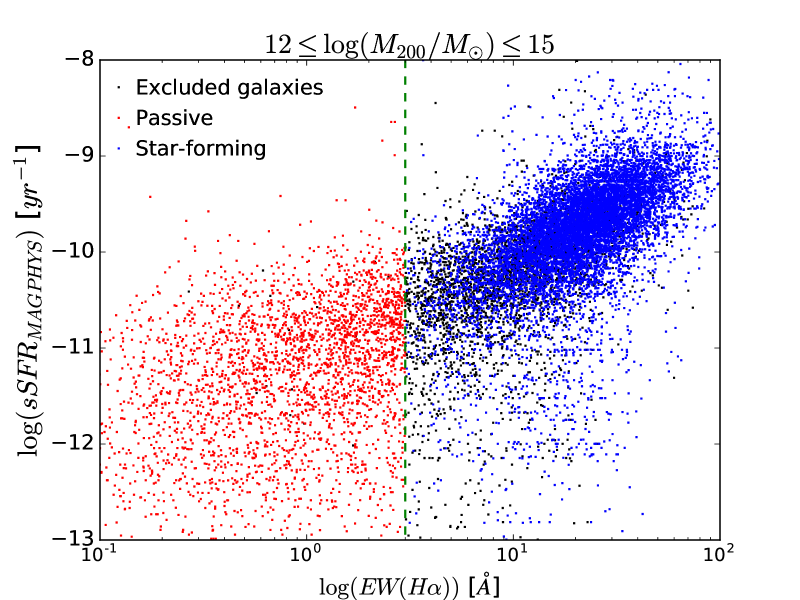
Both the spectroscopic and photometric SFR estimators are calculated for the star-forming galaxies spectroscopically selected according to the procedure described in Section 2.4. We show in Figure 5 how the Å cut affects the selection of star-forming galaxies and maps into a limit in sSFR. We use since it is not possible to measure for all galaxies.
3 ANALYSIS AND RESULTS
We explore how the group environment may affect galaxy star-forming properties. In order to pursue our aim we use two different samples of halos and galaxies, i.e. the Full Sample and the Restricted Sample. Their features are described below and are summarized in Table 3:
-
•
Full Sample: this includes all the halos at and galaxies with out to 9 (see Sections 2.22.4).
-
•
Restricted Sample: this is characterized by smaller ranges in redshift and stellar mass compared to the Full Sample. It includes halos at and galaxies with out to 9. The chosen and limits correspond to a completeness of % according to Figure 6 of Taylor et al. (2011) (the grey line refers to our galaxy sample observed down to mag), who estimated the GAMA stellar mass completeness limit as a function of redshift.
We perform the following analyses using the Full Sample and the Restricted Sample in the Sections listed in Table 3 for the following reasons:
-
•
In Sections 3.1 and 3.2 we compare the fractions of passive (PAS) and star-forming (SF) galaxies in radial and projected-phase spaces, respectively. We use the Restricted Sample. The stellar mass cut is necessary because we measure fractions for different galaxy populations, i.e passive fraction and star-forming fraction. At a given -band magnitude, blue star-forming galaxies have a lower stellar mass when compared with red passive galaxies. Therefore, probing a galaxy stellar mass range that is not complete would bias against passive galaxies for a given stellar mass, and affect the measured fractions.
-
•
In Section 3.3 we investigate the distribution of the passive and star-forming populations in velocity space. We use the Full Sample, without taking into account the stellar mass completeness limit since we are not studying galaxy fractions.
-
•
In Sections 3.43.8 we focus only on star-forming galaxies of the Full Sample and study the dependence of star formation rate (SFR) on group-centric radius and galaxy stellar mass.
| Full | Restricted | |
|---|---|---|
| 1197 | 679 | |
| 0.050.20 | 0.050.15 | |
| Sections | 3.33.6 | 3.13.2 |
3.1 Fractions of galaxies in radial space
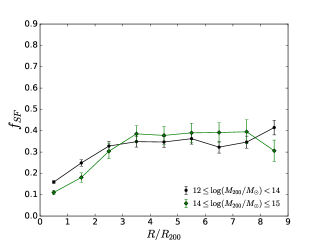
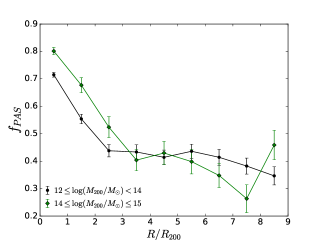
Different works confirm that group galaxy properties such as morphology, color and spectral type all correlate with group-centric distance (e.g., Carlberg et al., 2001; Tran et al., 2001; Girardi et al., 2003; Wetzel et al., 2012; Hou et al., 2014). In order to test the presence of the passive versus star-formingradius relation, we consider the Restricted Sample and explore the fractions of star-forming and passive galaxies as a function of group-centric radius in Figure 6. The fraction of each galaxy population is estimated with respect to the total galaxy sample containing passive, H strong, post-starburst, star-forming galaxies and AGNs/composites. Table 4 lists the numbers of halos (), star-forming () and passive () galaxies for each range.
Figure 6 shows that the fraction of passive galaxies strongly decreases from the inner halo regions to in clusters and in groups (right panel), while the fraction of star-forming galaxies increases out to the same radii (left panel). Beyond these distances both the fractions remain approximately constant. In groups the passive fraction declines by a factor at 2.5, while the star-forming fraction rises by a factor at the same radius. The maximum is at 9 because of the selected range in stellar mass and there are fewer star-forming objects with higher mass (Taylor et al., 2015). Our results confirm that the passive versus star-formingradius relation is present in galaxy groups as well as in the more studied cluster environment and that star-forming galaxies are mainly found in the halo outskirts, in agreement with previous works (e.g., Whitmore et al., 1993; Tran et al., 2001; Girardi et al., 2003; Goto et al., 2003; Brough et al., 2006; Wetzel et al., 2012; Hou et al., 2014; Fasano et al., 2015).
| 643 | 1486 | 3543 | |
| 36 | 465 | 1294 |
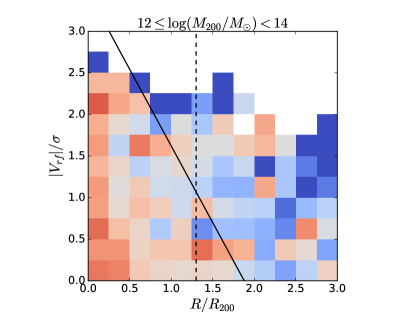
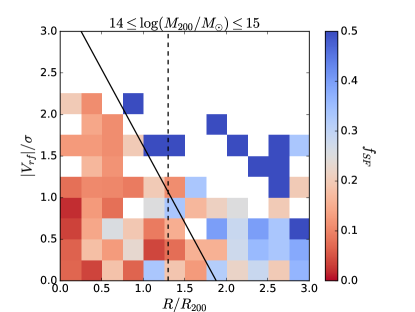
3.2 Fractions of galaxies in projected phase space
In order to obtain correlated information on galaxy velocity and position, we study the projected phase space (PPS) diagram, i.e. versus , as environment proxy and we explore the PPS distributions of the different galaxy populations at the group mass regime. Previous works have investigated the PPS for clusters alone (Mahajan et al., 2011; Muzzin et al., 2014; Jaffé et al., 2015), and for samples with both cluster and group mass halos (Oman et al., 2013; Oman & Hudson, 2016). Our GAMA sample allows us to probe the group halo mass range alone () with a larger number of galaxies and to determine whether the segregation of star-forming and passive galaxies observed in the PPS of clusters also exists in groups.
We use the Restricted Sample and Figure 7 shows the 2D histograms of star-forming fractions binned in the PPS. We consider the radial range out to 3 in order to study a region containing galaxies which can be or have been physically affected by the group/cluster environment. We plot the separation line (solid black) between the region that are likely to have a high fraction of recently accreted galaxies (i.e., the infalling population) and the region with galaxies that have been inside the group/cluster for an extended period of time (i.e., the virialized population), found by Oman et al. (2013) for simulated groups and clusters. We adapt the galaxy velocityradius relation of Oman et al. (2013) to:
| (10) |
where the factors of and 1.25 convert from the 3D velocity dispersion and the virial radius used by Oman et al. (2013) to our 1D and , i.e. and 111In the relation the value 1.25 does not compare in Oman et al. (2013), but it has been provided to us via private communication from Mike Hudson. at . We also plot the separation line (dashed black) between the virialized and infalling populations established by Mahajan et al. (2011) at .
The virialized region at small radii is characterized by low values of and it is most populated by passive galaxies, whereas for the infalling region at large distances the fraction of star-forming galaxies is higher. This result is observed for both groups and clusters. We conclude that the segregation of star-forming and passive galaxies in the PPS already detected in clusters and in combined group and cluster samples is also observable in low-mass halos alone.
3.3 Segregation in velocity space
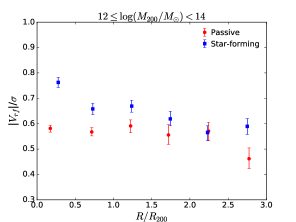
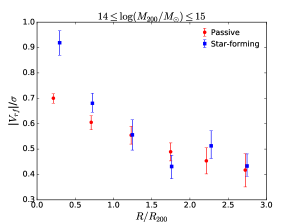
The analysis of the star-forming and passive fractions in the radial space reveals a segregation of the two galaxy populations in both groups and clusters. However, previous works focusing on clusters also observed galaxy color/spectral type and luminosity segregation when considering velocity space alone (e.g., Biviano et al., 1992, 1997; Adami et al., 1998; Ribeiro et al., 2013; Haines et al., 2015; Barsanti et al., 2016). These effects have been also detected in groups, but are less studied (e.g., Girardi et al., 2003; Lares et al., 2004; Ribeiro et al., 2010).
We consider the Full Sample and analyze the kinematics of galaxies, comparing the velocity profiles of the different populations as a function of radius and galaxy stellar mass. Figure 8 shows the median / versus plot within to focus on the physically bound group/cluster region. There is a galaxy spectral type segregation in the velocity space: star-forming galaxies within tend to have higher / values when compared with the passive galaxy population. In order to check if this difference is statistically significant we apply the test. For groups (clusters) we find that the / distributions of 2690 (620) star-forming and 5203 (1882) passive galaxies within are different at the % confidence level (c.l.). We confirm the segregation of the passive and star-forming populations in the velocity space at both the group and cluster mass regimes.
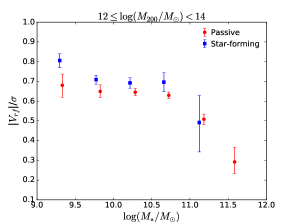
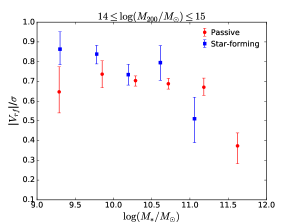
Finally, we explore a possible galaxy stellar mass segregation in velocity space, since Kafle et al. (2016) observed no segregation with radius for GAMA group galaxies. We use the Full Sample and plot in Figure 9 the median / versus for star-forming and passive galaxies of groups and clusters. We restrict this analysis within 1 since this segregation is likely associated to secondary relaxation processes within the halo virialized regions (Binney & Tremaine, 2008). From the GAMA halos of the Full Sample we exclude the central galaxies which have been defined by Robotham et al. (2011). The inclusion of these galaxies could potentially bias our results. The selection of Robotham et al. (2011) is generally robust, but it is based on an iterative procedure and it is possible that this method chooses the incorrect central galaxy, thus there may be some contamination.
Massive passive galaxies show evidence of segregation in the velocity space: more massive galaxies have lower / values than the low-mass ones. However, this effect does not appear to be a statistically significant result for massive star-forming galaxies likely due to the low numbers of these galaxies with high (Taylor et al., 2015). For both the galaxy populations in groups, the trend in velocity remains approximately constant for galaxies with and then it decreases for . For clusters the velocity decline starts at about and for passive and star-forming galaxies, respectively. To statistically evaluate this segregation, we apply the Spearman test in order to estimate the correlation between / and for galaxies with a flat trend and for those with a decline in velocity separately. Tables 5 reports the -values for star-forming and passive galaxies in each range. Massive passive galaxies have smaller -values implying a strong segregation. On the other hand, only the massive star-forming galaxies in clusters present a marginally statistically significant decrease in velocity. Finally, for both the galaxy populations low-mass galaxies do not show a correlation between / and and have a flat trend in velocity.
These results are in agreement with a scenario where the dynamical friction mechanism is able to slow the orbital motion of galaxies in groups and clusters (Biviano et al., 1992; Adami et al., 1998; Girardi et al., 2003; Ribeiro et al., 2010, 2013; Barsanti et al., 2016). In agreement with the previous works, we confirm that this deceleration is a function of galaxy mass: for more massive galaxies, the higher the deceleration. We also observe that this segregation is stronger for passive galaxies than for star-forming galaxies.
| Type | ||||
|---|---|---|---|---|
| PAS | 2596 | 0.6533 | ||
| PAS | 1942 | 0.0004 | ||
| SF | 1942 | 0.1260 | ||
| SF | 111 | 0.6689 | ||
| PAS | 1031 | 0.8876 | ||
| PAS | 604 | 0.0313 | ||
| SF | 462 | 0.1312 | ||
| SF | 12 | 0.0513 |
3.4 SFRradius relation for star-forming galaxies
The studies of the radial, projected phase and velocity spaces suggest that the star-forming group galaxies are recently accreted and represent an infalling population from the field to the halo. This result is well established for star-forming cluster galaxies which also show suppressed star formation with respect to the field (e.g., Lewis et al., 2002; Gómez et al., 2003; von der Linden et al., 2010; Paccagnella et al., 2016). However, this latter observation is less clear for star-forming galaxies in groups. In the Sections 3.43.8 we explore whether and how the group environment affects the star formation properties, analyzing the dependence of SFR on radius and stellar mass.
We focus on star-forming galaxies of the Full Sample within 9, probing a similar stellar mass and radial range as Rasmussen et al. (2012) and including a benchmark sample of field galaxies (see Section 2.3). The star-forming galaxies are spectroscopically selected as described in the Section 2.4. For these galaxies we define in the Section 2.5 two different SFR estimators, i.e. and , based on the spectroscopic and photometric properties of galaxies, respectively. Table 6 lists the number of star-forming galaxies with available and . There are fewer star-forming galaxies with measured when compared with those with available : 460 galaxies have no measured because their spectra are not flux calibrated and/or it is not possible to make obscuration corrections.
| 7213 | 7568 | |
| 2565 | 2670 |
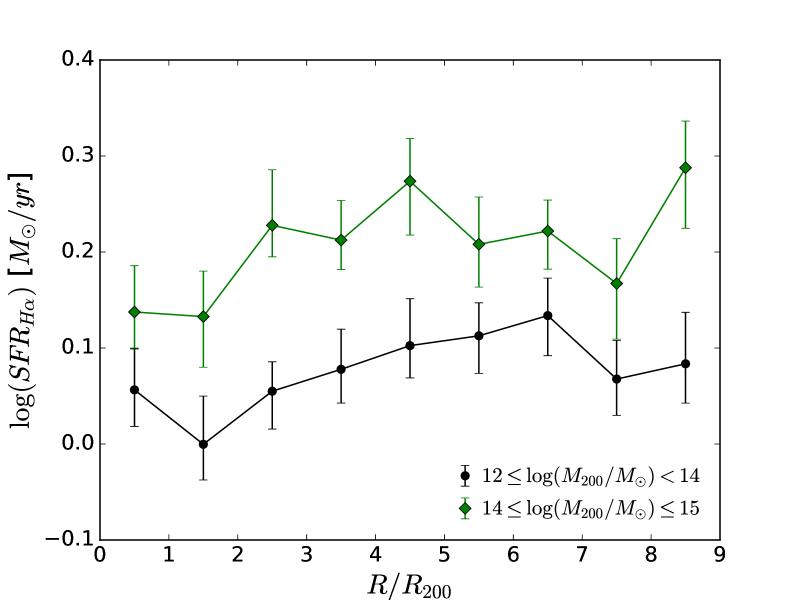
Figure 10 shows median values versus for star-forming galaxies associated to groups and clusters. For clusters the remains constant over and then decreases towards the cluster center. For groups there is a continuous decrease of the star formation activity from the group outskirts to the inner regions. The shift towards higher for clusters with respect to groups is due to the fact that at higher redshift we observe halos with higher mass and SFR (see the upper panel of Figure 3).
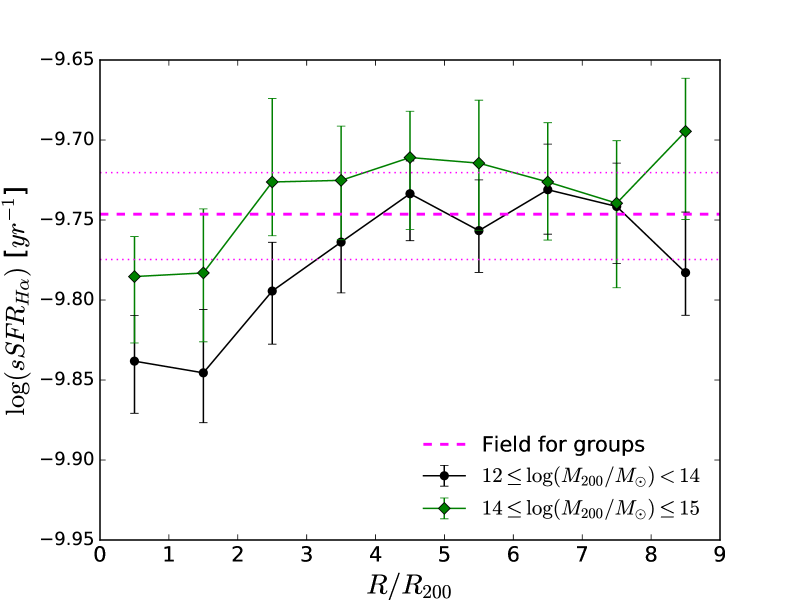
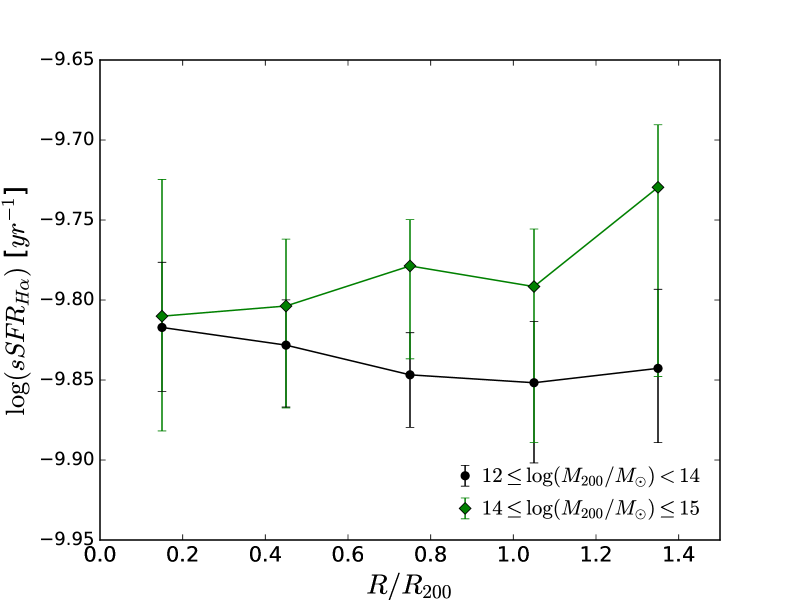
We also analyze the dependence of specific star formation rate (sSFR=SFR/) on radius. Figure 11 confirms the decline of at towards the cluster centers and it shows a drop in at for star-forming galaxies in groups, which is not evident in Figure 10 where there is a continuous decline. In order to compare the star formation in the group environment with that in the field, we consider star-forming galaxies at as group members and those with as field galaxies. Comparing the median value for the field (magenta line) with that for star-forming group galaxies in the bin (black point), it can be seen that the declines by a factor of . These results are in agreement with the outcome of Rasmussen et al. (2012), who found a decrease in the sSFR as a function of the projected group-centric distance for star-forming galaxies in nearby groups.
In order to compare our analysis with that of Ziparo et al. (2013), we consider galaxies only out to in Figure 12, since Ziparo et al. (2013) investigated the SFR and sSFRradius relation within this radial distance. Figure 12 shows that there is no statistically significant correlation between and at small radii for groups, but the uncertainties are large. This results agrees with Ziparo et al. (2013).
The decline in star formation towards the inner group/cluster-centric radii is present when we consider the group/cluster infalling regions and their surroundings out to , in agreement with Rasmussen et al. (2012). However, similar to Ziparo et al. (2013) there is no decline in sSFR for group/cluster galaxies within which is the region most affected by the group/cluster environment. This might indicate that the SFR of group galaxies is stopped slowly, since the suppression is too slow to be detected at small radii. As a consequence, the quenching timescale probably is of the order of few Gyr and comparable to the group crossing time. This result is in agreement with the conclusion of von der Linden et al. (2010), who proposed a scenario in which star formation is quenched slowly.
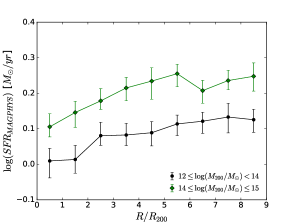
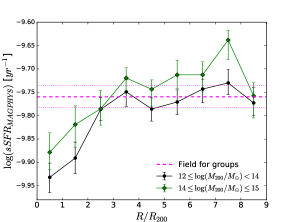
Finally, we explore the dependence of and on projected group-centric radius for star-forming galaxies in Figure 13. The left panel shows for clusters a continuous decrease in towards the cluster center, whereas for groups there is a drop at . The decline in star formation is more evident in the right panel which illustrates a decreasing trend in at for both groups and clusters. Comparing the median value for star-forming group galaxies in the bin (black point) with that for the associated field galaxies at (magenta line), it can be seen that the declines by a factor of from the field to the group inner region. The results obtained using the SED-fitting code MAGPHYS as a star formation estimator are in agreement with those based on the H emission lines within the uncertainties.
Throughout the different analyses of this Section we have used three different radial limits, i.e. , , and . The primary motivation behind selecting these limits was to allow us to compare with previous studies such as Rasmussen et al. (2012) and Ziparo et al. (2013). However, these radial limits may also be interpreted in a more physical manner. The region is where a large fraction of galaxies that have encountered the group/cluster core reside (Gill et al., 2005; Mahajan et al., 2011), and where we observe the strongest signature of suppressed star formation. The range is the region containing bound populations that may infall onto the group/cluster, in agreement with Rines et al. (2013) who found that the maximum radius enclosing gravitationally bound galaxies to the halo is at . This region is mainly populated by star-forming galaxies. Finally, beyond there is the unbound field population.
In conclusion, a decline is observed in star formation activity with decreasing group-centric radius for star-forming galaxies. The radius at which this decline begins differs for the various measures of SFR and for the different halo mass ranges probed. Generally, the decline begins in the radial range . This distance is well beyond the radius at which the group environment is expected to play a role in quenching star formation, and is also beyond the apocentric distance to which a galaxy will travel after its first passage of the group (Gill et al., 2005). Thus, this may indicate that galaxies are being pre-processed in very low-mass groups not detected in the GAMA catalog, or in the filament environment (e.g., Alpaslan et al., 2016), prior to falling into the GAMA-identified halos. However, many factors can conspire to spread the point at which the SFR decline starts out in radius. For example, uncertainties in the estimate of are likely to be relatively high due to the propagation of the errors in the velocity dispersion/mass measurements used to define the values. These uncertainties will broaden any sharp decline in radius.
3.5 sSFR histograms
The radius relationship in Figure 11 shows that for groups the median declines with radius towards the group center, but is relatively flat for . This behavior at large radius is to be expected, since galaxies at these radii are too distant to have been affected by the group environment, and are highly unlikely to have traversed the group. Thus, we use the star-forming galaxies with as a benchmark field sample for comparison to group member galaxies at .
A consequence of the sSFR suppression in halos is that there may be a low sSFR galaxy population in cluster and group environments that may not be seen in the field, or there may be an overall shift in the SFR of all star-forming galaxies. In this context, we investigate the sSFR distributions in clusters, groups and in the field in order to check for possible differences. We investigate in order to avoid the effect of the known stellar mass relationship with SFR and since we are interested in comparing measurements of star formation from the last 10 Myrs. We analyze sSFR histograms since the median distills a lot of information about the distributions of the sSFRs at a given radius into one point. The median of the sSFR distribution of group galaxies can be different with respect to that of field galaxies because there can be an overall shift in the total distribution of groups with respect to the field. However, another reason is that the sSFR distribution of groups can have a significant asymmetry, or bi-modality, that produces a difference in the medians. Investigating the sSFR histograms, we explore if there is a difference of the sSFR distribution in groups with respect to that in the field and we try to understand which of the above reasons for different medians is the case. Discerning between these two causes is important because it may give clues about the mechanisms responsible for the sSFR quenching.
We consider the Full Sample. Group/cluster members are defined as galaxies with and having lower or equal to the infall velocities (see Figure 2). We build the field as populated by galaxies with in and outside the curves representing the infall velocities, i.e. with , in order to obtain a statistically high number of field galaxies. Moreover, each field galaxy is assigned to a halo according to the procedure of Smith et al. (2004) described in Section 2.3. We produce two separate field samples for each of the range. Finally, the star-forming galaxy population in each field is selected by applying the same method described in Section 2.5 and used to define star-forming members. The numbers of star-forming group and cluster galaxies in each radial bin and in the respective field are reported in Table 7.
We apply the KolmogorovSmirnov test (KS test; Lederman 1984), which tests the null hypothesis that the sSFR distributions of groups/clusters and of the respective field are drawn from the same parent distribution by measuring the maximum difference between the two cumulative distribution functions. The test returns the probability of the measured difference in the two cumulative distribution functions occurring if the two samples are drawn from the same parent distribution. A smaller -value indicates that the two distributions are unlikely to be drawn from the same parent distribution. Table 8 lists the results of the KS test, comparing the sSFR distributions of group/cluster galaxies in different radial bins with the sSFR distribution of the respective field galaxies (see Table 7 for the considered number of galaxies). The results for clusters are less significant compared with those for groups likely due to the smaller cluster sample. The group SFR distributions for the ranges and and the field sSFR distribution do not belong to the same parent population. For the comparison between group galaxies in and the field, the KS test result is only marginally significant. Regarding clusters, the difference is significant for members in the radial bins , marginal for and not significant for the range closest to the field . This is in agreement with a scenario where the number of galaxies that have encountered the group/cluster core decreases beyond , while the number of infallers and line-of-sight interlopers increases. This dilutes the population of low sSFR galaxies (as seen in Figures 14 and 15), and therefore the distribution becomes more field-like at large group/cluster-centric distances.
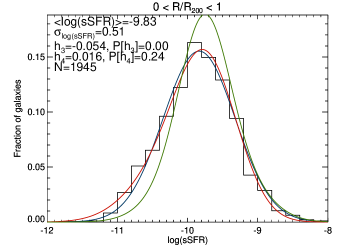
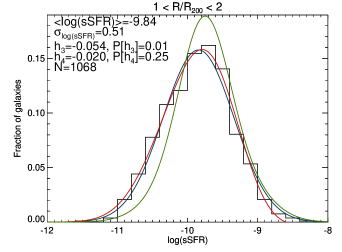
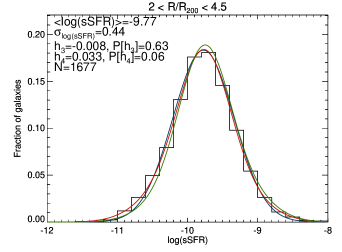
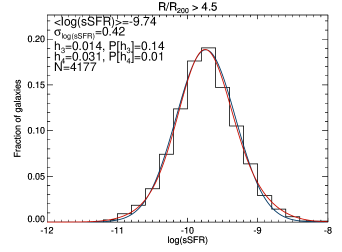
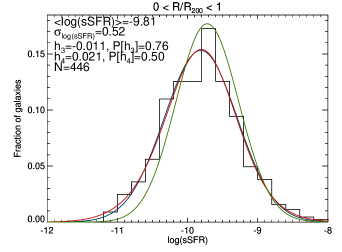
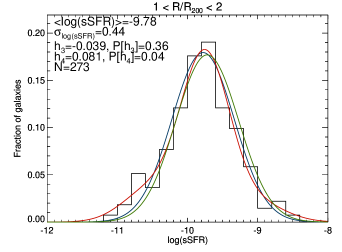
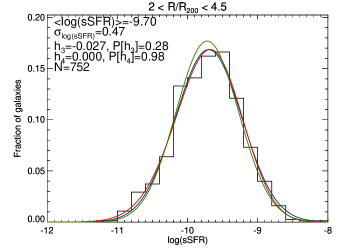
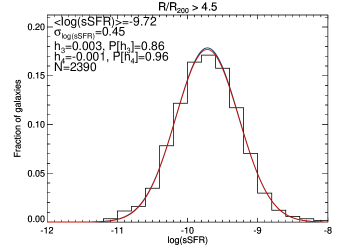
However, the KS test does not probe differences in the tails of the distributions, but it is more sensitive to the behavior of the distributions close to their median values. Thus, following the procedure of Zabludoff et al. (1993) and Owers et al. (2009), the sSFR distribution is approximated by a series of Gauss-Hermite functions up to order 4 and we estimate the strength of the asymmetric and symmetric departures from a Gaussian shape. Figures 14 and 15 show the histograms for the group/cluster star-forming galaxies in different radial ranges and in the respective field reported in Table 7, and they list the mean value (), standard deviation (), skewness () and kurtosis () with the respective -values showing the significance of these terms ( and ). The group/cluster sSFR distributions are characterized by larger and lower values compared to the associated field. Moreover, the group sSFR histograms in the radial ranges and show significant evidence for asymmetry, with for both, meaning heavier tails for the lower sSFR side of the distribution relative to a Gaussian shape. This indicates a galaxy population with suppressed sSFR in groups. We do not find significant skewness values for the cluster sSFR distributions likely because of the smaller number of clusters and galaxies therein.
| Groups | 0.01.0 | 1945 | |
| Groups | 1.02.0 | 1068 | |
| Groups | 2.04.5 | 1677 | |
| Field | 4.59.0 | 4177 | |
| Clusters | 0.01.0 | 446 | |
| Clusters | 1.02.0 | 273 | |
| Clusters | 2.04.5 | 752 | |
| Field | 4.59.0 | 2390 |
| 0.01.0 | ||
| 1.02.0 | ||
| 2.04.5 | ||
| 0.04.5 | ||
| 0.01.0 | ||
| 1.02.0 | ||
| 2.04.5 | ||
| 0.04.5 |
3.6 SFRgalaxy stellar mass relationship
Since the comparison between the sSFR distributions of star-forming group/cluster and field galaxies indicates that the median sSFRs are lower in groups/clusters than in the field, we compare the SFR relationship for group and cluster members with that for the respective field in order to check whether and how this relation changes with environment. We also analyze whether the SFR quenching is stronger for low-mass galaxies compared with the high-mass ones, since this effect has been found by several studies (e.g., von der Linden et al., 2010; Rasmussen et al., 2012; Davies et al., 2016a; Schaefer et al., 2016).
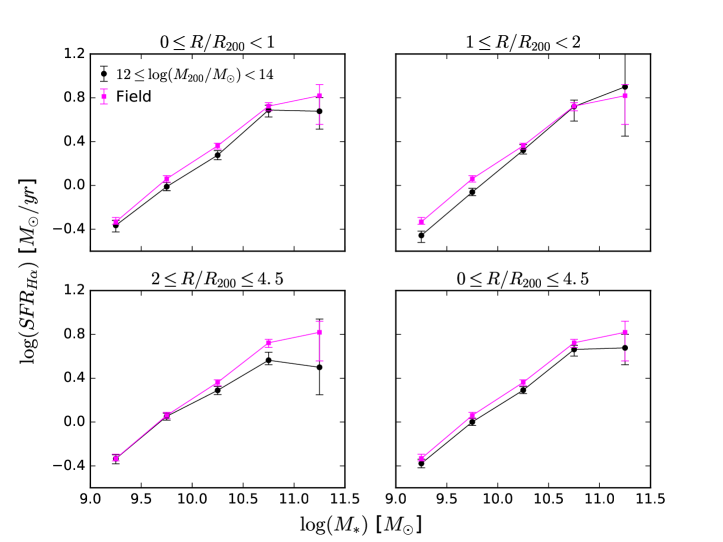
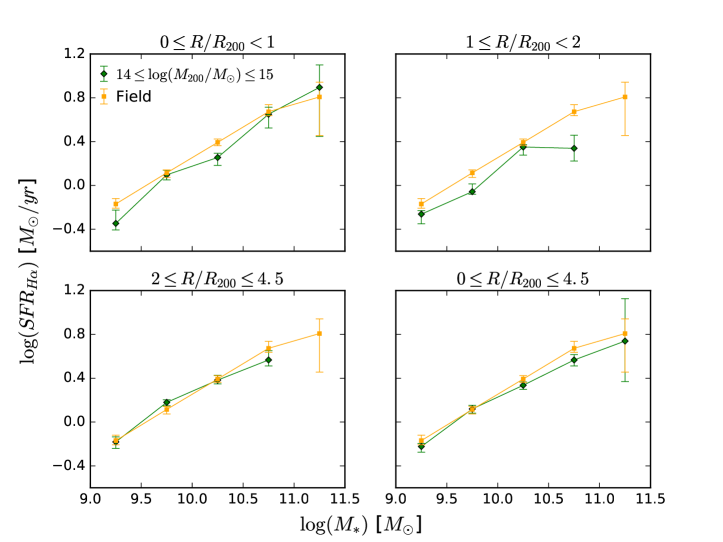
Figure 16 shows as a function of for star-forming members of the Full Sample in different radial ranges out to , respectively of groups and clusters, and for the assigned field galaxies at according to the result of Figure 11. The numbers of galaxies for each range in and are reported in Table 7. We plot the median SFR relations binning galaxies with in 5 bins, since the range is populated by too few galaxies. In all cases the SFR goes up as increases, forming the well known and often named star formation main sequence (Daddi et al., 2007; Noeske et al., 2007).
At fixed stellar mass, star-forming group/cluster members are shifted towards lower median values of when compared with the values of the respective field galaxies. This means that there is a galaxy population with suppressed star formation activity in groups/clusters which is less noticeable in the field.
The difference between the median of cluster members and field galaxies becomes less visible as the radial range is closer to the field and for the range there is no shift between the SFR relationships in the cluster and field environments. This highlights the presence of an infalling star-forming population in clusters from the field. Our outcomes for clusters are in agreement with those shown in Figures 1 and 2 of Paccagnella et al. (2016), who compared the SFR relationship of star-forming galaxies in 31 OMEGAWINGS clusters at with that of the field, considering only galaxies with . They found a population of quenched star-forming galaxies in these clusters that is rare in the field, suggesting that the transition from star-forming to passive occurs on a sufficiently long timescale to be observed. However, Paccagnella et al. (2016) observed a more evident transition galaxy population with respect to our result, likely due to the fact that their sample contains many more cluster galaxies than ours, i.e. 9242 and 1546 cluster galaxies in total, respectively.
We do not find a stronger suppression in SFR for low-mass galaxies in both groups and clusters, but the shift in SFR occurs over the whole range in . Rasmussen et al. (2012) found that the SFR suppression is strongest for low-mass galaxies with , while the decline is negligible for high-mass galaxies with . They detected a dependence of the sSFRradius relation on that we do not observed in our data. However, we do not probe galaxies with as Rasmussen et al. (2012), and a future inclusion of these galaxies could be crucial for shedding light on this effect.
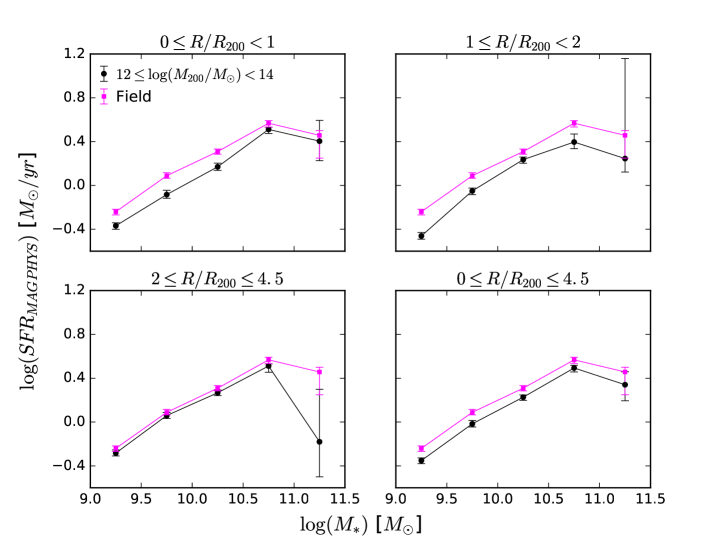
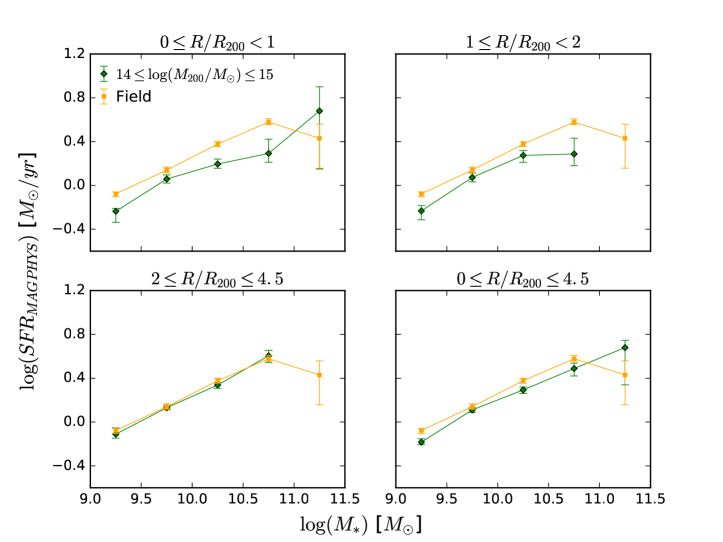
Finally, we consider the photometric estimators of the star formation activity, plotting median values of in bins, in order to compare these results with those obtained using . We use star-forming galaxies with available in the same radial and halo mass ranges as in the previous case and in the respective field. Figures 17 shows that there is a change of the SFR relation with the environment, i.e. groups versus field and clusters versus field, respectively. At fixed galaxy stellar mass, group galaxies are characterized by lower values of SFR compared to field galaxies. This result agrees with that found in Figure 16 and confirms that the star-forming galaxies in groups have lower SFRs than those in the field. The strongest difference in SFR between the benchmark field sample and the group galaxies occurs in the smallest radius bin and then the shift becomes less marked with increasing radius. The same finding is observed in both Figures 16 and 17 for cluster members and field galaxies. As in the case of , we do not observe a stronger SFR quenching for low-mass galaxies in groups and clusters. In conclusion, we observe the same outcomes using or .
4 Discussion
We investigate the distributions of passive and star-forming galaxies in radial space, projected phase space and velocity space (Sections 3.13.3, respectively). The analysis of the radial space confirms that the inner regions of groups/clusters are mainly populated by passive galaxies, whereas the outskirts are dominated by star-forming galaxies. This finding is in agreement with many previous works in both groups and clusters (e.g., Postman & Geller, 1984; Carlberg et al., 2001; Lewis et al., 2002; Girardi et al., 2003; Gómez et al., 2003; von der Linden et al., 2010; Wilman & Erwin, 2012). The study of the group/cluster PPS reveals that the passive and star-forming populations inhabit different regions. Star-forming galaxies generally inhabit regions which simulations have shown to be dominated by infalling galaxies, while passive galaxies inhabit regions of the PPS dominated by the virialized populations. Mahajan et al. (2011) observed this segregation of galaxy populations for a nearby SDSS cluster sample, Oman et al. (2013) and Oman & Hudson (2016) for a sample made by both groups and clusters, but we find the same result for a sample composed only by low-mass halos. Finally, the galaxy type segregation in velocity space is well investigated for cluster galaxies (e.g., Biviano et al., 1997; Haines et al., 2015; Barsanti et al., 2016), but it is less studied in the group environment. We confirm for groups the kinematic segregation of galaxy populations also observed by Lares et al. (2004) for 2dFGRS low-mass halos. We find galaxy stellar mass segregation in velocity space: more massive galaxies are slower down and this effect is stronger for passive galaxies compared with the star-forming population. Since the most massive galaxies are thought to be the most luminous ones, these results are in agreement with those of Biviano et al. (1992) and Girardi et al. (2003) who found luminosity segregation in velocity space for the brightest passive galaxies in nearby clusters and groups, respectively. We note that Kafle et al. (2016) observed no galaxy stellar mass segregation with radius for the GAMA group galaxies, while we detect this effect in velocity space. These segregations in the radial, PPS and velocity spaces strongly suggest that star-forming galaxies have been recently accreted onto groups from the surrounding field, while the passive population have resided in the group for a much longer period of time. Moreover, the galaxy stellar mass segregation suggests a picture in which the dynamical friction process slows the motion of the most massive passive galaxies.
For star-forming galaxies we observe a decline in sSFR with decreasing projected group-centric (Section 3.4) out to in agreement with the outcome of Rasmussen et al. (2012), while the absence of this sSFR-radius relationship within agrees with the conclusions of Ziparo et al. (2013). This suggests that the conflicting results observed by Rasmussen et al. (2012) and Ziparo et al. (2013) are due to the different radial range selected, i.e. out to and , respectively. The observation of SFR suppression at large group-centric radius and not within the region most directly affected by the group environment () suggests that the star formation in group galaxies is stopped slowly. As a consequence, the quenching timescale probably is of the order of few Gyr and comparable to the group crossing time.
The comparison of the sSFR distributions of star-forming group/cluster galaxies with that of the respective field (Section 3.5) shows that they do not belong to the same parent population and that there is a shift towards lower median sSFR values for the group/cluster distributions. The sSFR distributions for the inner regions of groups have a significant skewness, indicating heavier tails for the lower sSFR side of the distribution relative to a Gaussian shape and highlighting the presence of a galaxy population with suppressed sSFR in groups.
The analysis of the SFR relation (Section 3.6) suggests that there is a population of quenched star-forming galaxies in groups but not in the field, meaning that the transition from star-forming to quenched occurs on a sufficiently long timescale to be observed. This is in agreement with the conclusions of Paccagnella et al. (2016), who found a population of quenched star-forming galaxies in clusters and not in the field, implying a long timescale for the quenching process. These galaxies are mainly observed within the central regions of the halos, while the SFR relation in groups becomes more consistent with the field for the outer regions.
Finally, Rasmussen et al. (2012) found a dependence of the star formationradius relation on for groups, observing a more pronounced suppression for galaxies with . However, we do not probe galaxies with such low stellar mass and we are unable to test the SFR suppression for these low-mass galaxies.
5 Summary and conclusions
We study 1197 GAMA halos with at and we select member galaxies with (the Full Sample). We consider two different ranges in in order to analyze the SFR distributions and the PPS of galaxies in low- and high-mass halos, i.e groups with and clusters with . We divide galaxies into different spectral types, i.e. passive, star-forming and AGN/composite. We restrict the analysis of the passive and star-forming fractions to galaxies with in halos at to ensure completeness 95% (the Restricted Sample).
We study the passive and star-forming galaxy populations of the Restricted Sample in the radial and PPS spaces. We also investigate the velocity space for the Full Sample, obtaining the following results:
-
1.
The fraction of passive galaxies decreases by a factor of from the group center towards 2.5, whereas the fraction of the star-forming galaxies goes up by a factor of within the same radial distance.
-
2.
The virialized region in the PPS is dominated by passive galaxies, while the fraction of star-forming galaxies is much higher in the infalling region.
-
3.
Passive and star-forming galaxies are segregated in velocity space with the velocity profile of star-forming members higher than that of the passive ones, according to the test.
-
4.
The most massive passive galaxies are segregated in velocity according to the Spearman test.
The analysis of the star-forming galaxies of the Full Sample in the group/cluster environment leads to important outcomes which can be summarized as follows:
-
1.
The SFR of star-forming member galaxies declines towards the halo inner regions. The sSFR decreases by a factor of from the field to the halo center, and the decline starts in the range . Considering only the region within , we do not detect any change of the sSFR with radius.
-
2.
The sSFR distributions of star-forming members and field galaxies do not belong to the same parent population, according to the KS test. The group sSFR distributions for the inner radial regions show a significant evidence for asymmetry, indicating heavier tails for the lower sSFR side of the distributions relative to a Gaussian shape.
-
3.
At fixed galaxy stellar mass, star-forming members have lower SFRs compared to field galaxies.
-
4.
The SFRradius and SFR relationships agree using both H emission lines and the SED-fitting code MAGPHYS as SFR estimators.
These results suggest that the star-forming group galaxies are recently accreted and represent an infalling population from the field to the halo. The decline in SFR of star-forming galaxies with radius, coupled with their status as recent infallers, implies that the group environment quenches the star formation of the galaxies as they fall into the halo.
In conclusion, our analysis for groups reveals that many results observed for clusters are also visible in these lower-mass halos, i.e. suppression of SFR with decreasing radius, galaxy populations with low SFR, passive versus star-formingradius relation and PPS, kinematic and galaxy stellar mass segregations.
References
- Adami et al. (1998) Adami, C., Biviano, A., & Mazure, A. 1998, A&A, 331, 439
- Alpaslan et al. (2016) Alpaslan, M., Grootes, M., Marcum, P. M., et al. 2016, MNRAS, 457, 2287
- Baldwin et al. (1981) Baldwin, J. A., Phillips, M. M., & Terlevich, R. 1981, PASP, 93, 5
- Balogh et al. (1997) Balogh, M. L., Morris, S. L., Yee, H. K. C., Carlberg, R. G., & Ellingson, E. 1997, ApJ, 488, L75
- Balogh et al. (2011) Balogh, M. L., McGee, S. L., Wilman, D. J., et al. 2011, MNRAS, 412, 2303
- Barsanti et al. (2016) Barsanti, S., Girardi, M., Biviano, A., et al. 2016, A&A, 595, A73
- Binney & Tremaine (2008) Binney, J., & Tremaine, S. 2008, Galactic Dynamics: Second Edition (Princeton University Press)
- Biviano et al. (1992) Biviano, A., Girardi, M., Giuricin, G., Mardirossian, F., & Mezzetti, M. 1992, ApJ, 396, 35
- Biviano et al. (1997) Biviano, A., Katgert, P., Mazure, A., et al. 1997, A&A, 321, 84
- Brough et al. (2006) Brough, S., Forbes, D. A., Kilborn, V. A., & Couch, W. 2006, MNRAS, 370, 1223
- Carlberg et al. (2001) Carlberg, R. G., Yee, H. K. C., Morris, S. L., et al. 2001, ApJ, 563, 736
- Cid Fernandes et al. (2011) Cid Fernandes, R., Stasińska, G., Mateus, A., & Vale Asari, N. 2011, MNRAS, 413, 1687
- Colless et al. (2001) Colless, M., Dalton, G., Maddox, S., et al. 2001, MNRAS, 328, 1039
- Colless et al. (2003) Colless, M., Peterson, B. A., Jackson, C., et al. 2003, ArXiv Astrophysics e-prints, astro-ph/0306581
- Couch et al. (2001) Couch, W. J., Balogh, M. L., Bower, R. G., et al. 2001, ApJ, 549, 820
- da Cunha et al. (2008) da Cunha, E., Charlot, S., & Elbaz, D. 2008, MNRAS, 388, 1595
- Daddi et al. (2007) Daddi, E., Dickinson, M., Morrison, G., et al. 2007, ApJ, 670, 156
- Davies et al. (2016a) Davies, L. J. M., Robotham, A. S. G., Driver, S. P., et al. 2016a, MNRAS, 455, 4013
- Davies et al. (2016b) Davies, L. J. M., Driver, S. P., Robotham, A. S. G., et al. 2016b, MNRAS, 461, 458
- Dolag et al. (2004) Dolag, K., Bartelmann, M., Perrotta, F., et al. 2004, A&A, 416, 853
- Dressler (1980) Dressler, A. 1980, ApJ, 236, 351
- Drinkwater et al. (2010) Drinkwater, M. J., Jurek, R. J., Blake, C., et al. 2010, MNRAS, 401, 1429
- Driver et al. (2005) Driver, S. P., Liske, J., Cross, N. J. G., De Propris, R., & Allen, P. D. 2005, MNRAS, 360, 81
- Driver et al. (2011) Driver, S. P., Hill, D. T., Kelvin, L. S., et al. 2011, MNRAS, 413, 971
- Driver et al. (2016) Driver, S. P., Wright, A. H., Andrews, S. K., et al. 2016, MNRAS, 455, 3911
- Eke et al. (2005) Eke, V. R., Baugh, C. M., Cole, S., et al. 2005, MNRAS, 362, 1233
- Fasano et al. (2015) Fasano, G., Poggianti, B. M., Bettoni, D., et al. 2015, MNRAS, 449, 3927
- Gill et al. (2005) Gill, S. P. D., Knebe, A., & Gibson, B. K. 2005, MNRAS, 356, 1327
- Girardi et al. (2003) Girardi, M., Rigoni, E., Mardirossian, F., & Mezzetti, M. 2003, A&A, 406, 403
- Gómez et al. (2003) Gómez, P. L., Nichol, R. C., Miller, C. J., et al. 2003, ApJ, 584, 210
- Gordon et al. (2017) Gordon, Y. A., Owers, M. S., Pimbblet, K. A., et al. 2017, MNRAS, 465, 2671
- Goto (2007) Goto, T. 2007, MNRAS, 381, 187
- Goto et al. (2003) Goto, T., Okamura, S., Sekiguchi, M., et al. 2003, PASJ, 55, 757
- Grootes et al. (2017) Grootes, M. W., Tuffs, R. J., Popescu, C. C., et al. 2017, AJ, 153, 111
- Gunawardhana et al. (2011) Gunawardhana, M. L. P., Hopkins, A. M., Sharp, R. G., et al. 2011, MNRAS, 415, 1647
- Gunawardhana et al. (2013) Gunawardhana, M. L. P., Hopkins, A. M., Bland-Hawthorn, J., et al. 2013, MNRAS, 433, 2764
- Haines et al. (2015) Haines, C. P., Pereira, M. J., Smith, G. P., et al. 2015, ApJ, 806, 101
- Hashimoto et al. (1998) Hashimoto, Y., Oemler, Jr., A., Lin, H., & Tucker, D. L. 1998, ApJ, 499, 589
- Hopkins et al. (2003) Hopkins, A. M., Miller, C. J., Nichol, R. C., et al. 2003, ApJ, 599, 971
- Hopkins et al. (2013) Hopkins, A. M., Driver, S. P., Brough, S., et al. 2013, MNRAS, 430, 2047
- Hou et al. (2014) Hou, A., Parker, L. C., & Harris, W. E. 2014, MNRAS, 442, 406
- Hou et al. (2013) Hou, A., Parker, L. C., Balogh, M. L., et al. 2013, MNRAS, 435, 1715
- Jaffé et al. (2015) Jaffé, Y. L., Smith, R., Candlish, G. N., et al. 2015, MNRAS, 448, 1715
- Kafle et al. (2016) Kafle, P. R., Robotham, A. S. G., Lagos, C. d. P., et al. 2016, MNRAS, 463, 4194
- Kauffmann et al. (2003) Kauffmann, G., Heckman, T. M., Tremonti, C., et al. 2003, MNRAS, 346, 1055
- Kewley et al. (2001) Kewley, L. J., Dopita, M. A., Sutherland, R. S., Heisler, C. A., & Trevena, J. 2001, ApJ, 556, 121
- Kewley et al. (2005) Kewley, L. J., Jansen, R. A., & Geller, M. J. 2005, PASP, 117, 227
- Kodama & Smail (2001) Kodama, T., & Smail, I. 2001, MNRAS, 326, 637
- Lares et al. (2004) Lares, M., Lambas, D. G., & Sánchez, A. G. 2004, MNRAS, 352, 501
- Lederman (1984) Lederman, W. 1984, Handbook of applicable mathematics. Vol.6,A: Statistics; Vol.6,B: Statistics
- Lewis et al. (2002) Lewis, I., Balogh, M., De Propris, R., et al. 2002, MNRAS, 334, 673
- Liske et al. (2003) Liske, J., Lemon, D. J., Driver, S. P., Cross, N. J. G., & Couch, W. J. 2003, MNRAS, 344, 307
- Liske et al. (2015) Liske, J., Baldry, I. K., Driver, S. P., et al. 2015, MNRAS, 452, 2087
- Mahajan et al. (2011) Mahajan, S., Mamon, G. A., & Raychaudhury, S. 2011, MNRAS, 416, 2882
- McGee et al. (2011) McGee, S. L., Balogh, M. L., Wilman, D. J., et al. 2011, MNRAS, 413, 996
- McGee et al. (2014) McGee, S. L., Bower, R. G., & Balogh, M. L. 2014, MNRAS, 442, L105
- Mok et al. (2014) Mok, A., Balogh, M. L., McGee, S. L., et al. 2014, MNRAS, 438, 3070
- Munari et al. (2013) Munari, E., Biviano, A., Borgani, S., Murante, G., & Fabjan, D. 2013, MNRAS, 430, 2638
- Muzzin et al. (2014) Muzzin, A., van der Burg, R. F. J., McGee, S. L., et al. 2014, ApJ, 796, 65
- Navarro et al. (1996) Navarro, J. F., Frenk, C. S., & White, S. D. M. 1996, ApJ, 462, 563
- Noeske et al. (2007) Noeske, K. G., Faber, S. M., Weiner, B. J., et al. 2007, ApJ, 660, L47
- Oman & Hudson (2016) Oman, K. A., & Hudson, M. J. 2016, MNRAS, arXiv:1607.07934
- Oman et al. (2013) Oman, K. A., Hudson, M. J., & Behroozi, P. S. 2013, MNRAS, 431, 2307
- Owers et al. (2009) Owers, M. S., Nulsen, P. E. J., Couch, W. J., Markevitch, M., & Poole, G. B. 2009, ApJ, 692, 702
- Paccagnella et al. (2016) Paccagnella, A., Vulcani, B., Poggianti, B. M., et al. 2016, ApJ, 816, L25
- Paccagnella et al. (2017) —. 2017, ArXiv e-prints, arXiv:1703.03204
- Peng et al. (2015) Peng, Y., Maiolino, R., & Cochrane, R. 2015, Nature, 521, 192
- Peng et al. (2010) Peng, Y.-j., Lilly, S. J., Kovač, K., et al. 2010, ApJ, 721, 193
- Pimbblet et al. (2006) Pimbblet, K. A., Smail, I., Edge, A. C., et al. 2006, MNRAS, 366, 645
- Poggianti et al. (1999) Poggianti, B. M., Smail, I., Dressler, A., et al. 1999, ApJ, 518, 576
- Postman & Geller (1984) Postman, M., & Geller, M. J. 1984, ApJ, 281, 95
- Rasmussen et al. (2012) Rasmussen, J., Mulchaey, J. S., Bai, L., et al. 2012, ApJ, 757, 122
- Ribeiro et al. (2013) Ribeiro, A. L. B., Lopes, P. A. A., & Rembold, S. B. 2013, A&A, 556, A74
- Ribeiro et al. (2010) Ribeiro, A. L. B., Lopes, P. A. A., & Trevisan, M. 2010, MNRAS, 409, L124
- Rines et al. (2013) Rines, K., Geller, M. J., Diaferio, A., & Kurtz, M. J. 2013, ApJ, 767, 15
- Roberts & Parker (2017) Roberts, I. D., & Parker, L. C. 2017, MNRAS, 467, 3268
- Robotham et al. (2011) Robotham, A. S. G., Norberg, P., Driver, S. P., et al. 2011, MNRAS, 416, 2640
- Salpeter (1955) Salpeter, E. E. 1955, ApJ, 121, 161
- Schaefer et al. (2016) Schaefer, A. L., Croom, S. M., Allen, J. T., et al. 2016, MNRAS, arXiv:1609.02635
- Smith et al. (2005) Smith, G. P., Treu, T., Ellis, R. S., Moran, S. M., & Dressler, A. 2005, ApJ, 620, 78
- Smith et al. (2004) Smith, R. J., Hudson, M. J., Nelan, J. E., et al. 2004, AJ, 128, 1558
- Taylor et al. (2011) Taylor, E. N., Hopkins, A. M., Baldry, I. K., et al. 2011, MNRAS, 418, 1587
- Taylor et al. (2015) —. 2015, MNRAS, 446, 2144
- Tran et al. (2001) Tran, K.-V. H., Simard, L., Zabludoff, A. I., & Mulchaey, J. S. 2001, ApJ, 549, 172
- von der Linden et al. (2010) von der Linden, A., Wild, V., Kauffmann, G., White, S. D. M., & Weinmann, S. 2010, MNRAS, 404, 1231
- Wetzel et al. (2012) Wetzel, A. R., Tinker, J. L., & Conroy, C. 2012, MNRAS, 424, 232
- Wetzel et al. (2013) Wetzel, A. R., Tinker, J. L., Conroy, C., & van den Bosch, F. C. 2013, MNRAS, 432, 336
- Wetzel et al. (2014) —. 2014, MNRAS, 439, 2687
- Whitmore et al. (1993) Whitmore, B. C., Gilmore, D. M., & Jones, C. 1993, ApJ, 407, 489
- Wijesinghe et al. (2012) Wijesinghe, D. B., Hopkins, A. M., Brough, S., et al. 2012, MNRAS, 423, 3679
- Wilman & Erwin (2012) Wilman, D. J., & Erwin, P. 2012, ApJ, 746, 160
- York et al. (2000) York, D. G., Adelman, J., Anderson, Jr., J. E., et al. 2000, AJ, 120, 1579
- Zabludoff et al. (1993) Zabludoff, A. I., Franx, M., & Geller, M. J. 1993, ApJ, 419, 47
- Ziparo et al. (2013) Ziparo, F., Popesso, P., Biviano, A., et al. 2013, MNRAS, 434, 3089