Low Rank plus Sparse Decomposition of ODFs for Improved Detection of Group-level Differences and Variable Correlations in White Matter
Abstract
A novel approach is presented for group statistical analysis of diffusion weighted MRI datasets through voxelwise Orientation Distribution Functions (ODF).
Recent advances in MRI acquisition make it possible to use high quality diffusion weighted protocols (multi-shell, large number of gradient directions) for routine in vivo study of white matter architecture. The dimensionality of these data sets is however often reduced to simplify statistical analysis. While these approaches may detect large group differences, they do not fully capitalize on all acquired image volumes. Incorporation of all available diffusion information in the analysis however risks biasing the outcome by outliers.
Here we propose a statistical analysis method operating on the ODF, either the diffusion ODF or fiber ODF. To avoid outlier bias and reliably detect voxelwise group differences and correlations with demographic or behavioral variables, we apply the Low-Rank plus Sparse () matrix decomposition on the voxelwise ODFs which separates the sparse individual variability in the sparse matrix whilst recovering the essential ODF features in the low-rank matrix .
We demonstrate the performance of this ODF approach by replicating the established negative association between global white matter integrity and physical obesity in the Human Connectome dataset. The volume of positive findings (, 227cm3) agrees with and expands on the volume found by TBSS (17cm3), Connectivity based fixel enhancement (15cm3) and Connectometry (212cm3). In the same dataset we further localize the correlations of brain structure with neurocognitive measures such as fluid intelligence and episodic memory.
The presented ODF approach will aid in the full utilization of all acquired diffusion weightings leading to the detection of smaller group differences in clinically relevant settings as well as in neuroscience applications.
Keywords: Diffusion MRI, Diffusion Spectrum Imaging, Orientation Distribution Function, Low-Rank plus Spare decomposition, White Matter, Group-level difference, Human Connectome Protocol, Episodic Memory, Fluid Intelligence, Language comprehension and decoding
©2018. This manuscript version is made available under the CC-BY-NC-ND 4.0 license http://creativecommons.org/licenses/by-nc-nd/4.0/
1 Introduction
Diffusion weighted magnetic resonance imaging (DWI MRI) samples the diffusive displacement of water and its interactions with cellular structures such as axon membranes in in vivo white matter (Callaghan, 1993; Basser and Pierpaoli, 1996). By encoding the anisotropic tissue micro-structure, DWI MRI provides insight in the complex white matter tract architecture (Wedeen et al., 2012; Fernandez-Miranda et al., 2012). The crossing fibers translate in each voxel to Orientation Distribution Functions (ODF (Callaghan, 1993)), captured by detailed High Angular Resolution Diffusion Imaging (HARDI, (Tuch et al., 2002)) methods such as Diffusion Spectrum Imaging (DSI (Callaghan, 1993; Wedeen et al., 2005, 2012; Reese et al., 2009)) and Q-ball imaging (Tuch, 2004).
The long acquisition times, imposed by the large number of q-space samples needed to accomplish sufficient angular resolution, have long hindered widespread adoption of HARDI datasets in group studies (Kuo et al., 2008; Setsompop et al., 2012b). Recent developments in simultaneous multi-slice or multiband techniques (Setsompop et al., 2012a; Blaimer et al., 2013) and sequence design (Baete et al., 2015, 2016b; Baete and Boada, 2018) have however led to data acquisition times that, for the first time, make HARDI a routine viable and practical tool for clinical applications and neuroscience research. This evolution has highlighted the need for robust methodologies for statistical analysis of group ODF datasets.
A number of methods have been proposed to identify and study differences in the diffusion signals of groups of subjects. Diffusion-specific Voxel-Based analysis (VBA) methods register quantitative diffusion measures for the whole brain (Whitcher et al., 2007) or project them on a tract skeleton (Tract-Based Spatial Statistics, TBSS (Smith et al., 2006; Jbabdi et al., 2010)) or surface (Zhang et al., 2010). Most of these approaches are based on information gained from Diffusion Tensor Imaging (DTI, (Basser and Pierpaoli, 1996)), an incomplete representation of the complex intravoxel crossings in the human brain (Jeurissen et al., 2013). This incomplete representation is partially mitigated by an extension of the TBSS-method accommodating two crossing fibers (Jbabdi et al., 2010). Nevertheless, the focus of these methods on DTI makes them ill-suited to fully exploit the much higher dimensionality of ODFs. In addition, the projection based methods suffer from inaccurate tract representations and projections (Bach et al., 2014; Raffelt et al., 2015).
Other methods use tractography results to identify structurally connected fiber populations globally (Jahanshad et al., 2015; Chen et al., 2015; Raffelt et al., 2012, 2015) or locally (Yeh et al., 2016). The resulting connectivity matrices can then be used directly for statistical tests (Jahanshad et al., 2015; Chen et al., 2015; Mitra et al., 2016) or the tractograms can inform tract-specific smoothing (Raffelt et al., 2012, 2015) and enhancement of statistical maps along the tracts (Raffelt et al., 2012, 2015; Yeh et al., 2016) using Threshold-Free Cluster Enhancement approaches (TFCE, (Smith and Nichols, 2009)). Whilst these tractography based methods are powerful, they suffer from problems related to imperfections in the tractography (Jones et al., 2013; Reveley et al., 2015; Thomas et al., 2014), some limit the identified fiber directions to a predefined template (Yeh et al., 2016) and they generally miss more subtle differences in diffusion patterns conveyed in the ODF.
The most promising methods for group difference identification in diffusion MRI studies capitalize on the full dimensionality of the rich information contained in ODFs registered to a common atlas. Early work used voxelwise whole brain multivariate statistics on the coefficients of spherical harmonic representations of ODFs (Lepore et al., 2010a). The first approach to mine the high dimensionality of the whole ODF rather than a representation, applied Principal Component Analysis (PCA) to identify the defining ODF features in each voxel in a whole brain group analysis (Chen et al., 2015). Statistical analysis of the weights of the Principal Components, the PC-scores, then informs the significance of group differences (Chen et al., 2015). However, PCA is sensitive to outliers and can be easily corrupted by the individual variability of subjects (Zhou et al., 2014; Lin, 2016), reducing the power of the statistical test.
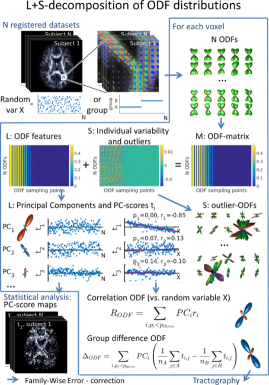
Here, we extend the previous work by isolating the essential ODF features in each voxel which are common/different within/between subject cohorts from the individual subject variability. This is achieved by replacing the PCA of ODF distributions by a Low-Rank plus Sparse () Matrix Decomposition (Candes et al., 2011; Chandrasekaran et al., 2011; Otazo et al., 2015a). The decomposition, also referred to as Robust PCA (RPCA), separates the sparse individual variability in the sparse matrix whilst recovering the essential ODF features in the low-rank matrix . Subsequently, statistical tests can focus on the defining ODF features in , thus increasing the detectability of group differences and correlations in diffusion datasets. This is then extended to a whole brain analysis using Threshold-Free Cluster Enhancement (TFCE, (Smith and Nichols, 2009)) to correct for Family Wise Errors (FWE). Although we will apply this technique here to the diffusion ODF, as derived from Q-Ball imaging (Tuch, 2004), DSI (Callaghan, 1993), or Generalized Q-Space Sampling (GQI,(Yeh et al., 2010; Yeh and Tseng, 2011)), it is also applicable to the fiber ODF (fODF) obtained by spherical deconvolution (Tournier et al., 2004).
The matrix decomposition is ideally suited for the isolation of the essential low-rank ODF features in . Indeed, the exact recovery of the and components has been mathematically proven under limited restrictions of rank and sparsity (Candes et al., 2011; Chandrasekaran et al., 2011). These mathematical properties are exploited in, amongst others, image alignment (Peng et al., 2012), denoising and background extraction in video (Bouwmans and ZahZah, 2014; Lin, 2016), segmentation of images and video (Bouwmans and ZahZah, 2014; Lin, 2016), reconstruction of diffusion MRI (Gao et al., 2013), dynamic CT (Gao et al., 2011) and MRI (Otazo et al., 2015a) images, and filtering of fMRI datasets (Otazo et al., 2015b).
The Principal Components of would identify in each voxel the essential ODF features which can be used to calculate group difference and correlation ODFs. and visualize significant group differences and correlations and serve as input for tractography similar to the local tractography visualization approach used in (Yeh et al., 2016).
In this work, we introduce the use of matrix decomposition for examining ODF group differences and correlations with biological measurements in HARDI datasets. We establish the applicability and feasibility in theoretical analysis and computer simulations. Subsequently, we demonstrate the approach by confirming the well-established negative association between global white matter integrity and physical obesity (Gianaros et al., 2013; Mueller et al., 2011; Stanek et al., 2011; Verstynen et al., 2013, 2012; Yeh et al., 2016) in a cohort of healthy Human Connectome Project volunteers. Finally, in the same cohort we explore white matter areas correlated to motor functioning, language and vocabulary comprehension and decoding, episodic memory and fluid intelligence (Smith et al., 2015; Powell et al., 2017).
2 Theory
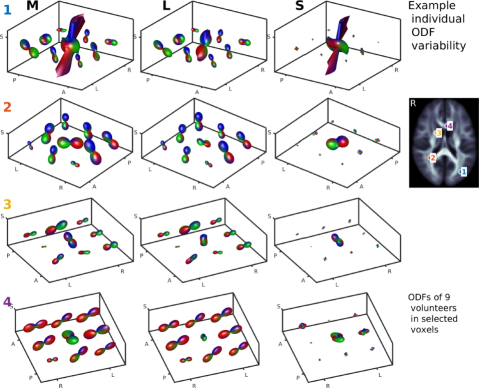
The ODFs in each voxel of a set of registered whole brain diffusion datasets can be expected to be highly correlated within that voxel (Fig. 1). Although subject subgroup differences can arise, one can assume that all ODFs will be drawn from a lower-dimensional subspace. This means that the ODF features which are common between or within subject groups will be captured in that low-dimensional subspace if we, for a moment, ignore the sparse individual variability. The low-dimension assumption of the ODFs can be translated in an assumption of low rank (Zhou et al., 2014; Lin, 2016) where the rank of a matrix is the number of linearly independent rows or columns that define a basis set to represent the matrix. Hence, once we identify the low-rank subspace of the ODFs, we can easily identify the ODF features different between subject subgroups.
Earlier work used PCA to identify the key ODF features (Chen et al., 2015). While this method does share the philosophy of determining the low-rank basis of the ODFs, PCA is easily corrupted by gross errors due to its assumption of independently and identically distributed Gaussian noise (Zhou et al., 2014). If the individual variability is non-Gaussian and strong, even a few outliers can make PCA fail (Lin, 2016).
The exact recovery of both the low-rank and sparse components of matrices (Candes et al., 2011; Chandrasekaran et al., 2011) has been of great interest in a number of applications (Peng et al., 2012; Bouwmans and ZahZah, 2014; Lin, 2016; Gao et al., 2013, 2011; Otazo et al., 2015a, b). Separating these components allows focus on either the common features or the dynamic aspects of datasets, respectively the low-rank and sparse submatrices. The matrix decomposition is commonly expressed as
| (1) | |||
with the matrix to decompose, the nuclear norm defined by the sum of all singular values as a surrogate for low-rank (Yuan and Yang, November 2009), the -norm defined by the element-wise sum of all absolute values as a surrogate for sparsity (Yuan and Yang, November 2009) and a trade-off between the sparse and low-rank components to be recovered. Recent advances have shown that both components and can be recovered exactly from (Candes et al., 2011; Yuan and Yang, November 2009; Chandrasekaran et al., 2011). In addition, recoverability is independent of the magnitude of outliers, it rather depends on the sparsity of the outliers (Lin, 2016).
The problem in (1) can be solved computationally efficient with the alternating directions method (ADM, (Yuan and Yang, November 2009)), a method based on augmented Lagrange Multipliers (Lin et al., 2010). One drawback of this algorithm is the reliance on the nuclear norm as an approximation of matrix rank. The nuclear norm is essentially an -norm of the singular values of the matrix which over-penalizes the larger singular values (Kang et al., 2015). This biased estimation is avoided by using a non-convex rank which is a closer approximation of the true matrix rank (Kang et al., 2015). Here, we use the Robust PCA via Nonconvex Rank Approximation algorithm (noncvxRPCA, (Kang et al., 2015)) which is also based on the augmented Lagrange Multipliers method but uses rather than .
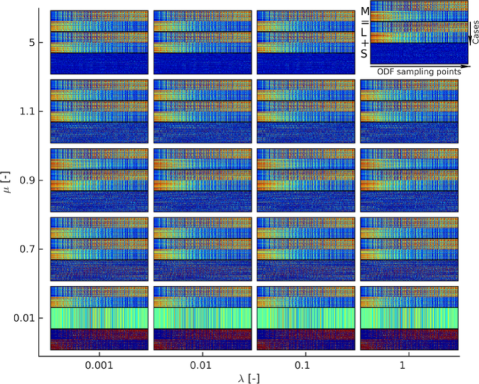
The -matrix decomposition solved using the noncvxRPCA-algorithm has two main tunable parameters: (Eq. 1) and , a Lagrange penalty parameter. The parameter balances and in (1), a higher will put more emphasis on the sparsity of while a lower will force the rank of down. Although the outcome of (1) could be expected to depend on the choice of , it was shown mathematically that a whole range of values ensure the exact recovery of and (Candes et al., 2011). A universal choice of with and , the dimensions of has been suggested (Candes et al., 2011; Lin et al., 2010) and successfully applied in a large number of applications. We have employed in this work when observing 321 vertices per ODF and 350 subjects, though a wide range of performs as desired (Fig. 2).
The variable in the augmented Lagrange multiplier optimization approach is the penalty parameter for the violation of the linear constraint during the search. Simulations (Fig. 2) suggest that a large enforces a very sparse whilst a small decreases the rank of . Hence it is important to select an appropriate value of for our application. Here, we have chosen to use in accordance with literature (Kang et al., 2015). Indeed, simulations (Fig. 2) show that values of in a range around 1 balance the sparsity of with the rank of as desired.
Mathematical analysis has shown that the and components of can be recovered exactly with a high probability when the rank of is low and is sparse (Candes et al., 2011; Yuan and Yang, November 2009; Chandrasekaran et al., 2011; Zhou et al., 2014). The limit for the average normalized rank of was identified by Candes, et al. (Candes et al., 2011) as with a positive constant. Similarly, the upper limit for the normalized cardinality, counting the non-zero elements of a matrix as a measure for sparsity, is with a positive constant (Candes et al., 2011). While the constants and are not known, simulation results (Yuan and Yang, November 2009; Candes et al., 2011) indicate that the recovery of and is valid for normalized rank values below and normalized cardinalities below . The normalized rank of and cardinality of averaged over the whole brain in this work are and respectively. Additionally, the oversampling ratio (Zhou et al., 2014) of the single voxel ODF matrices M is . Hence, the -decomposition can be reliably used to identify the low-rank subspace of ODFs in a matrix of vectorized ODFs.
Once the low-rank subspace of ODFs is identified in each voxel, we use the PC-scores in these low-rank bases as input for statistical testing (Fig. 1). The large numbers of multiple comparisons are corrected using the Threshold-Free Cluster Enhancement method (TFCE, (Smith and Nichols, 2009)) which obviates the need for a suitable cluster threshold choice (Nichols and Holmes, 2001). In addition, combining TFCE permutation inference with complex General Linear Models (GLM) allows accounting for nuisance variables (Winkler et al., 2014). These methods assume that the joint probability distribution of the variables does not change if they are rearranged (Winkler et al., 2014). This is a valid assumption since the joint distribution of errors of the ODFs PC-scores can be assumed to be invariant on exchange (Winkler et al., 2014). Significance of group differences or correlations can be assessed based on the p-values fully corrected for multiple comparisons across space (Smith and Nichols, 2009) calculated from the TFCE-output.
In addition to group difference significance, the low-rank basis of the ODFs in each voxel is used to calculate difference ODFs between subject groups and ( members) based on the Principal Components () and their PC-scores ()
| (2) |
for the PCs which were detected to hold significant differences between groups. Similarly, when observing trends related to a demographic or behavioral variable, the correlation ODF can be calculated as
| (3) |
with the correlation coefficient between and the demographic or behavioral variable. The ODFs in (2) and (3), obtained from statistical analysis, are expressed in the same physical quantities as the original ODFs since they are expressed in terms of the PC-basis. They can be used for visualization of the significant differences between subject groups, significant trends in the dataset or as a basis for tractography visualization (Fig. 1).
and illustrate group differences or correlations, both in magnitude and direction, in the underlying diffusion properties of the fiber bundle in the voxel. Since the spatial extent of each peak is related to the Quantitative Anisotropy (QA (Yeh et al., 2010)), both increases in and decreases in will increase the peak length. Similarly, both decreases in and increases in will decrease the peak length. Hence, in the difference ODFs, we encapsulate both possible changes, possibly missing compensating changes.
3 Methods
3.1 Simulated ODF generation
Single voxel groups of Radial DSI datasets of two crossing fiber bundles with equal weight (60°, // 1.00/0.10/0.10 m2/ms) and a water pool (10%) are simulated with Radial q-space sampling (59 radial lines, 4 shells, = 4000 s/mm2, (Baete et al., 2016b)). Rician noise (SNR 30 in non diffusion attenuated signal) and group-outliers (10%, SNR 5%) are added to the simulated diffusion signals before reconstructing the ODFs (Tuch, 2004). Each single voxel group contains 100 ODFs, simulating a study with 100 co-registered cases per group. The group differences are emulated by changing () or (( + )/2) of one of the two fibers fiber or the crossing angle of the fibers. Since these are single-voxel simulations, two-sided Student’s t-test (5 significance level) statistics and p-values are used to evaluate the detectability of simulated group differences. The average ODFs of each group are plotted where appropriate.
3.2 In vivo acquisitions
In vivo subject datasets were downloaded from the Human Connectome Project (HCP) consortium led by Washington University, University of Minnesota, and Oxford University. We used the 355 subjects from the December 2015 release (S900, 180/175 female/male, y/o, BMI ). Diffusion imaging using mono-polar gradient pulse sequence (6 b0-images and 270 q-space samples on three shells, 1000,2000 and 3000 s/mm2; all diffusion directions are acquired twice, one with phase encoding left-to-right and once with phase encoding right-to-left; TR/TE = 5500/89.50ms, 1.25 mm isotropic resolution, 210180 mm field of view, 111 slices, simultaneous multi-slice acceleration of 3 (Sotiropoulos et al., 2013); acquisition time of approximately 55 min) and structural imaging (MPRAGE; TR/TE = 2400/2.14ms, 192 slices, 111 mm resolution, TI = 900/1000ms, parallel imaging (2x, GRAPPA), 5:03min) was performed on a Siemens 3T Skyra with 100 mT/m maximum gradient strength.
Preprocessing of the HCP dataset was performed by the Human Connectome Project consortium as described in (Glasser et al., 2013). The diffusion datasets were reconstructed with the generalized q-space diffeomorphic reconstruction (Yeh et al., 2010; Yeh and Tseng, 2011) as implemented in DSIStudio (Yeh et al., 2010) to the MNI-atlas (Alexander et al., 2001; Lepore et al., 2010b; Yeh and Tseng, 2011; Raffelt et al., 2011, 2012). The ODFs calculated from these reconstructions are transformed Spin Density Functions (SDF, (Yeh et al., 2010; Yeh and Tseng, 2011)) as they are multiplied by the spin density as estimated from the b0-map (Yeh and Tseng, 2011). The spin density of the ODFs is then scaled relative to the amount of diffusing spins in 1 mm 3 free water diffusion, estimated as the diffusion in the cerebrospinal fluid (Yeh et al., 2010). This allows for a unified reference within and between subjects (Yeh et al., 2010).
3.3 Simulations using in vivo acquisitions
The choice of parameters and the ODF group difference detection of the -matrix decomposition is evaluated using registered in vivo ODFs selected from the HCP datasets. The ODFs from a single voxel assist in evaluating the impact of the tunable parameters and of the noncvxRPCA algorithm. In a larger selected region, ODFs from adjacent voxels are reorganized to simulate group differences. Group differences detected with the -decomposition are then compared to the Jensen-Shannon Divergence (JSD) (Cohen-Adad et al., 2011) between the mean ODFs of the voxels.
3.4 Statistical testing
Statistical significance of detected group differences is assessed using a 2-sample t-test for single voxel comparisons and simulations. In whole brain analysis, the FWE are corrected using the TFCE-method (Smith and Nichols, 2009) using the randomise implementation of FSL. In this permutation-based testing, the nuisance variables age and gender are accounted for by using a General Linear Model (10000 permutations, (Winkler et al., 2014)). Results are displayed using Matlab (Mathworks) and DSIStudio (Yeh et al., 2010).
Whole brain ODFs are correlated with a number of demographic and neurocognitive variables from the HCP Data Dictionary111https://wiki.humanconnectome.org/display/PublicData/HCP+Data+Dictionary+Public-+500+Subject+Release. The analysis focuses on Body Mass Index (BMI), motor functioning (NIH Toolbox 2-minute Walk Endurance Test Endurance_AgeAdj and 4-meter Walk Gait Speed Test GaitSpeed_Comp (Society, 2002; Reuben et al., 2013)), language and vocabulary comprehension and decoding (NIH Toolbox Picture Vocabulary Test PicVocab_AgeAdj and Oral Reading Recognition Test ReadEng_AgeAdj (Gershon et al., 2014)), episodic memory (NIH Toolbox Picture Sequence Memory Test PicSeq_AgeAdj (Dikmen et al., 2014)) and fluid intelligence (Raven’s Progressive Matrices: Number of Correct Responses PMAT24_A_CR and Total Skipped Items PMAT24_A_SI (Bilker et al., 2012)).
3.5 Comparison with existing methods
The ODFs found to correlate with BMI with ODF are compared with results from existing methods (Smith et al., 2006; Jbabdi et al., 2010; Yeh and Tseng, 2011; Raffelt et al., 2012, 2015). The default TBSS pipeline (Smith et al., 2006; Jbabdi et al., 2010) was used by performing registration, skeletonisation and statistical analysis as suggested by the TBSS user guide222https://fsl.fmrib.ox.ac.uk/fsl/fslwiki/TBSS/UserGuide with FSL v5.0.9. Connectivity-based fixel enhancement (Fixel) (Raffelt et al., 2012, 2015) analysis included estimation of the individual fiber response functions, calculation of individual fODFs, generating a study-specific fODF template and performing tractography on this template, registering all subjects to the template and statistical analysis of the apparent fiber density according to the MRtrix user guide333http://mrtrix.readthedocs.io/en/latest/fixel_based_analysis/mt_fibre_density_cross-section.html. MRtrix3444https://github.com/MRtrix3 version 0.3.15 was compiled from source. Lastly, a local connectome based statistical analysis (Yeh et al., 2016) was performed using DSIStudio ((Yeh et al., 2010) compiled from source on March 18th, 2017). The suggested workflow555http://dsi-studio.labsolver.org/Manual/diffusion-mri-connectometry was followed to create a connectometry database using q-space diffeomorphic reconstruction to the HCP-842 template (Yeh and Tseng, 2011) and to run group connectometry analysis (10000 permutations, T-score threshold 1.6 to obtain p 0.001).
4 Results
In this section, we will demonstrate the applicability of the -matrix decomposition for detection of ODF group differences and correlation with biological and behavioral measurements using simulated and in vivo group data.
4.1 Simulation results
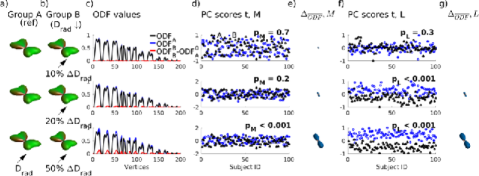
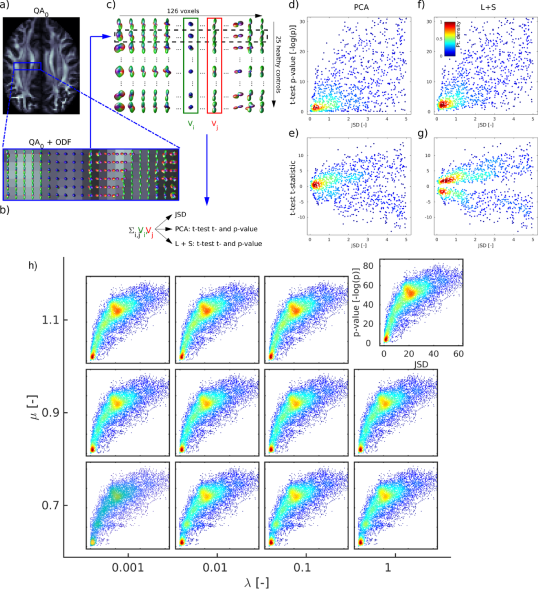
Figures 3 and 4 show results of the detection of differences between groups of 100 simulated ODFs of two crossing fibers. When comparing large differences (Fig. 3ab, bottom row, reduction of ), visual comparison of the average ODF-values (Fig. 3c) easily confirms the separation of PC-scores of both ODF-matrix (Fig. 3d) and Low-Rank matrix (Fig. 3f). When comparing smaller group differences however (Fig. 3, top two rows, and reduction of ), statistical testing of is not significant (Fig. 3d) ,while testing of , after separation of the individual variability in , does succeed in identifying the simulated group differences (Fig. 3f).
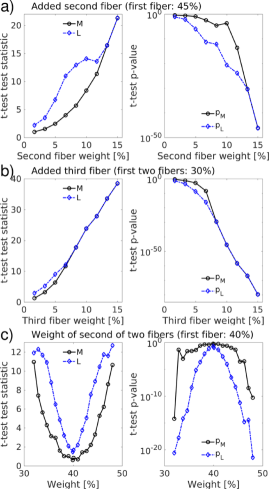
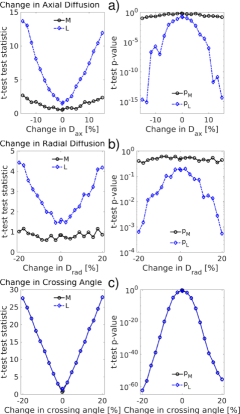
Figure 4 looks at the detectability of a broader range of changes of (Fig. 4a), (Fig. 4b) and crossing angle (Fig. 4c) between groups of simulated ODFs. Similarly, figure S1 studies the detectability of changes in number of fibers (Fig. S1a,b) and relative fiber weights (Fig. S1c). The left columns of Figure 4 and S1 plot the t-test test statistic and the right columns the t-test p-value. Changes in , and relative weight, which create more subtle differences in the ODF peaks, are better detected by analyzing the PC-scores of versus . Larger changes in the ODF, such as a shift in the ODF peak orientation by changing the crossing angle or adding fibers to the ODF, are detected equally well by both approaches. Note that there are almost linear relationships between the test statistics and the changes in diffusion parameters (Fig. 4, S1, left column).
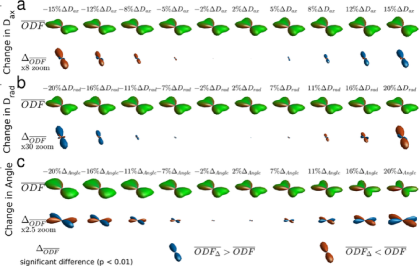
The (Eq. 2) in Fig. 5 are a visual representation of the detected ODF group differences. They scale with the detected ODF group difference for simulated changes in (5a) and (5b) of one fiber bundle in a crossing pair and with changes of their crossing angle (5c). Both an increase in and a decrease in give rise to a larger peak, hence a positive (blue-colored) -lobe. A change in crossing angle gives rise to a positive (blue-colored) and a negative (red-colored) lobe scaling with the change in crossing angle (5c).
4.2 Simulations using in vivo data
The relationship between in vivo group differences and t-test statistics and p-values is explored in Figure 6. A central segment is randomly taken from the registered in vivo whole brain HCP dataset (Fig. 6a,b). Group differences are artificially introduced by comparing all ODFs of each pair of voxels in the segment (Fig. 6bc). The results of these comparisons using (Fig. 6de) and (Fig. 6fg) are plotted versus the JSD of the average ODFs of the respective voxels. The detected p-values are smaller (larger values) when analyzing over , indicating higher detected significance. The comparison test is in addition inconclusive (p close to 1) on less occasions. These beneficial properties of the analysis of remain for a wide range of values for -matrix decomposition parameters and (Fig. 6h).
4.3 In vivo results
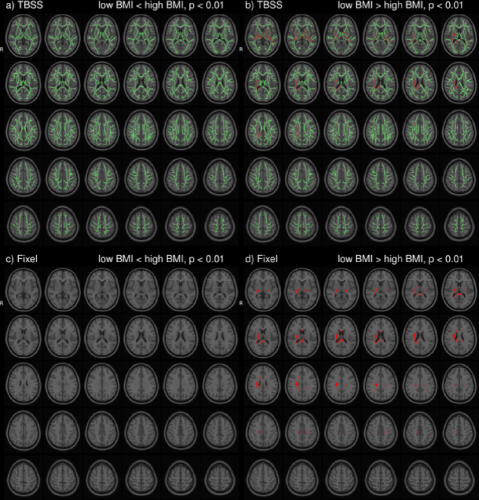
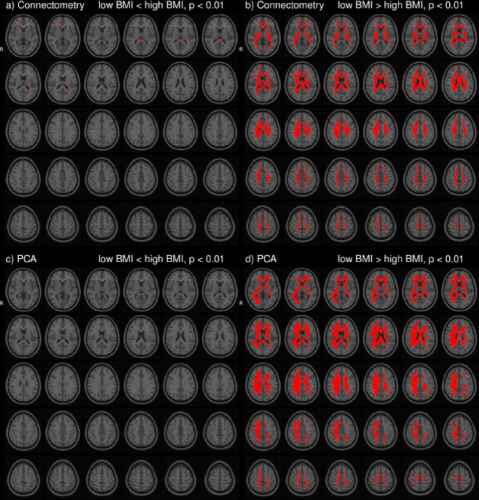
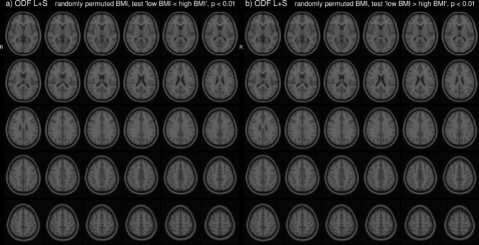
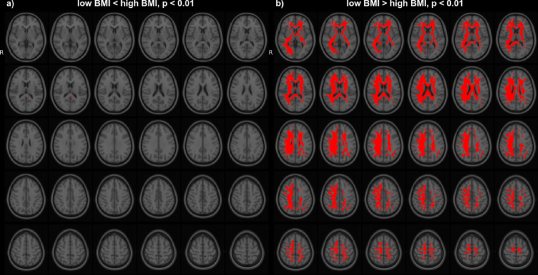
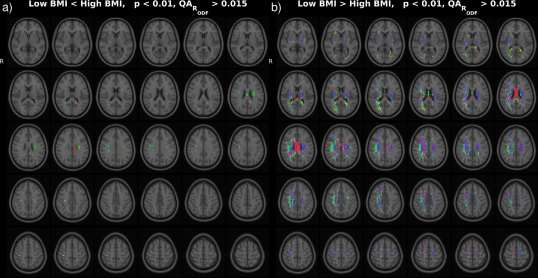
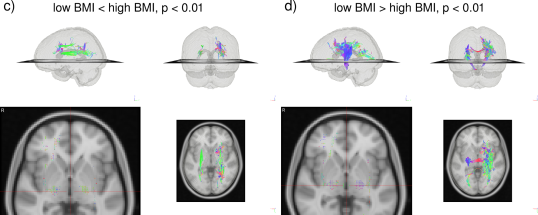
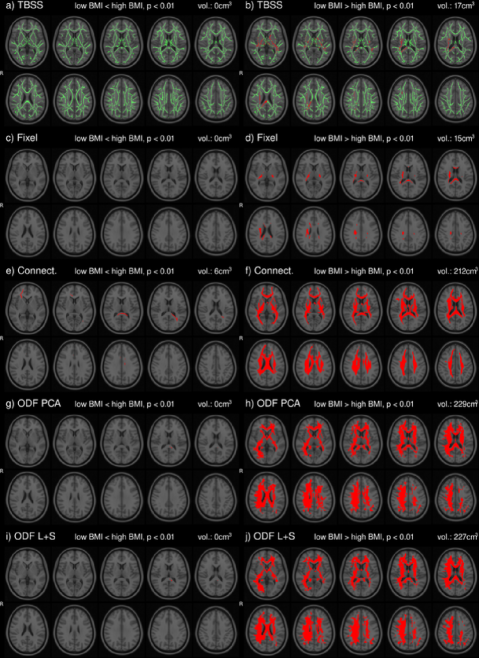
In the HCP dataset, ODFs correlate strongly with the demographic variable BMI. As expected, the ODFs negatively correlate (Fig. 7b) with BMI, indicating a loss of anisotropy with increasing BMI (Fig. 5a,b). This result is consistent with the well-established negative association between global white matter integrity and physical obesity (Mueller et al., 2011; Stanek et al., 2011; Verstynen et al., 2012; Gianaros et al., 2013; Verstynen et al., 2013). The fiber directions (Fig. 8a,b) identified from can be used to perform tractography (Fig. 8c,d). Resulting tracts (Fig. 8c,d) show a pronounced loss of anisotropy in the corticospinal tracts, the optic radiations and the right superior longitudinal fasciculus. These results are corroborated by the existing methods TBSS (Fig. 9a,b, S2a,b), Connectivity-based fixel enhancement (Fig. 9c,d, S2c,d) and local connectometry (Fig. 9e,f, S3a,b). The volume of positive findings of correlation with BMI is largest when using the full ODF information with the ODF approach (Fig. 9). In addition, in a test of specificity, no voxels are found to correlate with randomly permuted BMI (Fig. S4).
The individual variability of ODFs can be caused by ODF reconstruction errors due to image artifacts (Fig. S5.1), registration errors and individual differences in brain structure (Fig. S5.3-4). In the HCP ODFs individual variability due to the first two of these contributions is limited by the low number of artifacts and the high image resolution in the HCP DWI images. As a result, ODF correlations of BMI identified with ODF ((Fig. 9g,h, S3c,d)) and ODF (Fig. 9i,j, 7) are similar in this dataset. However, in a dataset with higher individual variation, notable improvement of ODF over ODF PCA can be observed (Baete et al., 2016a).
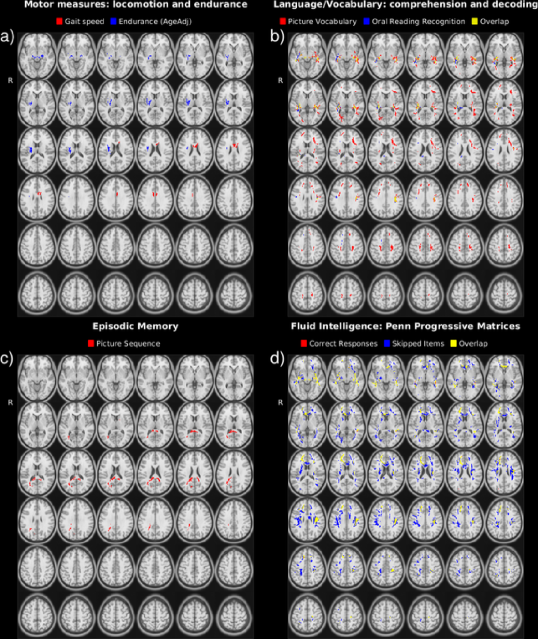
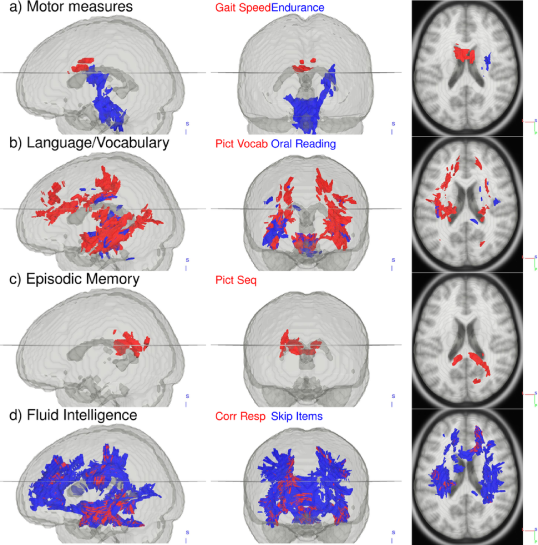
The HCP ODFs also correlate with neurocognitive measures (Fig. 10 and 11). Walking endurance (Fig. 10a and 11a) predictably relates to the corticospinal tract, while the frontal part of the corpus callosum indicated in gait speed has been identified before when comparing endurance athletes with non-athletes (Raichlen et al., 2016) and when studying the effect of treadmill training after stroke (Enzinger et al., 2009). Language recognition and comprehension tasks (Fig. 10b and 11b), as measured by the Oral Reading and Picture Vocabulary test, correlate with ODFs in areas identified by fMRI work (Berl et al., 2010): posterior superior temporal gyrus and inferior frontal gyrus connected by stretches of the arcuate fasciculus pathway/superior longitudinal fasciculus III. Besides these areas, language comprehension also relates with ODFs in the medial frontal gyri and the left precuneus (Schmithorst et al., 2007). Our analysis further connects the Episodic Memory measure with the posterior cingulate and precuneus, though not with the medial temporal cortex (Fig. 10c and 11c). These areas have been shown to deactivate in episodic memory tasks (Dickerson and Eichenbaum, 2010). Lastly, Fluid Intelligence correlates widely with ODFs in the prefrontal, parietal and temporal cortex as indicated before (Gray et al., 2003) as well as with ODFs along tracts connecting these regions (Fig. 10d and 11d).
5 Discussion
In analyzing large neuroimaging data sets, we strive to fully utilize all the information available in each voxel to identify group differences or population correlations. The available information in each voxel of high quality diffusion MRI acquisitions is often represented as an ODF, be it a diffusion ODF or a fiber ODF. ODFs and their key features identified by PCA-analysis are thus the ideal starting point for statistical analysis. These statistical tests are however biased by individual variability of the subjects since PCA is sensitive to outliers (Zhou et al., 2014; Lin, 2016). This bias is mitigated in the results presented here by separating individual variability and essential ODF features through the decomposition of the ODFs.
Statistical testing of ODFs based on decomposition more reliably identifies the underlying relationships between ODF shapes and observed behavior. Indeed, separating the outliers from key ODF features reduces the uncertainty regarding the existence of correlations in the dataset (Fig. 4,S1,5,6). This reduced uncertainty increases the detected significance of group differences (Fig. 4, S1 and Fig. 6d,e vs. 6f,g). Furthermore, removal of individual variability decreases the bias in the estimated correlations coefficients and PC-scores . We can thus deploy and to calculate difference and correlation ODFs (resp. and ) which help in visual interpretation of the test results (Fig. 5, 8 and 11).
Several methods exist to analyze populations of diffusion MRI datasets, typically working on a reduced dimensionality subset of the diffusion data. TBSS (Jbabdi et al., 2010), limiting the analysis to a projection to a tract skeleton, succeeds in identifying the tracts most significantly correlated with BMI (analysis of FA, Fig. 9a,b, S2a,b) but misses the full extent of the correlations. The Connectivity-based fixel enhancement (Raffelt et al., 2015) and Connectometry (Yeh et al., 2016) approaches do include more of the available information and hence perform better than the TBSS method (Fig. 9c,d, S2c,d (Fixel enhancement) and 9e,f, S3a,b (Connectometry) vs 9a,b, S2a,b (TBSS)).
None of the above methods however capitalizes on the full ODF information. This in contrast to the approach presented in this paper. The ODF approach indeed identifies a larger volume of significant findings (227 cm3) than the existing methods tested here (TBSS 17 cm3, Connectivity-based fixel enhancement 15 cm3 and Connectometry 212 cm3, Fig. 9b,d,f,h,j). That is, by analyzing the full ODF information and not reducing the dimensionality of the diffusion data, as is commonly done, the ODF approach is able to pick up on smaller significant changes, better grasping the full extent of the significant findings. Limitations on computational power and diffusion acquisitions (e.g. DTI) which inspired the data reduction of older methods no longer exist. It is hence advisable to maximize the amount of information included in the analysis as in the approach presented here.
Using the decomposition (Eq. 1) means that a choice for the balance parameter and the Lagrange penalty parameter has to be made. Choosing is straightforward as a universal choice is suggested by theoretical considerations (Candes et al., 2011; Lin, 2016). Simulations furthermore show that the decomposition is relatively insensitive to (Fig. 2). An appropriate value for will however have to be found heuristically. While our results were stable for in range around 1, it is clear that the extraction of essential ODF features will suffer when is too small (too few ODF features in L) or too large (too much individual variability in L) (Fig. 2).
Group differences or behavioral correlations of subject ODFs signal micro-structural changes in the white matter. The origin of the detected changes can unfortunately not always be teased out from the ODF analysis. For instance, both increases in and decreases in will increase anisotropy and as a result increase the ODF peak length. Both changes will thus results in similar or (Fig. 5), which will both illustrate the detected change in anisotropy. As a result, it is not possible to separately detect changes to axon density, axon diameter, membrane permeability and axon bundle curvature and divergence; a drawback shared with other analysis methods (Raffelt et al., 2012; Yeh et al., 2016). Group differences may consequently not be identified at all in the relatively unlikely case of confounding changes to these micro-structure parameters (Raffelt et al., 2012).
Besides potential confounding micro-structure changes, the presented ODF approach is also sensitive to other limitations. The main limitations are the processing parameters of the analysis pipeline. The choice of algorithm parameters and is straightforward and the decomposition is stable in a range of parameter choices. Nevertheless, certain combinations of and will affect the outcome of the analysis. This might be avoided by future automated tuning strategies for and . In the stable parameter range, a high probability of exact recovery of from is mathematically guaranteed when is low rank and is sparse (Candes et al., 2011; Yuan and Yang, November 2009; Chandrasekaran et al., 2011; Zhou et al., 2014). The ODF approach is thus limited to low rank . Our in vivo analysis shows though that is sufficiently low rank for a stable decomposition. Results will further depend on the number of available diffusion directions and shells, quality control of the images, careful choice of preprocessing steps and parameters, the reconstruction used to generate the ODFs, the choice of template for registration, the method used for registration to a template and the parameters of the FWE correction method. For each of these steps, we have striven to make common sense best practice choices. Of these steps, the often imperfect inter-subject registration will have the largest confounding impact, similar to other analysis methods (Raffelt et al., 2012; Yeh et al., 2016).
In conclusion, high quality diffusion MRI datasets of groups of individuals open a window to studying brain structure changes related to disease condition and behavioral functions. Full incorporation of all available diffusion information however risks biasing the outcome by outliers, often leading to statistical analysis of diffusion measures with reduced dimensionality. Here we apply a Low-Rank plus Sparse decomposition on the voxelwise ODF distributions. Analyzing the Low-Rank ODF distribution reduces the impact of inter-subject variability and thus avoids outlier bias by focusing on the essential ODF features of the population while maximizing the dimensionality of included diffusion information. This approach provides a foundation for improved detection of group differences in DWI through PCA-based analysis. The identified group differences can then also be visualized with difference ODFs and correlation ODFs . This method will aid in the detection of smaller group differences in clinically relevant settings as well as in neuroscience applications.
Source code (Matlab) for the ODF approach is available for download at https://bitbucket.org/sbaete/odflpluss.
Acknowledgements
This project is supported in part by the National Institutes of Health (NIH, R01CA111996, R01NS082436, R01MH00380 and P41EB017183). Data were provided by the Human Connectome Project, WU-Minn Consortium (Principal Investigators: David Van Essen and Kamil Ugurbil; 1U54MH091657) funded by the 16 NIH Institutes and Centers that support the NIH Blueprint for Neuroscience Research; and by the McDonnell Center for Systems Neuroscience at Washington University.
References
References
- Alexander et al. (2001) Alexander, D., Pierpaoli, C., Basser, P. J., Gee, J., 2001. Spatial transformations ofdiffusion tensor magnetic resonance images. IEEE Trans Med Imaging 20 (11), 1131–39.
- Bach et al. (2014) Bach, M., Laun, F., Leemans, A., Tax, C., Biessels, G., Stieltjes, B., Maier-Hein, K., 2014. Methodological considerations on tract-based spatial statistics (tbss). NeuroImage 100, 358–69.
- Baete and Boada (2018) Baete, S., Boada, F., 2018. Accelerated radial diffusion spectrum imaging using a multi-echo stimulated echo diffusion sequence. Magn Reson Med 79 (1), 306–16.
- Baete et al. (2016a) Baete, S., Chen, J., Gonzalez, B., Perrin, M., Otazo, R., Marmar, C., Boada, F., 2016a. Improved group difference detection in higher order diffusion acquisitions using low rank plus sparse decomposition of odf distributions. In: Whistler Scientific Workshop on Brian Functional Organization, Connectivity and Behavior. Vol. 3. Whistler, Canada.
- Baete et al. (2016b) Baete, S., Yutzy, S., Boada, F., 2016b. Radial q-space sampling for dsi. Magn Reson Med 76 (3), 769–80.
- Baete et al. (2015) Baete, S., Zhao, T., Boada, F., 2015. Fast, whole brain radial diffusion spectrum imaging (rdsi) via simultaneous multi slice excitation. In: Proc Intl Soc Magn Reson Med. Vol. 23. Toronto, Canada, p. 2539.
- Basser and Pierpaoli (1996) Basser, P. J., Pierpaoli, C., 1996. Microstructural and physiological features of tissues elucidated by quantitative-diffusion-tensor mri. J Magn Reson Imaging Series B 111, 209–219.
- Berl et al. (2010) Berl, M. M., Duke, E. S., Mayo, J., Rosenberger, L. R., Moore, E. N., VanMeter, J., Ratner, N. B., Vaidya, C. J., Gaillard, W. D., 2010. Functional anatomy of listening and reading comprehension during development. Brain Lang 114 (2), 115–25.
- Bilker et al. (2012) Bilker, W. B., Hansen, J. A., Brensinger, C. M., Richard, J., Gur, R. E., Gur, R. C., 2012. Development of abbreviated nine-item forms of the raven’s standard progressive matrices test. Assessment 19 (3), 354–69.
- Blaimer et al. (2013) Blaimer, M., Choli, M., Jakob, P. M., Griswold, M. A., Breuer, F., 2013. Multiband phase-constrained parallel mri. Mag Reson Med 69, 974–980.
- Bouwmans and ZahZah (2014) Bouwmans, T., ZahZah, E., 2014. Robust pca via principal component pursuit: A review for a comparative evaluation in video surveillance. Comp. Vis. and Imag. Understanding 122, 22–34.
- Callaghan (1993) Callaghan, P. T., 1993. Principles of Nuclear Magnetic Resonance Microscopy. Oxford University Press, Oxford.
- Candes et al. (2011) Candes, E., Li, X., Ma, Y., Wright, J., 2011. Robust principal component analysis? Journal of the ACM 58 (3), 11.
- Chandrasekaran et al. (2011) Chandrasekaran, V., Sanghavi, S., Parrilo, P., Willsky, A., 2011. Rank-sparsity incoherence for matrix decomposition. SIAM J. Optim. 21, 572–96.
- Chen et al. (2015) Chen, J., Baete, S., Qian, M., Li, M., Marmar, C., Boada, F., 2015. Principle component analysis of orientation distribution function in diffusion spectrum imaging. In: Human Brain Mapping. Vol. 21. Honolulu, Hawaii, p. 5126.
- Cohen-Adad et al. (2011) Cohen-Adad, J., Descoteaux, M., Wald, L. L., 2011. Quality assessment of high angular resolution diffusion imaging data using bootstrap on q-ball reconstruction. J Magn Reson Imaging 33 (5), 1194–208.
- Dickerson and Eichenbaum (2010) Dickerson, B. C., Eichenbaum, H., 2010. The episodic memory system: neurocircuitry and disorders. Neuropsychopharmacology 35 (1), 86–104.
- Dikmen et al. (2014) Dikmen, S. S., Bauer, P. J., Weintraub, S., Mungas, D., Slotkin, J., Beaumont, J. L., Gershon, R., Temkin, N. R., Heaton, R. K., 2014. Measuring episodic memory across the lifespan: Nih toolbox picture sequence memory test. J Int Neuropsychol Soc 20 (6), 611–9.
- Enzinger et al. (2009) Enzinger, C., Dawes, H., Johansen-Berg, H., Wade, D., Bogdanovic, M., Collett, J., Guy, C., Kischka, U., Ropele, S., Fazekas, F., Matthews, P. M., 2009. Brain activity changes associated with treadmill training after stroke. Stroke 40 (7), 2460–7.
- Fernandez-Miranda et al. (2012) Fernandez-Miranda, J. C., Pathak, S., Engh, J., Jarbo, K., Verstynen, T., Yeh, F. C., Wang, Y., Mintz, A., Boada, F., Schneider, W., Friedlander, R., 2012. High-definition fiber tractography of the human brain: neuroanatomical validation and neurosurgical applications. Neurosurgery 71 (2), 430–53.
- Gao et al. (2011) Gao, H., Cai, J.-F., Shen, Z., Zhao, H., 2011. Robust principal component analysis-based four-dimensional computed tomography. Phys. Med. Biol. 56, 3181–98.
- Gao et al. (2013) Gao, H., Li, L., Hyu, X., 2013. Compressive diffusion mri - part 1: Why low-rank? In: Proc Intl Soc Magn Reson. Vol. 21. Salt Lake City, Utah, USA, p. 610.
- Gershon et al. (2014) Gershon, R. C., Cook, K. F., Mungas, D., Manly, J. J., Slotkin, J., Beaumont, J. L., Weintraub, S., 2014. Language measures of the nih toolbox cognition battery. J Int Neuropsychol Soc 20 (6), 642–51.
- Gianaros et al. (2013) Gianaros, P., Marsland, A., Sheu, L., Erickson, K., Verstynen, T., 2013. Inflammatory pathways link socioeconomic inequalities to white matter architecture. Cerebral Cortex 23, 2058–71.
- Glasser et al. (2013) Glasser, M. F., Sotiropoulos, S. N., Wilson, J. A., Coalson, T. S., Fischl, B., Andersson, J. L., Xu, J., Jbabdi, S., Webster, M., Polimeni, J. R., Van Essen, D. C., Jenkinson, M., Consortium, W. U.-M. H., 2013. The minimal preprocessing pipelines for the human connectome project. Neuroimage 80, 105–24.
- Gray et al. (2003) Gray, J. R., Chabris, C. F., Braver, T. S., 2003. Neural mechanisms of general fluid intelligence. Nat Neurosci 6 (3), 316–22.
- Jahanshad et al. (2015) Jahanshad, N., Nir, T., Toga, A., Jack, C., Bernstein, M., Weiner, M., Thompson, P., 2015. Seemingly unrelated regression empowers detection of network failure in dementia. Neurobiology of Aging 36, S103–12.
- Jbabdi et al. (2010) Jbabdi, S., Behrens, T. E., Smith, S., 2010. Crossing fibres in tract-based spatial statistics. NeuroImage 46, 249–56.
- Jeurissen et al. (2013) Jeurissen, B., Leemans, A., Tournier, J.-D., Jones, D., Sijbers, J., 2013. Investigating the prevalence of complex fiber configurations in white matter tissue with diffusion magnetic resonance imaging. Hum Brain Mapp 34, 2747–66.
- Jones et al. (2013) Jones, D., Knosche, T., Turner, R., 2013. White matter integrity, fiber count, and other fallacies: The do’s and don’ts of diffusion mri. NeuroImage 73, 239–254.
- Kang et al. (2015) Kang, Z., Peng, C., Cheng, Q., 2015. Robust pca via nonconvex rank approximation. In: IEEE International Conference on Data Mining (ICDM). Atlantic City, NJ, USA, pp. 211–220.
- Kuo et al. (2008) Kuo, L. W., Chen, J. H., Wedeen, V. J., Tseng, W. Y., 2008. Optimization of diffusion spectrum imaging and q-ball imaging on clinical mri system. Neuroimage 41 (1), 7–18.
- Lepore et al. (2010a) Lepore, N., Brun, C., Descoteaux, M., Chou, Y.-Y., de Zubicaray, G., McMahon, K., Wright, M., Martin, N., Gee, J., Thompson, P., 2010a. A multivariate group-wise genetic analysis of white matter integrity using orientation distribution functions. In: Computational Diffusion MRI workshop at MICCAI. Beijing, China.
- Lepore et al. (2010b) Lepore, N., Brun, C., Descoteaux, M., Chou, Y.-Y., de Zubicaray, G., McMahon, K., Wright, M., Martin, N., Gee, J., Thompson, P., 2010b. A multivariate group-wise genetic analysis of white matter integrity using orientation distribution functions. In: Medical Image Computing and Computer Assisted Intervenction (MICCAI) Workshop on Computational Diffusion MRI (CDMRI). Beijing, China, pp. 1–11.
- Lin (2016) Lin, Z., 2016. A review on low-rank models in data analysis. Big Data and Inf. Anal. 1 (2/3), 139.
- Lin et al. (2010) Lin, Z., Chen, M., Ma, Y., 2010. The augmented lagrange multiplier method for exact recovery of corrupted low-rank matrices. arXiv preprint, arXiv:1009.5055v3.
- Mitra et al. (2016) Mitra, J., Shen, K., Ghose, S., Bourgeat, P., Fripp, J., Salvado, O., Pannek, K., Taylor, D., Mathias, J., Rose, S., 2016. Statistical machine learning to identify brain injury (tbi) from structural disconnections of white matter networks. NeuroImage 129, 247–59.
- Mueller et al. (2011) Mueller, K., Anwander, A., Moller, H., Horstmann, A., Lepsien, J., Busse, F., Mohammadi, S., Schroeter, M., Stumvoll, M., Villringer, A., Pleger, B., 2011. Sex-dependent influences of obesity on cerebral white matter investigated by diffusion-tensor imaging. PLoS One 6, e18544, 1–9.
- Nichols and Holmes (2001) Nichols, T., Holmes, A., 2001. Nonparametric permutation tests for functional neuroimaging: A primer with examples. Hum Brain Mapp 15, 1–25.
- Otazo et al. (2015a) Otazo, R., Candes, E., Sodickson, D., 2015a. Low-rank plus sparse matrix decomposition for accelerated dynamic mri with separation of background and dynamic components. Mag Reson Med 73, 1125–36.
- Otazo et al. (2015b) Otazo, R., Franco, A., Chen, J., Marmar, C., Boada, F., 2015b. Low-rank plus sparse (l+s) decomposition for separation of subsampled physiological noise in fmri. In: Human Brain Mapping. Vol. 21. Honolulu, Hawaii, USA, p. 1690.
- Peng et al. (2012) Peng, Y., Ganesh, A., Wright, J., Xu, W., Ma, Y., 2012. Rasl: Robust alignment by sparse and low-rank decomposition for linearly correlated images. IEEE Trans Pattern Anal. and Mach. Int. 34, 2233–46.
- Powell et al. (2017) Powell, M., Garcia, J., Yeh, F. C., Vettel, J., Verstynen, T., 2017. Local connectome phenotypes predict social, health, and cognitive factors. bioRxiv https://doi.org/10.1101/122945.
- Raffelt et al. (2015) Raffelt, D., Smith, R., Ridgway, G., Tournier, J.-D., Vaughan, D., Rose, S., Henderson, R., Connelly, A., 2015. Connectivity-based fixel enhancement: Whole-brain statistical analysis of diffusion mri measures in the presence of crossing fibres. NeuroImage 117, 40–55.
- Raffelt et al. (2011) Raffelt, D., Tournier, J. D., Fripp, J., Crozier, S., Connelly, A., Salvado, O., 2011. Symmetric diffeomorphic registration of fibre orientation distributions. Neuroimage 56 (3), 1171–80.
- Raffelt et al. (2012) Raffelt, D., Tournier, J.-D., Rose, S., Ridgway, G., Henderson, R., Crozier, S., Salvado, O., Connelly, A., 2012. Apparent fibre density: A novel measure for the analysis of diffusion-weighted magnetic resonance images. NeuroImage 59, 3976–94.
- Raichlen et al. (2016) Raichlen, D. A., Bharadwaj, P. K., Fitzhugh, M. C., Haws, K. A., Torre, G. A., Trouard, T. P., Alexander, G. E., 2016. Differences in resting state functional connectivity between young adult endurance athletes and healthy controls. Front Hum Neurosci 10, 610.
- Reese et al. (2009) Reese, T. G., Benner, T., Wang, R., Feinberg, D. A., Wedeen, V. J., 2009. Halving imaging time of whole brain diffusion spectrum imaging and diffusion tractography using simultaneous image refocusing in epi. J Magn Reson Imaging 29 (3), 517–22.
- Reuben et al. (2013) Reuben, D., Magasi, S., McCreath, H., Bohannon, R., Wang, Y.-C., Bubela, D., Rymer, W., Beaumont, J., Rine, R., Lai, J.-S., Gerschon, R., 2013. Motor assessment using the nih toolbox. Neurology 80 (S3), S65–75.
- Reveley et al. (2015) Reveley, C., Seth, A., Pierpaoli, C., Silva, A., Yu, D., Saunders, R., Leopold, D., Ye, F., 2015. Superficial white matter fiber systems impede detection of long-range cortical connections in diffusion mr tractography. Proc Natl Acad Sci U S A 112, E2820–8.
- Schmithorst et al. (2007) Schmithorst, V. J., Holland, S. K., Plante, E., 2007. Object identification and lexical/semantic access in children: a functional magnetic resonance imaging study of word-picture matching. Hum Brain Mapp 28 (10), 1060–74.
- Setsompop et al. (2012a) Setsompop, K., Cohen-Adad, J., Gagoski, B. A., Raij, T., Yendiki, A., Keil, B., Wedeen, V. J., Wald, L. L., 2012a. Improving diffusion mri using simultaneous multi-slice echo planar imaging. Neuroimage 63 (1), 569–80.
- Setsompop et al. (2012b) Setsompop, K., Gagoski, B. A., Polimeni, J., Witzel, T., Wedeen, V. J., Wald, L. L., 2012b. Blipped-controlled aliasing in parallel imaging for simultaneous multislice echo planar imaging with reduced g-factor penalty. Mag Reson Med 67, 1210–1224.
- Smith et al. (2006) Smith, S., Jenkinson, M., Johansen-Berg, H., Rueckert, D., Nichols, T., Mackay, C., Watkins, K., Ciccarelli, O., Zaheer Cader, M., Matthes, P., Behrens, T. E., 2006. Tract-based spatial statistics: Voxelwise analysis of multi-subject diffusion data. NeuroImage 31, 1487–1505.
- Smith and Nichols (2009) Smith, S., Nichols, T., 2009. Threshold-free cluster enhancement: Addressing problems of smoothing, threshold dependence and localisation in cluster inference. NeuroImage 44, 83–98.
- Smith et al. (2015) Smith, S., Nichols, T., Vidaurre, D., Winkler, A., Behrens, T., Glasser, M., Ugurbil, K., Barch, D., Van Essen, D., Miller, K., 2015. A positive-negative mode of population covariation links brain connectivity, demographis and behavior. Nature Neuroscience 18 (11), 1565.
- Society (2002) Society, A. T., 2002. Ats statement: Guidelines for the six-minute walk test. Am J Respir Crit Care Med 166, 111–17.
- Sotiropoulos et al. (2013) Sotiropoulos, S., Moeller, S., Jbabdi, S., Xu, J., Andersson, J., Auerbach, E., Yacoub, E., Feinberg, D., Setsompop, K., Wald, L., Behrens, T., Ugurbil, K., Lenglet, C., 2013. Effects of image reconstruction on fiber orientation mapping from multichannel diffusion mri: Reducing the noise floor using sense. Mag Reson Med 70, 1682–9.
- Stanek et al. (2011) Stanek, K., Grieve, S., Brickman, A., Korgaonkar, M., Paul, R., Cohen, R., Gunstad, J., 2011. Obesity is associated with reduced white matter integrity in otherwise healthy adults. Obesity 19, 500–4.
- Thomas et al. (2014) Thomas, C., Ye, F., Irfanoglu, M., Modi, P., Saleem, K., Leopold, D., Pierpaoli, C., 2014. Anatomical accuracy of brain connections derived from diffusion mri tractography is inherently limited. Proc Natl Acad Sci U S A 111, 16574–9.
- Tournier et al. (2004) Tournier, J.-D., Calamante, F., Gadian, D., Connelly, A., 2004. Direct estimation of the fiber orientation density function from diffusion-weighted mri data using spherical deconvolution. NeuroImage 23, 1176–85.
- Tuch (2004) Tuch, D. S., 2004. Q-ball imaging. Magn Reson Med 52 (6), 1358–72.
- Tuch et al. (2002) Tuch, D. S., Reese, T. G., Wiegell, M. R., Makris, N., Belliveau, J. W., Wedeen, V. J., 2002. High angular resolution diffusion imaging reveals intravoxel white matter fiber heterogeneity. Magn Reson Med 48 (4), 577–82.
- Verstynen et al. (2013) Verstynen, T., Weinstein, A. J., Erickson, K., Sheu, L., Marsland, A., Gianaros, P., 2013. Competing physiological pathways link individual differences in weight and abdominal adiposity to white matter microstructure. NeuroImage 79, 129–37.
- Verstynen et al. (2012) Verstynen, T., Weinsteind, A., Schneider, W., Jakicic, J., Rofey, D., Erickson, K., 2012. Increased body mass index is associated with a global and distributed decrease in white matter microstructural integrity. Psychosom Med. 74, 682–90.
- Wedeen et al. (2005) Wedeen, V. J., Hagmann, P., Tseng, W. Y., Reese, T. G., Weisskoff, R. M., 2005. Mapping complex tissue architecture with diffusion spectrum magnetic resonance imaging. Magn Reson Med 54 (6), 1377–86.
- Wedeen et al. (2012) Wedeen, V. J., Rosene, D. L., Wang, R., Dai, G., Mortazavi, F., Hagmann, P., Kaas, J. H., Tseng, W. Y., 2012. The geometric structure of the brain fiber pathways. Science 335 (6076), 1628–34.
- Whitcher et al. (2007) Whitcher, B., Wisco, J., Hadjikhani, N., Tuch, D., 2007. Statistical group comparison of diffusion tensors via multivariate hypothesis testing. Mag Reson Med 57 (6), 1065–74.
- Winkler et al. (2014) Winkler, A., Ridgway, G., Webster, M., Smith, S., Nichols, T., 2014. Permutation inference for the general linear modal. NeuroImage 92, 381–97.
- Yeh et al. (2016) Yeh, F.-C., Badre, D., Verstynen, T., 2016. Connectometry: A statistical approach harnessing the analytical potential of the local connectome. NeuroImage 125, 162–71.
- Yeh and Tseng (2011) Yeh, F.-C., Tseng, W.-Y. I., 2011. Ntu-90: A high angular resoluiton brain atlas constructed by q-space diffeomorphic reconstruction. NeuroImage 58, 91–99.
- Yeh et al. (2010) Yeh, F. C., Wedeen, V. J., Tseng, W. Y., 2010. Generalized q-sampling imaging. IEEE Trans Med Imaging 29 (9), 1626–35.
- Yuan and Yang (November 2009) Yuan, X., Yang, J., November 2009. Sparse and low-rank matrix decomposition via alternating direction methods. Optimization Online.
- Zhang et al. (2010) Zhang, H., Awate, S., Das, R., Woo, J., Melhem, E., Gee, J., Yushkevich, P., 2010. A tract-specific framework for white matter morphometry combining macroscopic and microscopic tract features. Med Image Anal 14, 666–73.
- Zhou et al. (2014) Zhou, X., Yang, C., Zhao, H., Yu, W., 2014. Low-rank modeling and its applications in image analysis. arXiv preprint arXiv:1401.3409.