Learning deep structured active contours end-to-end
Abstract
The world is covered with millions of buildings, and precisely knowing each instance’s position and extents is vital to a multitude of applications. Recently, automated building footprint segmentation models have shown superior detection accuracy thanks to the usage of Convolutional Neural Networks (CNN). However, even the latest evolutions struggle to precisely delineating borders, which often leads to geometric distortions and inadvertent fusion of adjacent building instances. We propose to overcome this issue by exploiting the distinct geometric properties of buildings. To this end, we present Deep Structured Active Contours (DSAC), a novel framework that integrates priors and constraints into the segmentation process, such as continuous boundaries, smooth edges, and sharp corners. To do so, DSAC employs Active Contour Models (ACM), a family of constraint- and prior-based polygonal models. We learn ACM parameterizations per instance using a CNN, and show how to incorporate all components in a structured output model, making DSAC trainable end-to-end. We evaluate DSAC on three challenging building instance segmentation datasets, where it compares favorably against state-of-the-art. Code will be made available on https://github.com/dmarcosg/DSAC.
1 Introduction
Accurate footprints of individual buildings are of paramount importance for a wide range of applications, such as census studies [33], disaster response after earthquakes [25] and developmental assistances like malaria control [11]. Automating large-scale building footprint segmentation has thus been an active research field, and the emergence of high-capacity models like fully convolutional networks (FCNs) [13], together with vast training data [32], has led to promising improvements in this field.
 |
 |
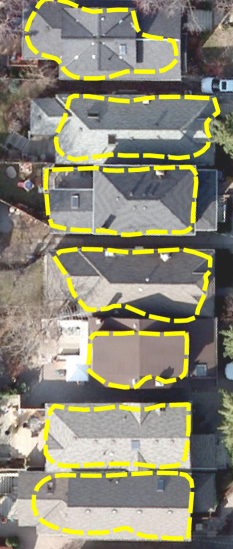 |
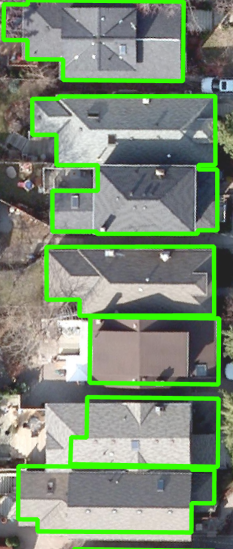
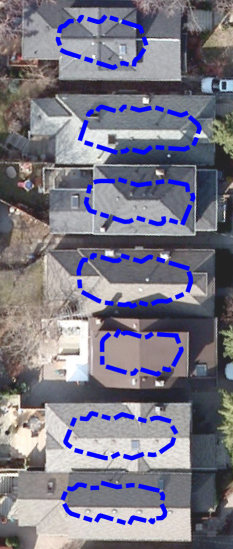
| GT | Init. | Result |
Most studies address semantic segmentation of buildings, which consists of inferring a class label (e.g. “building”) densely for each pixel over the overhead image of interest [16, 20, 21, 30]. While this approach may provide global statistics such as building area coverage estimation, it comes short at yielding estimations at the instance level. In computer vision, this problem is known as instance segmentation, where models provide a segmentation mask on a per-object instance basis. Solving this task is far more challenging than semantic segmentation, since the model has to understand whether any two building pixels belong to the same building or not. Precise delineation of object borders, with sharp corners and straight walls in the case of buildings, is a task that CNNs generally perform poorly at [9]: as a result, building segmentations from CNNs commonly have a high detection rate, but fail in terms of spatial coverage and geometric correctness.
Active Contour Models (ACM [17]), also called snakes, may be considered to address this issue. ACMs augment bottom-up boundary detectors with high-level geometric constraints and priors. They work by constraining the possible outputs to a family of curves (e.g. closed polygons with a fixed number of vertices), and optimizing them by means of energy minimization based on both the image features and a set of shape priors such as boundary continuity and smoothness. Additional terms have been proposed, among which the balloon term [7] is of particular interest: it mimics the inflation of a balloon by continuously pushing the snakes’ vertices outwards, thus preventing it to collapse to a single point. By expressing object detection as a polygon fitting problem with prior knowledge, ACMs have the potential of approaching object edges precisely and without the need for additional post-processing. However, the original formulation lacked flexibility, since it relied on low-level image features and a global parameterization of priors, when a more useful approach would be to penalize strongly the curvature in the regions of the boundary known to be straight or smooth and reduce the penalization in the regions that are more likely to form a corner. Moreover, the balloon term has so far only been included as a post-energy global minimization force and does not take part in the energy minimization defining the snake.
In this paper, we propose to combine the expressiveness of deep CNNs with the versatility of ACMs in a unified framework, which we term Deep Structured Active Contours (DSAC). In essence, we employ a CNN to learn the energy function that would allow an ACM to generate polygons close to a set of ground truth instances. To do so, DSAC leverages the original ACM formulation by learning high-level features and prior parameterizations, including the balloon term, in one model and on a local basis, i.e. penalizing each term differently at each image location. We cast the optimization of the ACM as a structured prediction problem and find optimal features and parameters using a Structured Support Vector Machine (SSVM [1, 29]) loss. As a consequence, DSAC is trainable end-to-end and able to learn and adapt to a particular family of object instances. We test DSAC in three building instance segmentation datasets, where it outperforms state-of-the-art models.
Contributions
This work’s contributions are as follows:
-
•
We formulate the learning of the energy function of an ACM as a structured prediction problem;
-
•
We include the balloon term of the ACM into the energy formulation;
-
•
We propose an end-to-end framework to learn the guiding features and local priors with a CNN.
2 Related work
Building footprint extraction
Most current automated approaches make use of 3D information extracted from ground or aerial LIDAR [31], or employ humans in the loop [4]. The use of a polygonal shape prior has been shown to substantially improve the results [27] of systems based on color imagery and low level features. Recent efforts employ deep CNNs for semantic segmentation and allowed a great leap towards full automation of building segmentation [16]. Works considering building instance segmentation are scarcer and the task has been recently defined as far-from-being solved [32], despite the interest shown by the participation to numerous contests aiming at automatic vectorization of building footprints from overhead imagery: SpaceNet111https://wwwtc.wpengine.com/spacenet, DSTL222https://www.kaggle.com/c/dstl-satellite-imagery-feature-detection or OpenAI Challenge333https://werobotics.org/blog/2018/01/10/open-ai-challenge/. Our proposed DSAC aims at making high-level geometric information available to CNN based methods as a step towards bridging this gap.
Instance segmentation in Computer Vision
Since instance segmentation combines object detection and dense segmentation, many proposed pipelines attempt at fusing both tasks in either separate or end-to-end trainable models. For example, [8] employ a multi-task CNN to detect candidate objects and infer segmentation masks and class labels per detection. [10] train a CNN on pairs of locations and predicts the likelihood for the pair to belong to the same object. [22] apply an attention-based RNN sequentially on deep image features to trace object instances in propagation order. [2] refine an existing semantic segmentation map by predicting a distance transform to the nearest boundary. High level relationships are accounted for in [23, 34] by means of an instance MRF applied to the CNN’s output.
All these methods employ pixel-wise CNNs and are thus not apt to integrating output shape priors directly, as polygonal output models would be. Only a few works deal with CNNs that explicitly produce a polygonal output. In [5], a recursive neural network is used to generate a segmentation polygon node by node, while in [24] a CNN predicts the direction of the nearest object boundary for each node in a polygon and uses it as a data term in an ACM. However, the first model is tailored towards a different problem (interactive segmentation and correction) and does not allow the inclusion of strong priors, and the second decouples the CNN training from ACM inference, thus lacking the end-to-end training capabilities of the proposed DSAC.
Active contours
The first ACMs were introduced by Kass et al. in 1988 under the name of snakes [17]. Variants of this original try to overcome some of its limitations, such as the need for precise initializations, or the dependence on user interaction. In [12] the authors propose to use two coupled snakes that better capture the information in the image. The above mentioned balloon force was introduced by [7].
Although some modifications [18] have been proposed to improve the data term of the original paper, they rely on simple assumptions about the appearance of the objects and on global parameters for weighting the different terms in the energy function. The proposed DSAC leverages the original formulation by including local prior information, i.e. values weighting the snakes’ energy function terms on a per-pixel basis, and learns them using a CNN. Although this work focuses on curvature priors useful for segmenting objects of polygonal shape, other priors can be enforced with ACMs, such as convexity for biomedical imaging [23].
Structured learning with CNNs
Structured prediction [28] allows to model dependencies between multiple output variables and hence offers an elegant way to incorporate prior rule sets on output configurations. End-to-end trainable structured models exceed traditional two-step solutions by enriching the learning signal with relations at the output level. Although these models have been applied to a variety of problems [3, 6, 26], we are not aware of any work dealing with instance level segmentation.
We use a structured loss as a learning signal to a CNN such that it learns to coordinate the different ACM energy terms, which are heavily interdependent.
3 Method
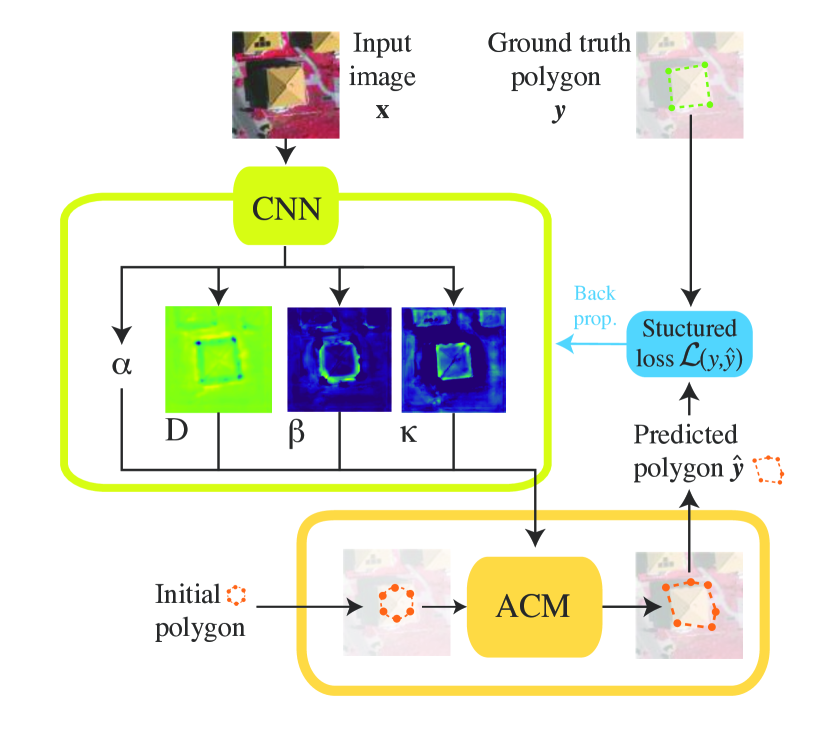
We present the details of a modified ACM inference algorithm with image-dependent and local penalization terms as well as the structured loss that is used to train a CNN to generate these penalization maps. A diagram of the proposed method is shown in Fig. 2. The proposed training algorithm proceeds as exposed in Algorithm 1.
Note that i) DSAC does not depend on any particular ACM inference algorithm, and ii) the chosen ACM algorithm does not need to be differentiable.
3.1 Locally penalized active contours
An active contour [17] can be represented as a polygon with nodes , with , where each represents one of the nodes of the discretized contour. The polygon is then deformed such that the following energy function is minimized:
| (1) |
where is the data term, depending on input image, of size , , are the terms encouraging short and smooth polygons respectively, is the balloon term and is the region enclosed by . The notation means the value in indexed by the position .
Due to their local nature, , and are maps in our experiments while is treated as a single scalar.
3.1.1 Data term
This term identifies areas of the image where the nodes of the polygon should lie. In the literature, is usually some predefined function on the image, typically related to the image gradients. should learn to provide relatively low values along the boundary of the object of interest and high values elsewhere. During ACM inference, the direction of steepest descent is used as the data force term, moving the contour towards regions where is low.
3.1.2 Internal terms
In the literature, the values of and are generally a single scalar, meaning that the penalization has the same strength in all parts of the object. This leads to a trade-off between over-smoothing corner regions and under-smoothing others. We avoid this trade-off by assigning different penalizations to each pixel, depending on which part of the object lies underneath.
The internal energy penalizes the length (membrane term) and curvature (thin plate term) of the polygon. In order to obtain the direction of steepest descent, we can express the internal energy as a function of finite differences:
| (2) |
and compute the derivative of w.r.t. the coordinates of node , , expressed as a sum of scalar products:
| (3) |
The Jacobian matrix (in this case with two column vectors) can then be expressed as a matrix multiplication:
| (4) |
where is a tri-diagonal matrix and is a penta-diagonal matrix.
3.1.3 Balloon term
The original balloon term [7] consists of adding an outwards force of constant magnitude in the normal direction of each node, thus inflating the contour. As with the term, we propose to increase its flexibility by allowing it to take a different value at each image location.
In [7], the balloon term is only considered as a force added after the direction of steepest descent for the other energy terms has been computed. In DSAC, the SSVM formulation requires to express it in the form an energy.
The normal direction to the contour at follows the vector:
| (5) |
This can be rewritten such that the whole set of normal vectors is expressed as:
| (6) |
where is a tri-diagonal matrix with in the main diagonal, in the upper diagonal and in the lower diagonal.
Integrating this expression with respect to and , we obtain the scalar , corresponding to the polygon’s area (by the shoelace formula to compute the area of a polygon):
| (7) |
Instead of maximizing the area of the polygon, which would be the result of pushing nodes in the normal direction, we propose to use a more flexible term that maximizes the integral of the values of a map over the area enclosed by the contour, . If we discretize the integral to the pixel values that conform , we obtain:
| (8) |
After this modification we need to recompute the force form of this term by finding the Jacobian matrix .
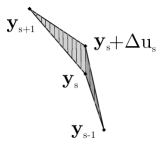
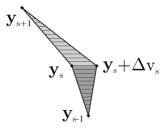
This corresponds to how a perturbation in and would affect . Since the perturbations are considered to be very small, we assume that the distribution of the values along the segments and will be identical to the one in and , respectively. As shown in Fig. 3, this boils down to summing a series of trapezoid areas, forming the two depicted triangles, each one weighted by its assigned value.
 |
 |
| a) | b) |
In Fig. 3a, both triangles have bases of length and heights and , while in Fig. 3b the bases are and the heights and .
To obtain the weighted areas in Fig. 3a, we compute:
| (9) |
and therefore the force term we need for inference is:
| (10) |
The same for Fig. 3b can be obtained by swapping and .
These derivatives point in the normal direction when the values of are equal in all locations.
3.2 Active contour inference and implementation
When solving the active contour inference, Eq. (1), the four energy terms can be split into external terms : the data () and balloon energies (); and internal terms : the energies penalizing length () and curvature (). Since depends only on the contour , we can find an update rule that minimizes it on the new time time step:
| (11) |
If we solve this expression for , we obtain:
| (12) |
With being the identity matrix. An efficient implementation of the ACM inference is critical for the usability of the method, since thousands of iterations are typically required by CNNs to be trained, and the ACM inference has to be performed at each iteration. We have implemented the described locally penalized ACM using a Tensorflow graph. The typical inference time is under 50 ms on a single CPU for the settings used in this paper.
3.3 Structured SVM loss
Since no ground truth is available for the penalization terms, we frame the problem as structured prediction, in which loss augmented inference is used to generate negative examples to complement the positive examples of the ground truth polygons. The weights of the energy terms can then be modified such that the energy corresponding to the ground truth is lowered, while the one of the loss augmented results, which are presumed to be wrong, is increased.
Given a collection of ground truth pairs , and a task loss function , we would like to find the CNN parameters such that, by optimizing Eq. (1) and thus obtaining the inference result:
| (13) |
one could expect a small . The problem becomes:
| (14) |
Since could be a discontinuous function, we can substitute it by a continuous and convex upper bound, such as the hinge loss. By adding an regularization and summing for all training samples, this becomes the max-margin formulation:
| (15) | ||||
Since is convex but not differentiable, we compute the subgradient, which requires to find the most penalized constraint with the current :
| (16) |
This means to first run the ACM using the current and an extra term corresponding to the loss . Once we obtain , we can then compute the subgradient as:
| (17) |
We compute the subgradients of the loss with respect to each of the four outputs as
| (18) |
| (19) | ||||
| (20) | ||||
| (21) |
In the above equations, represents the Iverson bracket. Finally, we can get using the chain rule and modifying each CNN parameter applying:
| (22) |
which will simultaneously decrease and increase , thus making a better solution more likely when performing inference anew.
Task loss
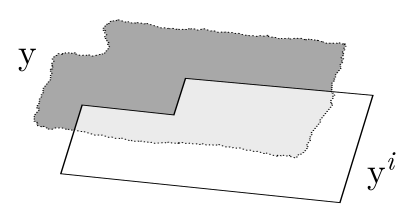
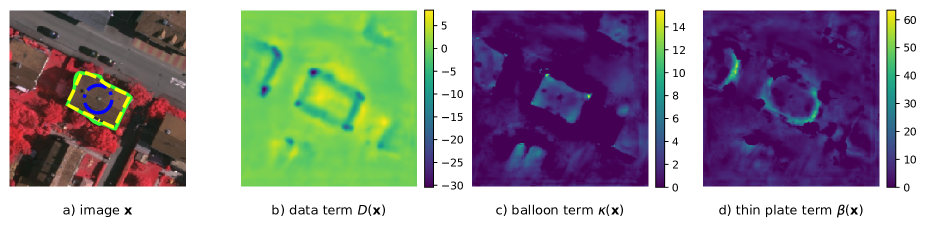
The task loss defines the actual objective we want to solve with the SSVM loss. Since it’s the most common metric in instance segmentation, we employ the Intersection-over-Union (IoU) between the prediction and the ground truth . Note that optimizing for IoU can be split into maximizing the intersection while minimizing the union. During training, this allows us to simply add a negative value during training to the map at the locations within the ground truth and a positive outside to obtain a loss-augmented inference (see Fig. 4).
4 Experiments
We test the proposed DSAC method for building footprint extraction from overhead images. We consider two settings: manual initialization, where the user provides a single click near the center of the building and automatic initialization, where an instance segmentation algorithm is used to generate the initial polygons. The first setting is tested in two datasets, Vaihingen and Bing Huts, while the second is tested in the TorontoCity dataset [32]. The three datasets are detailed in the respective sections.
4.1 CNN architecture and general setup
To learn the ACM energy terms, we use a CNN architecture similar to the Hypercolumn model in [14]. The input consists of a patch cropped around each initialization polygon and resized an image of fixed size for each dataset. The first layer consists of convolutions, the second of and all subsequent layers are of size . All the convolutional layers are followed by ReLu, batch normalization and max-pooling. The number of filters is increased with the depth: , , ,, and for the six blocks. The output tensors of all the layers are then upsampled to the output size and concatenated. After this, a two-layer MLP with 256 and 64 hidden units is used to predict the four output maps: , , and . We use this architecture for all datasets, with the exception of the Bing huts dataset, for which we skip the last two convolutional layers. In all cases, we use the Adam optimizer with a learning rate of . We augment the data with random rotations. The number of ACM iterations is set to 50 in all the experiments, and the number of nodes is set to in Vaihingen and TorontoCity and in Bing huts.
4.2 Manual initialization
In this setting, the detection step is done manually by visual inspection. The only input required from the user is a single click to indicate the approximate center of the building. Two datasets are considered:
Vaihingen buildings
The dataset consists of 168 buildings extracted from the training set of the ISPRS “2D semantic labeling contest”444http://www2.isprs.org/commissions/comm3/wg4/semantic-labeling.html. The images have three bands, corresponding to near infrared, red and green wavelengths, and a resolution of 9 cm. We used buildings to train the models and the remaining as a test set.
Bing huts
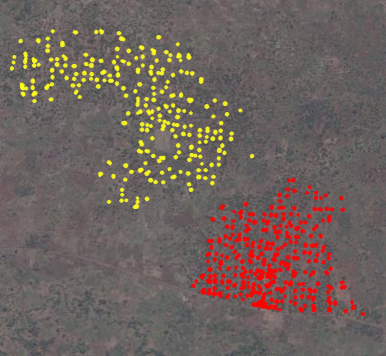
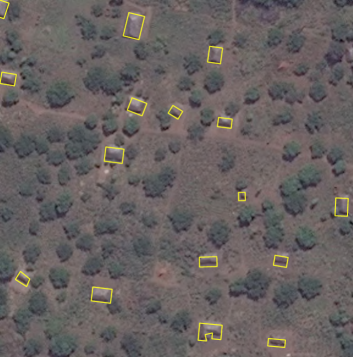
The dataset consists of individual huts visible on Bing maps aerial imagery at a resolution of cm, over a rural area in Tanzania. See Fig. 5 for an overview of the study area and Fig. 7 for a full resolution subset. The ground truth building footprints have been obtained from OpenStreetMap555http://www.openstreetmap.org. A total of images of size pixels are used to train the models and the remaining to test. The lower spatial resolution, low contrast between the buildings and the surrounding soil, as well as the high level of label noise make Bing huts a very challenging dataset.
We compare DSAC against a baseline where we train a CNN with the same architecture used by DSAC, but with a 3-class cross entropy loss with classes: building, building boundary, background. The boundary class is added to help the model focus on learning the shapes of the buildings. In this case, the click from the user is used to select the nearest connected region that has been labeled as building and treat it as the instance prediction.
 |
 |
4.3 Automatic initialization
Although the manual initialization only requires a single click from the user, it can still be a tedious task for large scale datasets. Existing instance segmentation algorithms, such as the recently proposed Deep Watershed Transform (DWT) [2], can be used instead to initialize the active contours. These methods have a good recall, but tend to undersegment the objects and to lose detail near to the boundaries. To compensate for this effect, the authors of [2] apply a morphology-based post-processing step. We test the possibility of initializing the ACM within DSAC with the results obtained by [2] on the TorontoCity building instance segmentation dataset [32], with around instances for training and for testing. The ACM contours are initialized with the output of the Deep Watershed Transform (DWT) [2], the current state-of-the-art in terms of IoU. Two initialization polygon types are considered: the raw DWT output and the post-processed versions used in [32]. We also consider a third variant, where the raw DWT is used at train time and the post-processed one for inference at test time: this variant is based on the intuition that making the problem harder at train time, in addition to using the loss augmentation, helps learning a better energy function.
5 Results and discussion
Manual initialization
Table 1 reports the average Intersection over Union (IoU) for the two datasets. Since the ground truth shift noise in the Bing huts dataset makes the IoU assessment untrustworthy, the root mean square error (RMSE in ) committed when estimating the area of the building footprints is also reported. DSAC significantly improves the baseline in terms of IoU for both datasets. This ablation study confirms the need to allow and to vary locally (as opposed to having a single value for the whole image), while can be treated as a single value without loss of performance. It also highlights the importance of the balloon term for the convergence of the contour.
| Average IoU | RMSE | ||
| Vaihingen | Bing huts | Bing huts | |
| CNN Baseline | 0.78 | 0.56 | 23.9 |
| DSAC (ours) | 0.84 | 0.65 | 13.4 |
| DSAC (scalar , ) | 0.64 | 0.60 | 19.1 |
| DSAC (no ) | 0.63 | 0.42 | 31.2 |
| DSAC (local ) | 0.83 | 0.65 | 13.4 |
Examples of segmentation results for the Vaihingen dataset (Fig. 7, top row) show that the learned priors do indeed promote smooth, straight edges while often allowing for sharp corners. By looking at the predicted energy terms in Fig. 6 we observe that the model focuses on the corners by producing very low values close to them, while predicting high inside the building next to the corners and a sharp drop to on the outside. Moreover, the smoothness term is close to at the corners and high along the edges.
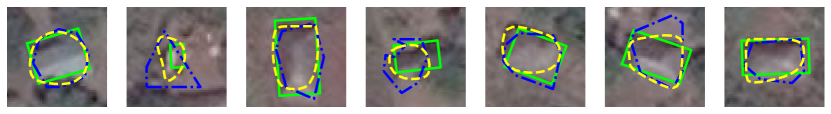
In the Bing huts dataset results (Fig. 7, bottom row), the biggest jump in performance can be seen in the area estimation metric. DSAC still tends to oversmooth the shapes, probably since it is unable to learn the location of corners due to the ground truth shift noise inherent to OpenStreetMap data, but manages to converge to polygons of the correct size, most probably because it learns to balance the balloon (, promoting large areas) and the membrane (, promoting short contours) terms.
Automatic initialization
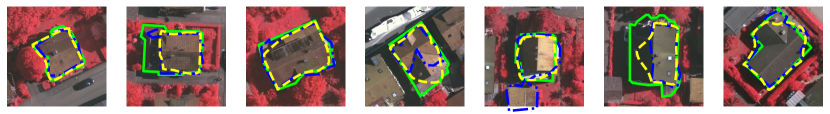
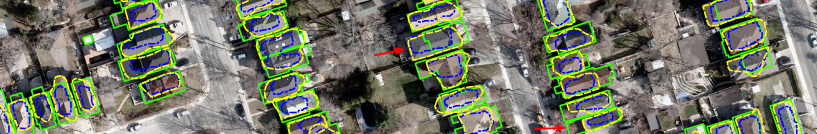
Table 2 reports the results obtained on the TorontoCity dataset using two metrics: the IoU-based weighted coverage (“WeighCov”) and the shape similarity PolySim [32]. Besides DWT, we also compare DSAC against the results of building footprint segmentation with FCN and ResNet, as reported in [32]. We observe an improvement with respect to DWT of both metrics. DSAC obtains the best weighted coverage scores irrespectively of the initialization strategy. Interestingly, the best results are obtained by the hybrid initialization using raw DWT at training time and post-processed DWT polygons at test time. This suggests that our intuition about making the model work harder at train time is correct and seems to complement the use of a task loss in the SSVM loss. Finally, segmentation examples are shown in the last row of Fig. 7: DSAC (in yellow) consistently returns a more desirable segmentation with respect to DWT (in blue), closer to the ground truth polygon (in green). Although we can still see oversmoothing in our results, note how an important amount of shift noise is also present in some instances, making the DSAC result more plausible than the ground truth in a few cases (red arrows).
| WeighCov | PolySim | |
| FCN [19] | 0.46 | 0.32 |
| ResNet [15] | 0.40 | 0.29 |
| DWT, raw [2] (RW) | 0.42 | 0.20 |
| DWT, postproc. (PP) | 0.52 | 0.24 |
| DSAC (init.: train RW / test RW) | 0.55 | 0.26 |
| DSAC (init.: train PP / test PP) | 0.57 | 0.26 |
| DSAC (init.: train RW / test PP) | 0.58 | 0.27 |
6 Conclusion
We have shown the potential of embedding high-level geometric processes into a deep learning framework for the segmentation of object instances with strong shape priors, such as buildings in overhead images. The proposed Deep Structured Active Contours (DSAC) uses a CNN to predict the energy function parameters for an Active Contour Model (ACM) such as to make its output close to a ground truth set of polygonal footprints. The model is trained end-to-end by bringing the ACM inference into the CNN training schedule and using the ACM’s output and the ground truth polygon to assess a structured loss that can be used to update the CNN’s parameters using back-propagation. DSAC opens up the possibility of using a large collection of energy terms encoding for different priors, since an adequate balance between them is learned automatically. The main limitation of our model is that the initialization is assumed to be given by some external method and is therefore not included in the learning process.
Results in three different datasets, which include a relative improvement over the state-of-the-art on the TorontoCity dataset, show that combining the bottom-up feature extraction capabilities of CNNs with the high-level constraints provided by ACMs is a promising path for instance segmentation when strong geometric priors exist.
References
- [1] Y. Altun, T. Hofmann, and I. Tsochantaridis. Support vector learning for interdependent and structured output spaces. In G. Bakir, T. Hofmann, B. Schölkopf, A. J. Smola, and S. Vishwanathan, editors, Predicting Structured Data, pages 85–105. MIT press, 2007.
- [2] M. Bai and R. Urtasun. Deep watershed transform for instance segmentation. In CVPR, 2017.
- [3] D. Belanger and A. McCallum. Structured prediction energy networks. In ICML, pages 983–992, 2016.
- [4] R. Brooks, T. Nelson, K. Amolins, and G. B. Hall. Semi-automated building footprint extraction from orthophotos. Geomatica, 69(2):231–244, 2015.
- [5] L. Castrejon, K. Kundu, R. Urtasun, and S. Fidler. Annotating object instances with a polygon-RNN. In CVPR, 2017.
- [6] L.-C. Chen, A. Schwing, A. Yuille, and R. Urtasun. Learning deep structured models. In ICML, pages 1785–1794, 2015.
- [7] L. D. Cohen. On active contour models and balloons. CVGIP: Image understanding, 53(2):211–218, 1991.
- [8] J. Dai, K. He, and J. Sun. Instance-aware semantic segmentation via multi-task network cascades. In CVPR, pages 3150–3158, 2016.
- [9] J. Dai, Y. Li, K. He, and J. Sun. R-fcn: Object detection via region-based fully convolutional networks. In Advances in neural information processing systems, pages 379–387, 2016.
- [10] A. Fathi, Z. Wojna, V. Rathod, P. Wang, H. O. Song, S. Guadarrama, and K. P. Murphy. Semantic instance segmentation via deep metric learning. arXiv preprint arXiv:1703.10277, 2017.
- [11] J. Franke, M. Gebreslasie, I. Bauwens, J. Deleu, and F. Siegert. Earth observation in support of malaria control and epidemiology: MALAREO monitoring approaches. Geospatial health, 10(1), 2015.
- [12] S. R. Gunn and M. S. Nixon. A robust snake implementation; a dual active contour. IEEE Transactions on Pattern Analysis and Machine Intelligence, 19(1):63–68, 1997.
- [13] S. Gupta, R. Girshick, P. Arbeláez, and J. Malik. Learning rich features from RGB-D images for object detection and segmentation. In ECCV, pages 345–360. Springer, 2014.
- [14] B. Hariharan, P. Arbeláez, R. Girshick, and J. Malik. Hypercolumns for object segmentation and fine-grained localization. In CVPR, pages 447–456, 2015.
- [15] K. He, X. Zhang, S. Ren, and J. Sun. Deep residual learning for image recognition. In CVPR, pages 770–778, 2016.
- [16] P. Kaiser, J. D. Wegner, A. Lucchi, M. Jaggi, T. Hofmann, and K. Schindler. Learning aerial image segmentation from online maps. IEEE Transactions on Geoscience and Remote Sensing, 2017.
- [17] M. Kass, A. Witkin, and D. Terzopoulos. Snakes: Active contour models. International Journal of Computer Vision, 1(4):321–331, 1988.
- [18] S. Kichenassamy, A. Kumar, P. Olver, A. Tannenbaum, and A. Yezzi. Gradient flows and geometric active contour models. In ICCV, pages 810–815. IEEE, 1995.
- [19] J. Long, E. Shelhamer, and T. Darrell. Fully convolutional networks for semantic segmentation. In CVPR, pages 3431–3440, 2015.
- [20] E. Maggiori, Y. Tarabalka, G. Charpiat, and P. Alliez. Convolutional neural networks for large-scale remote-sensing image classification. IEEE Transactions on Geoscience and Remote Sensing, 55(2):645–657, 2017.
- [21] J. A. Montoya-Zegarra, J. D. Wegner, L. Ladickỳ, and K. Schindler. Semantic segmentation of aerial images in urban areas with class-specific higher-order cliques. ISPRS Annals of the Photogrammetry, Remote Sensing and Spatial Information Sciences, 2(3):127, 2015.
- [22] B. Romera-Paredes and P. H. S. Torr. Recurrent instance segmentation. In ECCV, pages 312–329. Springer, 2016.
- [23] L. A. Royer, D. L. Richmond, C. Rother, B. Andres, and D. Kainmueller. Convexity shape constraints for image segmentation. In CVPR, 2016.
- [24] C. Rupprecht, E. Huaroc, M. Baust, and N. Navab. Deep active contours. arXiv preprint arXiv:1607.05074, 2016.
- [25] L. Sahar, S. Muthukumar, and S. P. French. Using aerial imagery and GIS in automated building footprint extraction and shape recognition for earthquake risk assessment of urban inventories. IEEE Transactions on Geoscience and Remote Sensing, 48(9):3511–3520, 2010.
- [26] A. G. Schwing and R. Urtasun. Fully connected deep structured networks. arXiv preprint arXiv:1503.02351, 2015.
- [27] X. Sun, C. M. Christoudias, and P. Fua. Free-shape polygonal object localization. In ECCV, pages 317–332. Springer, 2014.
- [28] B. Taskar, V. Chatalbashev, D. Koller, and C. Guestrin. Learning structured prediction models: A large margin approach. In ICML, pages 896–903. ACM, 2005.
- [29] I. Tsochantaridis, T. Finley, T. Joachims, T. Hofmann, and Y. Altun. Large margin methods for structured and interdependent output variables. Journal of Machine Learning Research, 6:1453–1484, 2005.
- [30] M. Volpi and D. Tuia. Dense semantic labeling of subdecimeter resolution images with convolutional neural networks. IEEE Transactions on Geoscience and Remote Sensing, 55(2):881–893, 2017.
- [31] O. Wang, S. K. Lodha, and D. P. Helmbold. A bayesian approach to building footprint extraction from aerial lidar data. In International Symposium on 3D Data Processing, Visualization, and Transmission, pages 192–199. IEEE, 2006.
- [32] S. Wang, M. Bai, G. Mattyus, H. Chu, W. Luo, B. Yang, J. Liang, J. Cheverie, S. Fidler, and R. Urtasun. TorontoCity: Seeing the world with a million eyes. arXiv preprint arXiv:1612.00423, 2016.
- [33] Y. Xie, A. Weng, and Q. Weng. Population estimation of urban residential communities using remotely sensed morphologic data. IEEE Geoscience and Remote Sensing Letters, 12(5):1111–1115, 2015.
- [34] Z. Zhang, S. Fidler, and R. Urtasun. Instance-level segmentation for autonomous driving with deep densely connected mrfs. In CVPR, pages 669–677, 2016.