Quantized Dehydration and the Determinants of Selectivity in the NaChBac Bacterial Sodium Channel
Abstract
A discrete electrostatic/diffusion model has been developed to describe the selective permeation of ion channels, based on ionic Coulomb blockade (ICB) and quantised dehydration (QD). It has been applied to describe selectivity phenomena measured in the bacterial NaChBac sodium channel and some of its mutants. Site-directed mutagenesis and the whole-cell patch-clamp technique were used to investigate how the value of the fixed charge at the selectivity filter (SF) affected both valence and alike-charge selectivity. The new ICB/QD model predicts that increasing should lead to a shift of selectivity sequences towards larger ion sizes and charges, a result that agrees with the present experiments and with earlier work. Comparison of the model with experimental data provides evidence for an effective charge at the SF that is smaller in magnitude than the nominal corresponding to the charge on the isolated protein residues. Furthermore, was different for aspartate and glutamate charged rings and also depended on their position within the SF. It is suggested that protonation of the residues within the restricted space is an important factor in significantly reducing the effective charge of the EEEE ring. Values of derived from experiments on the anomalous mole fraction effect (AMFE) agree well with expectations based on the ICB/QD model and have led to the first clear demonstration of the expected ICB oscillations in Ca2+ conduction as a function of the fixed charge. Pilot studies of the dependence of Ca2+ conduction on pH are consistent with the predictions of the model.
Introduction
Biological ion channels provide for the highly-selective passive transport of physiologically important ions (e.g. Na+, K+ and Ca2+) through the bilipid membranes of living cells. The channels consist of nanopores within complex proteins embedded in the membrane. Their selectivity for particular cations is determined by the electrostatically-driven stochastic motion of ions within a short and narrow selectivity filter (SF) carrying a binding site with fixed negative charge [1]. Following Eisenman [2] ionic selectivity arises through a balance between repulsion by the dehydration/self-energy barrier and electrostatic attraction/affinity to the binding site, resulting in resonant barrier-less conduction for the selected ion [3, 4, 5, 6, 7, 8], and leading to selectivity phenomena such as the divalent blockade of the sodium current [9, 10] and the anomalous mole fraction effect (AMFE) [11, 10].
The resonant barrier-less permeation can be described in terms of ionic Coulomb blockade (ICB), an electrostatic phenomenon that appears in low-capacitance mesoscopic systems [12, 13, 14, 15, 16, 17, 18]. ICB predicts to be an important determinant of selectivity, and one that is manifested strongly for divalent ions e.g. by giving rise to Ca2+ conduction bands [15]. ICB is closely similar to its electronic counterpart in quantum dots [19, 20] and nanostructures[21, 22]. The basic ICB model for the permeation and selectivity of ion channels [18] has recently been enhanced [23, 24] by the introduction of shift/corrections to allow for the singular part of the ionic attraction to the binding site (i.e. local site-binding), as well as for arbitrary additional ion excess chemical potential . The geometry-dependent shift of the ICB calcium resonant point, following from this correction, leads to a change in the divalent (calcium) blockade threshold [23].
The voltage-gated bacterial sodium channels NaChBac, NavAb, NavMs, and NvsBa are a family of relatively simple channels with discovered structures. Hence they are widely used in modelling the general features of conductivity and selectivity [25, 26, 27, 28, 29, 30, 31, 32]. Site-directed mutagenesis, varying the fixed charge at the SF, is known to change their selectivity, switching sodium channels to calcium and vice versa. In turn, the alteration of similarly-charged glutamate residues to aspartate was also found to influence the channels’ conductivity and selectivity [26, 27, 28, 29]. The nature and physical origin of such transformations has remained unclear.
In this paper, we further enhance the ICB model by inclusion of the effect of quantised dehydration (QD) [3, 13, 8]. The resultant ICB/QD model ia applied to an analytic, numerical and experimental study of the effect of the fixed charge on the conductance and selectivity of NaChBac bacterial sodium channels and relevant mutants [26, 29, 30, 33, 34]. In doing so, we develop a novel picture of resonant quantized dehydration, combining the idea of quantized (shell-based) dehydration with the balance/shift-enhanced ICB model. Our systematic mutation study of selectivity in the NaChBac channel will be used to show that the ICB/QT model can account for the experimental Eisenman sequences and for measurements of the anomalous mole fraction effect (AMFE) in the mutants.
In what follows, with SI units, is the permittivity of free space, is the elementary charge, is Boltzmann’s constant and is the temperature. We use the conventional shorthand symbols for amino acid residues: L–Leucine; E–Glutamate (); D–Aspartate (); S–Serine; W–Tryptophan; A–Alanine; K–Lysine (); T–Threonine; and so on.
| Mutant | Selectivity Filter Sequence | ||||||
|---|---|---|---|---|---|---|---|
| channels | 190 | 191 | 192 | 193 | 194 | 195 | |
| Wild type | L | E | S | W | A | S | -4 |
| E191D | L | D | S | W | A | S | -4 |
| E191A | L | A | S | W | A | S | 0 |
| S192K | L | E | K | W | A | S | 0 |
| S192E | L | E | E | W | A | S | -8 |
| S192D | L | E | D | W | A | S | -8 |
| E191D, S192E | L | D | E | W | A | S | -8 |
| E191D, S192D | L | D | D | W | A | S | -8 |
Experimental materials and methods
Channels/mutants studied
The voltage-gated NaChBac bacterial channel [25, 26] is a tetrameric channel, whose SF is formed by 4 trans-membrane segments each containing the six-amino-acid sequence LESWAS, corresponding to residues 190 –- 195). This structure provides the highly-conserved {EEEE} locus E191 with a nominal which is considered to create a single binding site for both mono- and divalent moving ions [26, 25]. Table 1 presents the set of channels generated and studied in the current research.
Generation and expression of wild-type and mutant NaChBac channels
The NaChBac (GenBank accession number BAB05220) cDNA construct containing 274 amino acid residues was synthesised by EPOCH Life Science (www.epochlifescience.com) and subcloned into the mammalian cell expression vector pTracer-CMV2 (Invitrogen). Single amino acid mutations in the pore region of NaChBac were generated by site-directed mutagenesis using oligonucleotides containing the sequence for the desired amino acid substitutions (primers are listed in supplemental table 1) and Q5 Site-Directed Mutagenesis Kit (New England BioLabs Inc.). All mutations were confirmed by DNA sequencing. Wild-type (wt) NaChBac and mutant cDNAs were transiently transfected into CHO cells with TransIT-2020 (Mirus Bio). Transfected cells were identified by GFP fluorescence using an inverted fluorescence microscope (Nikon TE2000-s) and used for electrophysiological investigation 24 –-48 hours after transfection.
Electrophysiology
Whole-cell voltage clamp recordings were performed at room temperature (20∘C) using an Axopatch 200A (Molecular Devices, Inc.) amplifier. Whole cell currents were elicited by a series of step depolarizations (+95mV to -85mV in -15mV steps) from of -100mV. Details of the patch-clamp methods are presented in the Supplemental Information.
Results and discussion.
The main aims of the research were to establish the dependence of the conductivity and selectivity of NaChBac mutants on the fixed charge at the SF, and also on (DE) substitutions within the SF, in order to see whether the results could be understood within the framework of the ICB model. Increasing the value of was expected to lead to stronger divalent blockade following the Langmuir isotherm and to a resonant variation of the divalent current with [17, 33].
Previous mutant studies [26, 25, 27, 29] investigated a limited number of possible (D,E) combinations in the key positions 191 and 192. Our systematic study of the possible mutants L{ES/DS/EE/ED/DE/DD}WAS enables us to identify the influence both of the fixed charge and of D/E substitutions in positions 191 and 192. Here we present selectivity sequences for monovalent and divalent ions, recorded for the mutants listed above, with nominal fixed charge from to , with the permutations of D and E shown in Table. 1. We have also made divalent blockade/AMFE measurements, providing us with the experimental information needed for application of the extended ICB model (see below) incorporating the effect of quantised dehydration.
Resonant quantized dehydration
We consider the stochastic transport of a fully-hydrated Ca2+ ion with a charge of . The original ICB model, based on first-principles electrostatics and taking account of charge discreteness and an electrostatic exclusion principle, specifies the parameters for the resonant () conduction points and Coulomb blockade/neutralisation points . These are defined [17, 18] by the condition for barrier-less motion ,
| (1) |
The basic ICB model can be extended by consideration of an added free energy per ion. This excess chemical potential arises from different sources [35, 36, 37]. Inclusion of the ICB barrier-less condition leads to a “shift equation” [23, 24, 33]
| (2) |
where the additional energies lead to shifts in the resonant barrier-less point [18, 17, 33]. The most important of these are:
-
•
A concentration-related bulk entropy shift ; and
-
•
A dehydration shift .
Here, is the electrical self-capacitance of the channel [17] and is the base ICB barrier-less point; a similar equation was derived earlier [38, 24].
Dehydration, full or partial is thought to be the main source of selectivity between equally charged ions, e.g. monovalent alkali metal ions [3, 39, 40, 41]. The basic ICB model takes account of hydration/dehydration only through the dielectric self-energy [3, 42] which does not depend on the size of the ion, so additional effects need to be included in the model.
One such effect is the discreteness of the hydration shells, which strongly influences the selectivity [3, 13, 7, 8]. Details of the ion-ligand interactions [43, 8, 44] and multi-ion knock-on mechanisms [4, 45] are also important. A hydrated ion is assumed to be surrounded by spherical, discrete, single-molecule water shells of equal radial thickness . The first shell is immediately adjacent to the ion, so the hydrated ion moves as an ion-water complex of radius . The shell model of hydration has been well-validated by experimental, analytical and numerical evidence. So, consistent with the positions of the minima in experimental and MD-simulated radial density functions [46, 13], we will take nm for monovalent ions and nm for divalent ions.
We will consider an ion that retains its first shell untouched during its passage through the SF as remaining fully hydrated. Otherwise ions must lose/rearrange their first hydration shells with corresponding energy penalties. While small rearrangements of the shell are relatively cheap energetically, a decrease in the coordination number immediately leads to significant expense.
Generic shell-based quantized dehydration (QD) models provide a simple explanation for the difference in K+/Na+ selectivity between K+ and Na+/Ca2+ channels [3, 8]: within narrow K+ channels, both Na+ and K+ ions are fully dehydrated. The first hydration shell is more tightly-bound to the smaller Na+ ion, , and the channel therefore favours the larger ion. In contrast, the moderately wide Na+ or Ca2+ channels accommodate both Na+ and K+ ions with their first hydration shells intact. In such cases [13] and the channel favours the smaller Na+ ion. However, generic models of this kind cannot explain the influence of on the selectivity sequences of a channel.
In order to go further, we now combine the ideas of the QD models [13, 8] with the Eisenman-inspired model of barrier-less selectivity [2, 5, 7] and, in particular, with the enhanced ICB model [17, 23, 24]. In the picture proposed, the difference in is not enough per se to determine which species will be selected over the other as this choice could be changed or even inverted by the value of needed to provide barrier-less conduction, i.e. by the corresponding shift of the resonant point . Hence, if increases with then will also increase for the wider Na+/Ca2+ channels, but vice versa decrease for the narrower K+ channels.
We assume that, for an Na+/Ca2+ channel (), the electrostatic field of the ion inside the channel can be decomposed in terms of a small parameter as , where:
-
•
is the main field, which is 1D (flat) Coulomb field localized inside the channel;
-
•
is the “leaking/dehydration field”, which is the spherical field of the ion attenuated by a factor of ;
and we take the following equation for the dehydration energy (the key assumption for our model):
| (3) |
Here, the shell-based dehydration energy is from a Laio/Zwolak-type semi-empirical approximation for the first shell energy and for [13]:
| (4) | ||||
| (5) |
where . This equation provides an expression for the hydration-shift in the selectivity of ion channels due to resonant quantized dehydration.
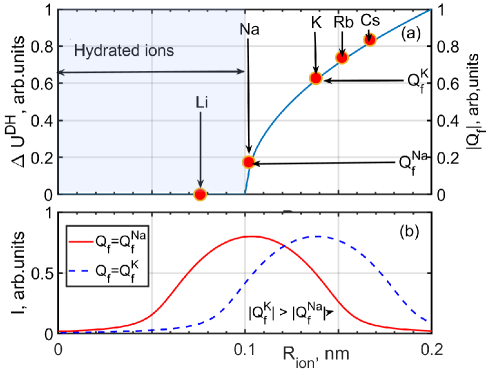
Fig. 1 illustrates the basis of the quantized dehydration picture for monovalent ions in the selectivity filters (SF) of NaChBac and relevant mutants. The radius of the SF is taken as nm (the common value used in our simulations and calculations [15, 16]), whereas the first shell thickness nm. Effective ionic radii are taken from [47]. The dehydration energy (blue solid line) is calculated to be proportional to where , according to [3, 13]. The shaded area indicates where ions retain their 1-st hydration shell within the SF. Plot (a) shows that Li+ and Na+ ions belong to “fully hydrated” range of whereas K+, Rb+ and Cs+ lie at a rapidly rising part of the dehydration energy curve and hence require significant shifts in to balance dehydration penalty by site affinity to provide barrier-less conduction. Plot (b) shows the current vs. plotted for different values of , showing resonance for Na+ and K+, respectively. Monovalent ions present wide resonance curves, typical of weak ICB [16, 17].
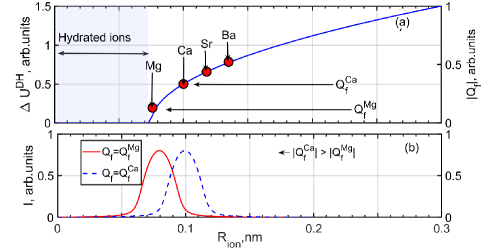
Fig. 2 shows comparable plots for divalent ions. Plot (a) shows that the Mg2+ ion belong to the “fully hydrated” range of , whereas Ca2+, Sr2+ and Ba2+ all require appropriate shifts in to provide barrier-less conduction. Plot (b) shows current vs curves for different values of , showing resonances for Mg2+ and Ca2+, respectively. The results and predictions are rather similar to those for monovalent ions but yield the much narrower resonances typical of strong ICB [16, 17], corresponding to the stronger dependence of conduction on ion radius.
In summary, after inclusion of resonant quantized dehydration effects, the resultant QD/ICB model predicts the following dependences of a channel’s selectivity on , channel radius and ion size :
- •
-
•
Moderately-wide channels ( nm, e.g. NaChBac, NavAb, or Cav) conduct ions that retain their first hydration shells. In this case, low-charged mutants can conduct small (Li+ and Na+) ions and the growth of leads to an inverse shift of Eisenman sequence toward the larger ions, i.e. Na+ K+. We note, however, the earlier speculation by Corry and Thomas [43] that the inverse shift might be due to a “best fit” mechanism.
Ionic conductance for deleted-charge and balanced-charge mutants
The ICB model predicts that, for an uncharged pore (), the self-energy barrier should prevent conduction of any kind of ions. This condition corresponds to the ICB blockaded point [17].
In the experiments, the mutations E191A (generating LASWAS) and S192K (generating LEKWAS) were both used to produce NaChBac mutants with =0. These zero-charged mutants exhibited no measurable conduction of either monovalent nor divalent cations (see Supplemental Figure 2.), consistent with the ICB model. Although the model predicts even stronger current suppression for divalent ions, that difference was below the sensitivity of our measurements.
Rather similar ICB-driven blockade was recently observed in artificial sub-nm MoS2 nanopores, where a voltage/energy gap was found corresponding to zero ionic current for both mono- and divalent ions [22].
Monovalent selectivity sequences of charged mutants
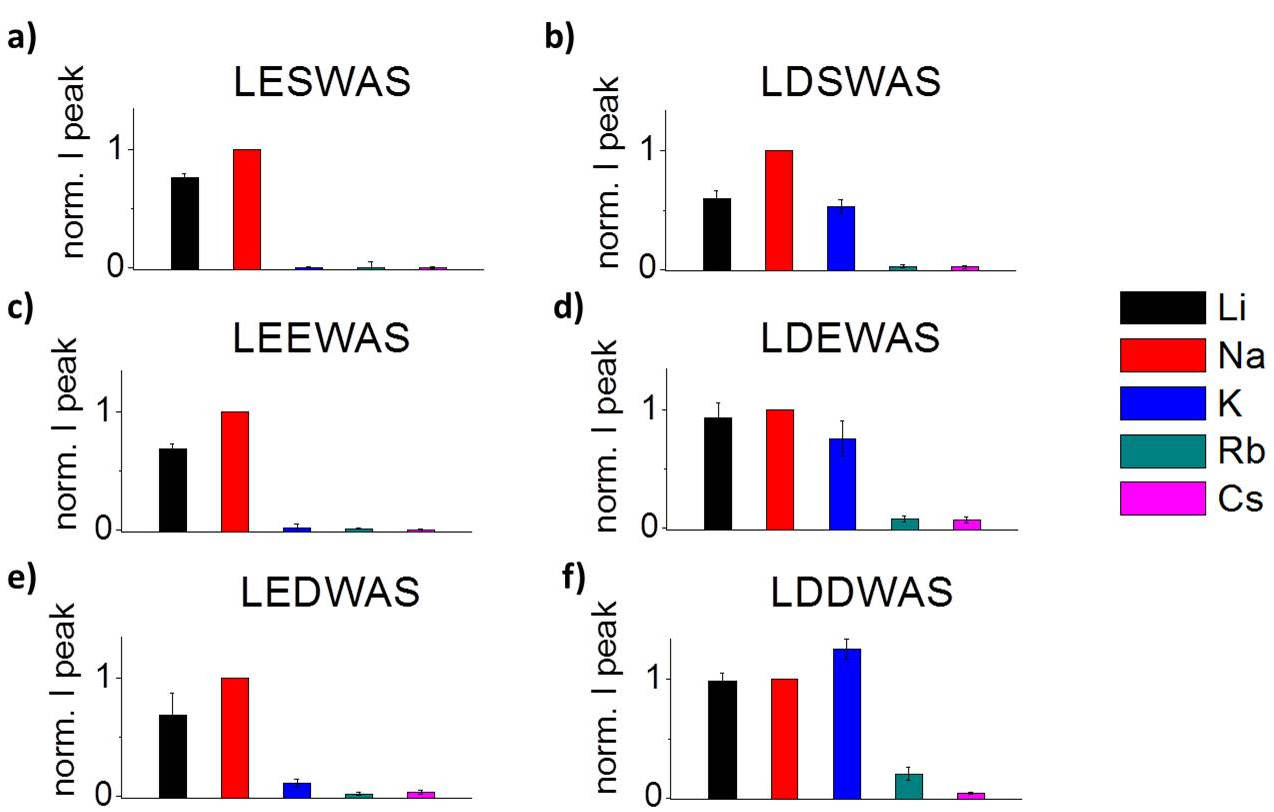
Fig. 3 presents the mutation-induced transformations for the monovalent cation selectivity of the mutants studied. The peak conductivities for (a) wild type NaChBac LESWAS and the five mutants (b)-(f) as labelled were determined by normalising peak current magnitudes from the same cell recorded in a bath solution with Na+, prior to replacement of the Na+ by the test cation Li+, K+, Rb+ or Cs+ as indicated.
Fig. 3 can be thought as a “mutation matrix” in a Design of Experiment sense [48]. Taking Y={S, E, D}, the different columns correspond to different residues at position 191: E191 (LEYWAS) for the left column and D191 (LDYWAS) for the right column. The different rows correspond to varying the residue in position 192 LXYWAS. The first row (a), (b) of Fig. 3 represents the singly-charged mutants LESWAS, LDSWAS, while the other two rows represent a 22 submatrix of the nominally doubly-charged mutants LEEWAS/LDEWAS/LDEWAS/LDDWAS. Supplemental Material Fig. 3 shows the original characteristics for monovalent conductance. Supplemental Table 3 lists values for the permeability ( calculated from ), and the conductance ( calculated from ) ratios.
Fig. 3 shows the first observations of the expected “shift phenomenon”: mutation E191D leads to a strong shift of the monovalent sequences from Na+ (left column) towards K+ (right column), whereas varying the residue in position 192 SED leads to a weaker shift in the same direction. Now we consider these phenomena in more detail.
ED substitution at key SF positions
Earlier experiments have shown that bacterial channels/mutants exhibit different selectivity features depending on similarly-charged residue rings (DDDD or EEEE) at the key site position 191 [26, 29, 27] Studies of the E191D mutation in NaChBac [27, 28] (or, equivalent, E178D mutations in NavMs [29] and vice versa) have shown that the ED substitution in the key position leads to a significant change in the selectivity features even though there is no change of the nominal charge.
Thus for NaChBac, comparison of the D191 mutants with the E191 wild-type channel shows that the residue at position 191 is the main determinant of monovalent selectivity. The mutation E191D leads to the emergence of K+ conduction and to a general shift of monovalent selectivity sequences toward larger ions[28]. A similar selectivity shift was recorded for the E178D mutation in the NavMs channel [29].
Reversible mutation-induced transformations of mono- and divalent selectivity sequences between Na+-selective NaChaBac (LESWAS) and non-selective NsvBa (LDSWGS) bacterial channels was studied by DeCaen et al. [27]. They showed that an ED mutation transforms the NaChBac channel to a non-selective analogue of NsVBa and vice versa, DE substitution at the SF of NsvBa results in an Na+-selective channel similar to NaChBac, i.e. the selectivity is critically dependent on the type of charged residue at the key position inside the SF.
Our results (Fig. 3 (a), (b)) also demonstrate the strong influence of the E191D mutation on monovalent conduction and selectivity of the wild type LESWAS channel:
Comparison of the D191 mutants (left column of Fig. 3) with appropriate E191 mutants (right column of Fig. 3) shows that the residue in position 191 is the main determinant of monovalent selectivity in NaChBac mutants. Mutation E191D leads to shift of maximal monovalent conductance toward larger ions. It can be explained by significant growth of site affinity or “equivalent charge” connected with that substitution. Note that the NaK channel, possessing similar DDDD charged ring at the SF, is also Na/K non-selective [49].
Fig. 3 also shows that additional E192D mutations lead to relatively weak extra shift in the same direction.
Eisenman selectivity sequences: -induced shift
Fig. 3 presents Eisenman monovalent sequences for all the conducting mutants presented in the study. The ICB/QD model predicts a shift of the permeability ratio sequence towards the larger ions side, proportional to value as main determinant of selectivity, Eq. 5. However, the experiments reveal a more complicated picture. The mutant sequences can be separated into groups in terms of their dependence on and on the residue type (D or E) at position 191, namely:
-
•
LESWAS, LEEWAS and LEDWAS. All mutants having an E191 residue present Na+-centred Eisenman sequences, whereas increasing the nominal total charge from for LESWAS to for LEEWAS and LEDWAS leads only to a weak increase of K+ permeability.
-
•
LDSWAS, LDEWAS and LDDWAS. The D191 mutants have Eisenman sequences shifted toward favouring K+, and the difference in values leads to weak additional permeability of large-sized ions in the LDEWAS and LDDWAS mutants which have larger .
-
•
LDDWAS. This double-ring () mutant exhibits an increased shift, in agreement with the ICB/QD model.
Divalent selectivity sequences of charged mutants
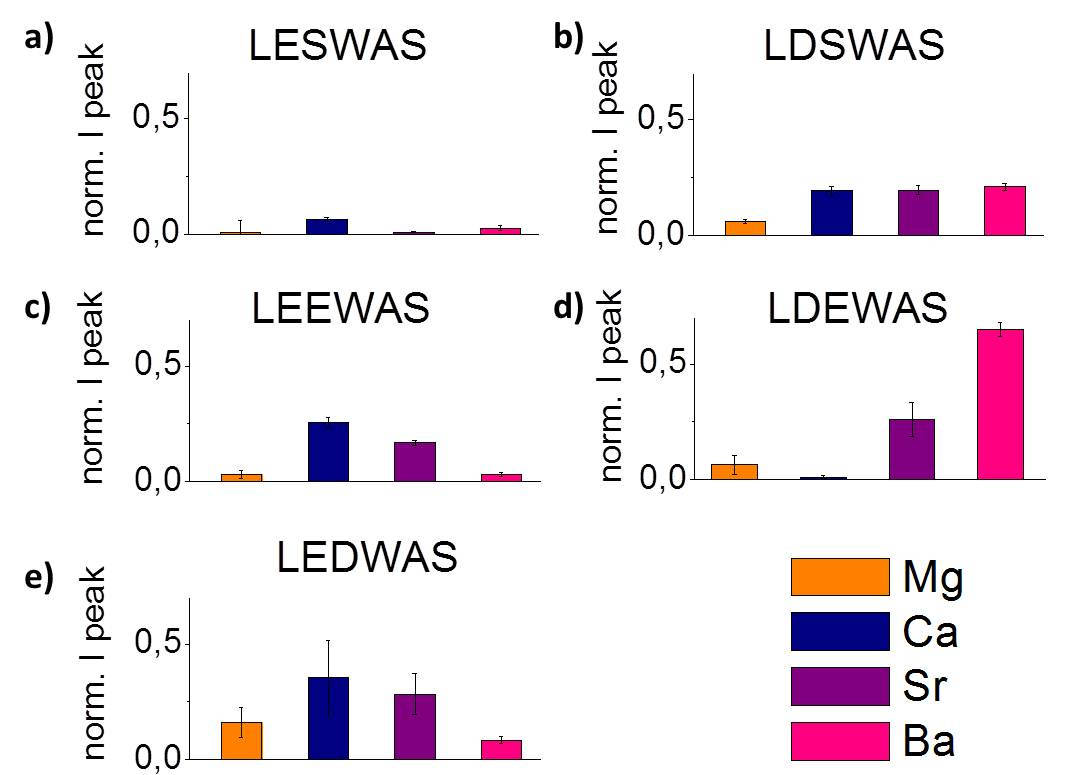
Fig. 4 presents the mutation-induced transformations of divalent cation permeability for the mutants studied. The peak conductivities for (a) wild type NaChBac LESWAS and for four of the mutant channels (b)-(e) are shown for the cations Mg2+, Ca2+, Sr2+ and Ba2+ (as labelled). As in the case of monovalent cations, they were normalised to the peak current recorded in Na+ bath solution. No conduction of any divalent ion could be recorded for LDDWAS (Supplemental Fig. 4). Similarly to the monovalent case, Fig. 4 can be thought as a “mutation matrix” for divalent conduction. Columns represent the residue in position 191 (left for E191, right for D191) whereas rows show variation of the residue in position 192 (S192/E192/D192).
Supplemental Figure 4 shows the original characteristics for divalent conductance. Supplemental Table 3 lists values for the permeability ( calculated from ), and for the conductance ( calculated from the ) ratios.
Whereas the wild-type LESWAS channel exhibits little divalent cation permeability, in accordance with [26] and [34], most of the mutants show divalent conductivity. Generally, the divalent selectivity sequences demonstrate a shift toward larger ions for both the E191D and S192D mutations. Thus LEEWAS and LEDWAS mutants show maximal permeability for Ca2+ ions, whereas the LDEWAS mutant is Ba2+-selective. Note that the E191D LDSWAS mutant conducts divalent ions, similarly to the NsvBa LDSWGS channel [27].
Remarkably, both the wild-type LESWAS channel () and the doubly-charged () LDDWAS mutant show strong blockade of all divalent ions, together with normal conductance for small monovalent ions (Na+). We connect this phenomenon with ICB blockade points of different-order: with smaller for LESWAS and larger - for LDDWAS. The exact values of and will be discussed below.
Divalent blockade in charged mutants
Strong divalent (e.g. Ca2+) blockade of monovalent ( e.g. Na+) currents followed by AMFE has been well-documented in calcium channels [10, 39, 50]. The study of AMFE provides a sensitive method of evaluating the divalent ions’ affinity, which can be used to introduce an effective value of the fixed charge , as we will see below. Without the introduction of the picture revealed by the scan of different cation permeabilities does not seem immediately explicable in terms of the extended ICB model using nominal values of . This study also helps us to understand the nature of the Ca2+ interaction with the fixed charges in the pore and it is highly relevant to the model predictions.
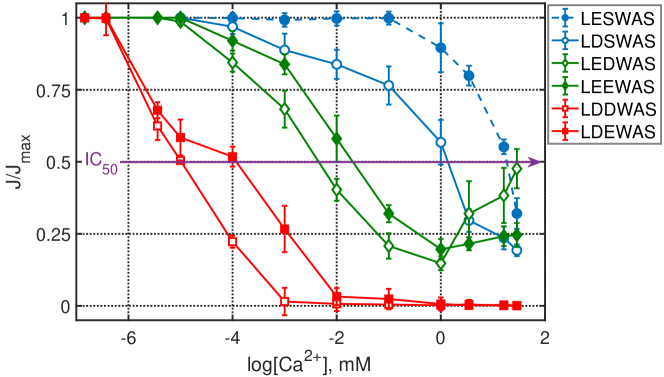
Bath solutions containing mixtures of Na+ and Ca2+ in varying concentrations were used to investigate divalent blockade and the possibility of AMFE on both the whole cell current magnitude and current reversal voltages. The experiments started in a bath solution with 140 mM Na+ and 10 nM of [Ca2+]free, which was sequentially replaced by solutions containing increasing addition of Ca2+ at concentrations up to 1 mM [Ca2+]free, followed by solution in which Na+ was replaced by Ca2+ up to 28.7 mM of [Ca2+]free ([Ca2+]total=100 mM). Fig. 5 shows the results of divalent blockade/AMFE experiments for NaChBac channels with the and mutants:
- •
-
•
LDSWAS shows moderately strong divalent blockade of Na+ current with 1mM.
-
•
Na+ currents through LEDWAS [33] and LEEWAS were similarly sensitive to the presence of Ca2+ and exhibited M, with LEDWAS showing an additional weak shift relative to LEEWAS.
-
•
Ca2+ blockade plots for LDEWAS and LDDWAS, were further shifted toward lower concentrations relatively to the E191 mutants, with LDDWAS exhibiting a greater sensitivity to Ca2+ than that for LDEWAS.
The results show that the influence of the nominally equally-charged residues D and E on the Ca2+ affinity (or on the shift) depends systematically on both the residue type (D or E) and on the residue position (191 or 192). Note that the aspartate residue’s contribution to the affinity is larger than the contribution of glutamate in the same position.
The difference between D and E also depends on position: it is significant for the E191D mutation (LESWAS vs. LDSWAS; LEDWAS vs. LDDWAS; LEEWAS vs. LDEWAS) and it is minor for the E192D mutation (LEEWAS vs. LDEWAS; LDEWAS vs. LDDWAS).
Effective charge and Coulomb blockade oscillations
We propose an effective charge approach to interpret the divalent blockade data in terms of the ICB picture. The ICB model predicts quantitatively the Langmuir isotherm/Fermi-Dirac shape of the Na+ current attenuation curve, and hence a linear dependence of the blockade threshold/affinity on the fixed charge [17, 33]:
| (6) |
where the offset and slope are geometry-dependent coefficients, and is now an effective value of .
Here, we take the inversion of Eq. 6 as being the principal definition of . We also assume linearity: that any charged residue/ring has its own effective charge , depending both on the type X,Y={D, E, S} and position Pos={191, 192} of the residue, so that Eq. 6 is fulfilled for in any Pos. The effective value of fixed charge is an example of a general physical conception of “effective values” (e.g. for diffusion coefficients or dielectric constants [51]) which allows us to use appropriate values outside their areas of formal applicability [52]. Equation 6 defines only the slope of and not its absolute value. To establish the latter we use additional information coming from the Ca2+ zero current positions, which we interpret as representing the points of the stop bands; this interpretation is clearly non-unique and requires care.
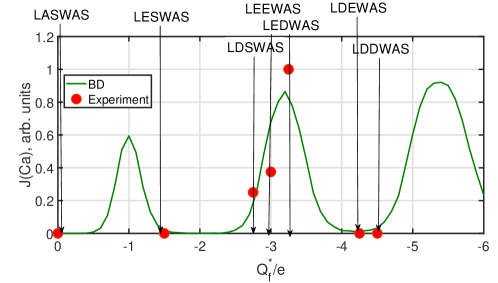
Fig. 6 presents a putative map for site-directed mutants combined with the multi-ion Ca2+ conduction bands, as revealed by Brownian dynamics simulations and with appropriate experimental data superimposed. The vertical arrows indicate site-directed mutants with their respective effective fixed charges deduced by the method described above.
The mutants’ apparent charge mapping deviates significantly from the nominal values, but it allows us to explain the divalent conduction transformations that occur with growth of :
-
•
LASWAS. . Zero conduction is predicted for all ions, due to falling at the zeroth-order Coulomb blockade point , in agreement with the experiments.
-
•
LESWAS. . That is the point for Ca2+. Wild-type NaChBac is a sodium channel that should not conduct divalent ions. We assume that this must be because is at a Coulomb blockade point. We take . The alternative assumption () does not agree with the experimental observation that . The NaChBac sodium channel apparently possesses a significantly lower than was thought previously [26, 28]. Interestingly, the bacterial sodium channel looks much closer to the mammalian Nav with its DEKA locus.
-
•
LDSWAS. . This should be a calcium-conducting non-selective mutant, which is in agreement with experiments. We use this point to fit (D191).
-
•
LEEWAS and LEDWAS, and are calcium-conducting mutants. We infer that their values must lie close to the resonant point for Ca2+. The model used for the BD simulations takes no account of quantized dehydration effects, which is probably why the agreement with experiment is not very good.
-
•
LDEWAS and LDDWAS, and , Ca2+ point. Experimentally, these mutants do not conduct Ca2+ ions (LDDWAS does not conduct divalent ions at all), so we assume them to be close to the nearest Ca2+ Coulomb blockade point, i.e. . This point was then used to scale the map.
Both the BD simulations and experimental Ca2+ conduction points show blockaded zero-current bands separated by conduction bands , in agreement with the basic ICB model [17].
Figure 6 represents the first observation of ICB oscillations of Ca2+ conduction in biological ion channels. The oscillations manifest themselves strongly at the room temperature, unlike their electronic counterpart in quantum dots which become significant only at low temperatures [19]. We comment that constitutes the main determinant of selectivity, in agreement with the ICB/QD model.
Site protonation model of effective charge
We now propose that the difference between the nominal and effective values of is connected to different protonation of the charged residues inside DDDD and EEEE rings [53, 43].
The negative fixed charge of bacterial channels/mutants is provided by the ionised side chains of the aspartate (D) and glutamate (E) residues, which are the only negatively-charged protein side chains. They have the same nominal charges (=-1) and very similar pK4 but different lengths, providing the EEEE-ring with a smaller radius than of the DDDD-ring. This difference may lead to different (and putatively opposite) effects: arising from the difference in local binding, and from a difference in protonation.
We point out that there is also a possible alternative explanation to protonation. Recent MD studies [54] suggest that, when aspartate is in position 191, its charged side chains point away from the centre of the channel. Consequently, an incoming Ca2+ ion might “feel” an effective charge that is lower than the nominal one.
We hypothesize, however, that protonation is the dominant effect and that the increase of affinity related to E191D mutation is connected to significant protonation of the relatively small-radius EEEE charged ring due to overlapping of the electron and proton clouds between neighbouring residues in the ring: such effects have been studied by Furini et al. [53]. Similar effects due to space restrictions on the pKa and protonation state of glutamate were also calculated for the narrower KcsA channel, where pKa was shifted to pKa=9.2 [55].
Otherwise, the larger DDDD ring could be more ionized at physiological pH, closer to the full ionization of free residues. The protonation-related interpretation implies that the effective value is not averaged ”conceptual value” but it reflects the “true” electrostatic value of , differing from the nominal value corresponding to the “ideal” maximum possible value of .
It had been shown previously that the pH in the external solution can alter dramatically the Na+ conductance for NaChBac [27] and Na+/K+ selectivity [28]; there are, however, no data about the dependence of the Ca2+ selectivity on pH.
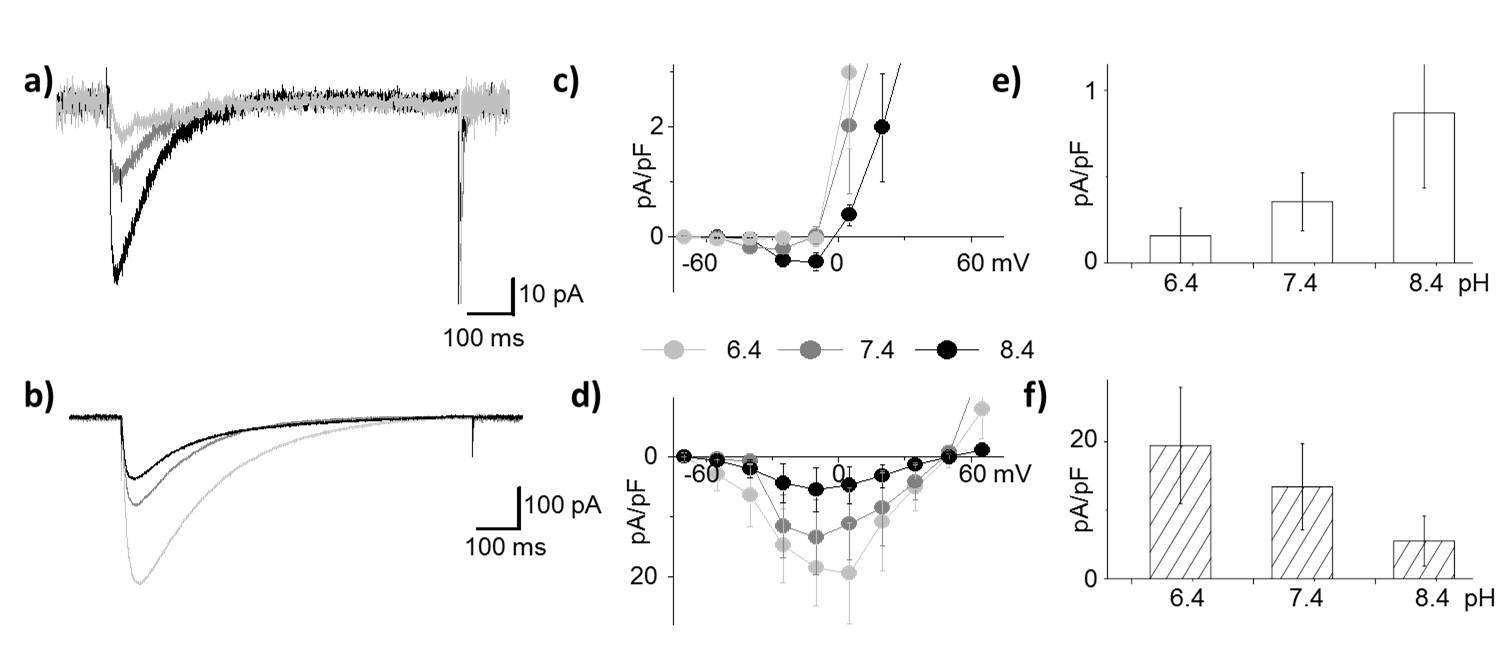
Fig. 7 presents the results of our preliminary study of the effect of variations in extracellular pH on Ca2+ conductance in the LESWAS and LDSWAS NaChBac channels. These effects clearly depend on residue type at position 191. Panel (e) shows that the wild type LESWAS-mediated inward Ca2+ current was small and relatively insensitive to pH changes. Such behaviour corresponds to the position of LESWAS on the ICB conduction vs. map (Fig. 6), i.e. to the Ca2+ stop band for all pH, thus confirming our interpretation of LESWAS as lying at the Ca2+ blockade point. Panel (f) for the LDSWAS mutant demonstrates a significant calcium current , decreasing with growth of pH (and ) , which corresponds to the decreasing-slope side of the ICB oscillation vs . Such behaviour is inconsistent with our mapping (Fig. 6) in which the LDSWAS “working point” is located on the increasing-slope side. This contradiction requires further investigation.
Conclusions
Our application of site-directed mutagenesis and whole-cell patch-clamp technique to investigate the influence of the fixed charge at the SF of the NaChBac bacterial channel has enabled us to explain several hitherto puzzling features of valence and alike-charge selectivity. It was shown that the experimental results can be accounted for within the framework of the novel ICB/QD model, and that the latter is able to describe alike-charge selectivity as well as valence selectivity.
In particular, by systematically changing residues D and E in the key positions 191, 192, and measuring the conduction and selectivity of the resultant LASWAS, LEKWAS, LESWAS, LDSWAS, LEEWAS, LEDWAS, LDEWAS and LDDWAS mutants:
-
1.
The systematic measurements of the Na+/Ca2+ divalent blockade threshold, and hence of Ca2+ affinity, necessitated the introduction of an effective value of the fixed charge in order to be able describe the results. It was found to be significantly smaller than the nominal fixed charge . It enables all of the experimental results to be understood and it can be considered as the main determinant of selectivity for bacterial channels.
-
2.
Our new ICB/QD model, applied to the results of mutation studies on the NaChBac channel, predicts that increase of should lead to a shift in the Eisenman selectivity sequences toward ions with larger radii, for both monovalent and divalent cations. The experiments revealed that such shifts occur in reality.
-
3.
The charge-varied mutants exhibit divalent blockade and anomalous mole fraction effect in solutions containing mixtures of Na+ and Ca2+. However, mutants with the same nominal (-4 or -8), generated with different combinations of glutamate and aspartate at the SF, exhibit markedly different cation permeation profiles.
-
4.
The zero-current Ca2+ Coulomb-blockaded point was observed directly for the LDEWAS mutant., together with point for LESWAS and resonant conduction point for LEDWAS. This result amounts to the first experimental observation of ICB oscillations in biological ion channels, cf. the recent report of its observation in artificial sub-nm nanopores [22].
-
5.
The values for aspartate and glutamate rings are found to be different, and they also differ according to the ring’s position along the SF. We putatively connect this difference with difference ionisation/protonation between the EEEE and DDDD charged rings, which should also depend on their radii. Another possibility [54] is that the EEEE and DDDD rings are in different conformational states.
-
6.
Our preliminary study of the effects of extracellular pH in the 6.4-8.4 range on Ca2+ conductance confirms our attribution of the Ca2+ ICB blockade point for LESWAS, whereas the LDWAS behavior does not fit the scheme and clearly requires farther investigation.
The overall conclusion is that the ICB/QD model, allowing for possible protonation, provides a good description of most features of the conduction and selectivity of the NaChBac channel and its mutants. It is reasonable to suppose that the model will be equally applicable to the many other ion channels that are governed by the same general physical principles.
Acknowledgements
The research was supported by the Engineering and Physical Sciences Research Council UK ( grant No. EP/M015831/1 ) and by a Leverhulme Trust Research Project Grant RPG-2017-134. We are grateful to M. L. Barabash, R. S. Eisenberg, C. Guardiani, A. Stefanovska, and M. Di Ventra, for comments and useful discussions. We thank Huaping Sun, for her much appreciated help with the generation of mutant channels.
References
- Hille [2001] Hille, B., 2001. Ion Channels Of Excitable Membranes. Sinauer Associates, Sunderland, MA, 3rd edition.
- Eisenman and Horn [1983] Eisenman, G., and R. Horn, 1983. Ionic selectivity revisited: the role of kinetic and equilibrium processes in ion permeation through channels. J. Membr. Biol. 76:197–225.
- Laio and Torre [1999] Laio, A., and V. Torre, 1999. Physical origin of selectivity in ionic channels of biological membranes. Biophys. J. 76:129–148.
- Bernèche and Roux [2001] Bernèche, S., and B. Roux, 2001. Energetics of ion conduction through the K+ channel. Nature 414:73–77.
- Nadler et al. [2003] Nadler, B., U. Hollerbach, and R. S. Eisenberg, 2003. Dielectric boundary force and its crucial role in gramicidin. Phys. Rev. E 68:021905.
- Allen et al. [2004] Allen, T. W., O. S. Andersen, and B. Roux, 2004. Energetics of ion conduction through the gramicidin channel. Proc. Nat. Acad. Sci. (USA) 101:117–122.
- Yesylevskyy and Kharkyanen [2005] Yesylevskyy, S. O., and V. N. Kharkyanen, 2005. Barrier-less knock-on conduction in ion channels: peculiarity or general mechanism? Chem. Phys. 312:127–133.
- Corry [2017] Corry, B., 2017. Mechanisms of selective ion transport and salt rejection in carbon nanostructures. MRS Bull. 42:306–310.
- Woodhull [1973] Woodhull, A. M., 1973. Ionic blockage of sodium channels in nerve. J. Gen. Physiol. 61:687–708.
- Sather and McCleskey [2003] Sather, W. A., and E. W. McCleskey, 2003. Permeation and selectivity in calcium channels. Ann. Rev. Physiol. 65:133–159.
- Gillespie and Boda [2008] Gillespie, D., and D. Boda, 2008. The anomalous mole fraction effect in calcium channels: A measure of preferential selectivity. Biophys. J. 95:2658–2672.
- Kitzing [1992] Kitzing, E., 1992. A novel model for saturation of ion conductivity in transmembrane channels. In A. Pullman, J. Jortner, and B. Pullman, editors, Membrane Proteins: Structures, Interactions and Models: Proceedings of the Twenty-Fifth Jerusalem Symposium on Quantum Chemistry and Biochemistry, Jerusalem, Israel, May 18-21,1992, Springer Netherlands, Dordrecht, 297–314.
- Zwolak et al. [2009] Zwolak, M., J. Lagerqvist, and M. Di Ventra, 2009. Quantized ionic conductance in nanopores. Phys. Rev. Lett. 103:128102.
- Krems and Di Ventra [2013] Krems, M., and M. Di Ventra, 2013. Ionic Coulomb blockade in nanopores. J. Phys. Condens. Matter 25:065101.
- Kaufman et al. [2013a] Kaufman, I. K., D. G. Luchinsky, R. Tindjong, P. V. E. McClintock, and R. S. Eisenberg, 2013. Multi-ion conduction bands in a simple model of calcium ion channels. Phys. Biol. 10:026007.
- Kaufman et al. [2013b] Kaufman, I. K., D. G. Luchinsky, R. Tindjong, P. V. E. McClintock, and R. S. Eisenberg, 2013. Energetics of discrete selectivity bands and mutation-induced transitions in the calcium-sodium ion channels family. Phys. Rev. E 88:052712.
- Kaufman et al. [2015a] Kaufman, I. K., P. V. E. McClintock, and R. S. Eisenberg, 2015. Coulomb blockade model of permeation and selectivity in biological ion channels. New J. Phys. 17:083021.
- Kaufman et al. [2015b] Kaufman, I. K., W. A. T. Gibby, D. G. Luchinsky, P. V. E. McClintock, and R. S. Eisenberg, 2015. Coulomb blockade oscillations in biological ion channels. In Proc. 23rd Intern. Conf. on Noise and Fluctuations (ICNF), Xian. IEEE Conf. Proc., doi: 10.1109/ICNF.2015.7288558.
- Averin and Likharev [1986] Averin, D. V., and K. K. Likharev, 1986. Coulomb blockade of single-electron tunneling, and coherent oscillations in small tunnel junctions. J. Low Temp. Phys. 62:345–373.
- Beenakker [1991] Beenakker, C. W. J., 1991. Theory of Coulomb-blockade oscillations in the conductance of a quantum dot. Phys. Rev. B 44:1646–1656.
- Grabert and Devoret [2013] Grabert, H., and M. H. Devoret, 2013. Single Charge Tunneling: Coulomb Blockade Phenomena in Nanostructures, volume 294. Springer Science & Business Media.
- Feng et al. [2016] Feng, J., K. Liu, M. Graf, D. Dumcenco, A. Kis, M. Di Ventra, and A. Radenovic, 2016. Observation of ionic Coulomb blockade in nanopores. Nature Mater. 15:850 – 855.
- Kaufman et al. [2017a] Kaufman, I. K., W. A. T. Gibby, D. G. Luchinsky, and P. V. E. McClintock, 2017. Effect of local binding on stochastic transport in ion channels. In 2017 Intern. Conf. on Noise and Fluctuations 10.1109/ICNF.2017.7985974.
- Luchinsky et al. [2017] Luchinsky, D. G., W. A. T. Gibby, I. K. Kaufman, P. V. E. McClintock, and D. A. Timucin, 2017. Relation between selectivity and conductivity in narrow ion channels. In 2017 International Conference on Noise and Fluctuations (ICNF). DOI: 10.1109/ICNF.2017.7985973.
- Ren et al. [2001] Ren, D. J., B. Navarro, H. X. Xu, L. X. Yue, Q. Shi, and D. E. Clapham, 2001. A prokaryotic voltage-gated sodium channel. Science 294:2372–2375.
- Yue et al. [2002] Yue, L. X., B. Navarro, D. J. Ren, A. Ramos, and D. E. Clapham, 2002. The cation selectivity filter of the bacterial sodium channel, NaChBac. J. Gen. Physiol. 120:845–853.
- DeCaen et al. [2014] DeCaen, P. G., Y. Takahashi, T. A. Krulwich, M. Ito, and D. E. Clapham, 2014. Ionic selectivity and thermal adaptations within the voltage-gated sodium channel family of alkaliphilic Bacillus. eLife 3:e04387.
- Finol-Urdaneta et al. [2014] Finol-Urdaneta, R. K., Y. Wang, A. Al-Sabi, C. Zhao, S. Y. Noskov, and R. J. French, 2014. Sodium channel selectivity and conduction: prokaryotes have devised their own molecular strategy. J. Gen. Physiol. 143:157–171.
- Naylor et al. [2016] Naylor, C. E., C. Bagnéris, P. G. DeCaen, A. Sula, A. Scaglione, D. E. Clapham, and B. A. Wallace, 2016. Molecular basis of ion permeability in a voltage-gated sodium channel. EMBO J. 35:820–830.
- Guardiani et al. [2017a] Guardiani, C., P. M. Rodger, O. A. Fedorenko, S. K. Roberts, and I. A. Khovanov, 2017. Sodium binding sites and permeation mechanism in the NaChBac channel: A molecular dynamics study. J. Chem. Theor. Comput. 13:1389–1400.
- Catterall et al. [2017] Catterall, W. A., G. Wisedchaisri, and N. Zheng, 2017. The chemical basis for electrical signaling. Nature Chem. Biol. 13:455–463.
- Payandeh and Minor [2015] Payandeh, J., and D. L. Minor, 2015. Bacterial voltage-gated sodium channels (BacNaVs) from the soil, sea, and salt lakes enlighten molecular mechanisms of electrical signaling and pharmacology in the brain and heart. J. Mol. Biol. 427:3–30.
- Kaufman et al. [2017b] Kaufman, I. K., O. A. Fedorenkon, D. G. Luchinsky, W. A. Gibby, S. K. Roberts, P. V. E. McClintock, and R. S. Eisenberg, 2017. Ionic Coulomb blockade and anomalous mole fraction effect in the NaChBac bacterial ion channel and its charge-varied mutants. EPJ Nonlinear Biomed. Phys. 5:4.
- Guardiani et al. [2017b] Guardiani, C., O. A. Fedorenko, S. K. Roberts, and I. A. Khovanov, 2017. On the selectivity of the NaChBac channel: an integrated computational and experimental analysis of sodium and calcium permeation. Phys. Chem. Chem. Phys. 29840–29854. http://dx.doi.org/10.1039/C7CP05928K.
- Roux et al. [2004] Roux, B., T. Allen, S. Berneche, and W. Im, 2004. Theoretical and computational models of biological ion channels. Quart. Rev. Biophys. 37:15–103.
- Krauss et al. [2011] Krauss, D., B. Eisenberg, and D. Gillespie, 2011. Selectivity sequences in a model calcium channel: role of electrostatic field strength. Eur. Biophys. J. 40:775–782.
- Boda et al. [2013] Boda, D., D. Henderson, and D. Gillespie, 2013. The role of solvation in the binding selectivity of the L-type calcium channel. J. Chem. Phys. 139:055103.
- Luchinsky et al. [2016] Luchinsky, D. G., W. A. T. Gibby, I. Kaufman, D. A. Timucin, and P. V. E. McClintock, 2016. Statistical theory of selectivity and conductivity in biological channels. arXiv preprint arXiv:1604.05758 .
- Nonner and Eisenberg [1998] Nonner, W., and B. Eisenberg, 1998. Ion permeation and glutamate residues linked by Poisson-Nernst-Planck Theory in L-type calcium channels. Biophys. J. 75:1287–1305.
- Sahu et al. [2017] Sahu, S., M. Di Ventra, and M. Zwolak, 2017. Dehydration as a universal mechanism for ion selectivity in graphene and other atomically thin pores. Nano Lett. 17:4719–4724.
- Li et al. [2017] Li, K., Y. Tao, Z. Li, J. Sha, and Y. Chen, 2017. Selective ion-permeation through strained and charged graphene membranes. Nanotech. 29:035402.
- Zhang et al. [2005] Zhang, J., A. Kamenev, and B. I. Shklovskii, 2005. Conductance of ion channels and nanopores with charged walls: A toy model. Phys. Rev. Lett. 95:148101.
- Corry and Thomas [2012] Corry, B., and M. Thomas, 2012. Mechanism of ion permeation and selectivity in a voltage gated sodium channel. J. Amer. Chem. Soc. 134:1840–1846.
- Dudev and Lim [2014] Dudev, T., and C. Lim, 2014. Evolution of eukaryotic ion channels: Principles underlying the conversion of Ca2+-selective to Na+-selective channels. J. Amer. Chem. Soc. 136:3553–3559.
- Hodgkin and Keynes [1955] Hodgkin, A. L., and R. D. Keynes, 1955. The potassium permeability of a giant nerve fibre. J. Physiol. 128:61–88.
- Shao et al. [2009] Shao, Q., J. Zhou, L. Lu, X. Lu, Y. Zhu, and S. Jiang, 2009. Anomalous hydration shell order of Na+ and K+ inside carbon nanotubes. Nano Lett. 9:989–994.
- Shannon [1976] Shannon, R. D., 1976. Revised effective ionic radii and systematic studies of interatomic distances in halides and chalcogenides. Acta Cryst. A 32:751–767.
- Kirk [1982] Kirk, R. E., 1982. Experimental Design. Wiley Online Library.
- Vora et al. [2008] Vora, T., B. Corry, and S. Chung, 2008. Brownian dynamics study of flux ratios in sodium channels. Eur. Biophys. J. 38:45–52.
- Gillespie [2008] Gillespie, D., 2008. Energetics of divalent selectivity in a calcium channel: The ryanodine receptor case study. Biophys. J. 94:1169–1184.
- Kaufman et al. [2013c] Kaufman, I. K., R. Tindjong, D. G. Luchinsky, P. V. E. McClintock, and R. S. Eisenberg, 2013. Resonant multi-ion conduction in a simple model of calcium channels. In J. M. Routoure, L. Varani, and F. Pascal, editors, 22nd Intern. Conf. on Noise and Fluctuations (ICNF), Montpellier, 24–28 June 2013. IEEE Conf. Proc., doi: 10.1109/ICNF.2013.6578926.
- Van Vechten [1969] Van Vechten, J. A., 1969. Quantum dielectric theory of electronegativity in covalent systems. I. Electronic dielectric constant. Phys. Rev. 182:891.
- Furini et al. [2014] Furini, S., P. Barbini, and C. Domene, 2014. Effects of the protonation state of the EEEE motif of a bacterial Na+-channel on conduction and pore structure. Biophys. J. 106:2175–2183.
- Fedorenko et al. [2018] Fedorenko, O. A., C. Guardiani, I. A. Khovanov, and S. K. Roberts, 2018. Role of aspartates and glutamates in Na+ and Ca2+ selectivity. arXiv preprint… .
- Bernèche and Roux [2002] Bernèche, S., and B. Roux, 2002. The ionization state and the conformation of Glu-71 in the KcsA channel. Biophys. J. 82:772–780.
See pages - of supp.pdf