Distinct pressure evolution of coupled nematic and magnetic order in FeSe
Abstract
FeSe, despite being the structurally simplest compound in the family of iron-based superconductors, shows an astoundingly rich interplay of physical phenomena including nematicity and pressure-induced magnetism. Here, we present a microscopic study of these two phenomena by high-energy x-ray diffraction and time-domain Mössbauer spectroscopy on FeSe single crystals over a wide temperature and pressure range. The topology of the pressure-temperature phase diagram is a surprisingly close parallel to the well-known doping-temperature phase diagram of BaFe2As2 generated through partial Fe/Co and Ba/Na substitution. In FeSe with pressure as a control parameter, the magneto-structural ground state can be tuned from ”pure” nematic — paramagnetic with an orthorhombic lattice distortion — through a strongly coupled magnetically ordered and orthorhombic state to a magnetically ordered state without an orthorhombic lattice distortion. The magnetic hyperfine field increases monotonically over a wide pressure range. However, the orthorhombic distortion initially decreases under increasing pressure, but is stabilized by cooperative coupling to the pressure-induced magnetic order. Close to the reported maximum of the superconducting critical temperature (occuring at GPa), the orthorhombic distortion suddenly disappears and FeSe remains tetragonal down to the lowest temperature measured. Analysis of the structural and magnetic order parameters suggests an independent origin of the structural and magnetic ordering phenomena, and their cooperative coupling leads to the similarity with the canonical phase diagram of iron pnictides.
I Introduction
A fascinating characteristic of iron-based superconductors is their complex phase diagrams, and a decade of research has revealed intricate relationships between their magnetism, structure and superconductivity. Most parent compounds of the iron-based superconductors support an antiferromagnetic ground state, and, similar to many other unconventional superconductors, the antiferromagnetic order needs to be sufficiently suppressed for superconductivity to occur. The antiferromagnetic order in the iron-based compounds is typically stripe-type, characterized by a wavevector that breaks the tetragonal lattice symmetryDai (2015). Hence, when stripe-type magnetic order forms, the lattice necessarily distorts from its high-temperature tetragonal structure and becomes orthorhombicCano et al. (2010). A dome of superconductivity arises around the point at which the magnetic order and lattice distortion are suppressed by a tuning parameter like doping or pressure, and the fluctuations related to the suppressed magnetic order and lattice distortion are a promising candidate for the superconducting pairing glue. Even seemingly special cases like the 10-3-8 material Ca10(Pt3As8)(Fe2As2)5 with a more complex chemical structure and disorder essentially fit into this pictureSapkota et al. (2014).
There are two intriguing exceptions to the intimate relationship between the orthorhombic distortion and stripe-type magnetism, both of which have separately generated enormous interest. First, it was observed soon after the discovery of superconductivity in Fe-based materials that the orthorhombic lattice distortion may decouple from the stripe-type magnetic order and occur at a higher temperature ()de la Cruz et al. (2008); Ni et al. (2008); Chu et al. (2009). This has sparked the idea that the structural distortion is related to an independent ”nematic” degree of freedomFernandes et al. (2014) that could, in principle, exist without the magnetic order. Nevertheless, the orthorhombic distortion has theoretically been shown to be a likely consequence of stripe-type magnetic fluctuationsFernandes et al. (2010); Nandi et al. (2010); Fernandes et al. (2014). Such split transitions are indeed very common and observed in pure and underdoped 1111-type materialsde la Cruz et al. (2008), in transition-metal substituted BaFe2As2Ni et al. (2010) and SrFe2As2, and in Co-substituted NaFeAsParker et al. (2010).
A few years later, it was discovered that magnetic order in certain iron-based systems can, in fact, also occur without an orthorhombic lattice distortion Hassinger et al. (2012); Avci et al. (2014); Böhmer et al. (2015). These intriguing ”C4-type”, tetragonal magnetic phases were shown to arise from a coherent superposition of the two symmetry-equivalent, stripe-type antiferromagnetic wavevectorsAllred et al. (2016). The occurence of magnetic order within a tetragonal structure is almost ubiquitous to hole-doped 122-type systems, occurring in Ba(Fe,Mn)2As2Kreyssig et al. (2010), (Ba,K)Fe2As2Hassinger et al. (2012); Böhmer et al. (2015); Allred et al. (2015); Hassinger et al. (2016), (Ba,Na)Fe2As2Avci et al. (2014); Wang et al. (2017), (Sr,Na)Fe2As2Allred et al. (2016); Taddei et al. (2016) and (Ca,Na)Fe2As2Taddei et al. (2017), and was recently also shown in effectively hole-doped CaK(Fe,Ni)4As4Meier et al. (2018).
FeSe has generated enormous interest over the past few years as an extreme case of nematicityMcQueen et al. (2009); Watson et al. (2015); Wang et al. (2016); Fanfarillo et al. (2016); Yamakawa et al. (2016); Tanatar et al. (2016); Chinotti et al. (2017); Watson et al. (2017); He et al. (2017); Böhmer and Kreisel (2018). At ambient pressure, FeSe exhibits a tetragonal-to-orthorhombic transition close to K and no magnetic order down to sub-Kelvin temperaturesBendele et al. (2010). In this sense, FeSe is the iron-based material with the largest extent of a purely nematic phase. FeSe exhibits a complex magnetic fluctuation spectrum with intensity occurring around both the stripe-type and Néel-type wavevectorsWang et al. (2016), and the spectral weights shift in favor of the stripe-type fluctuations below K Wang et al. (2016a). A second reason why FeSe has generated excitement is the high tunability of its superconducting transition temperature . Whereas ambient-pressure FeSe is superconducting below a modest of KHsu et al. (2008), quadruples to K under hydrostatic pressureMizuguchi et al. (2008); Medvedev et al. (2009); Margadonna et al. (2009); Garbarino et al. (2009). Studies of monolayer films of FeSe grown on SrTiO3 have even shown evidence for K (Ref. Ge et al., 2015).

The temperature-pressure phase diagram of FeSe has been uncovered only incrementally. The structural transition is suppressed under pressureMiyoshi et al. (2014); Terashima et al. (2015); Kothapalli et al. (2016); Wang et al. (2016b), pressure-induced magnetic order was demonstrated for GPa and increases with further increasing pressure Bendele et al. (2010, 2012); Terashima et al. (2015); Sun et al. (2016); Kothapalli et al. (2016). This, at first glance, represents a clear difference between FeSe and ”typical” iron arsenidesBüchner and Hess (2009). Under pressure, the structural and magnetic phase lines for FeSe in fact merge into a concomitant magneto-structural transitionKothapalli et al. (2016), indicating that the magnetic ground state is orthorhombic and presumably the same stripe-type as occurs in other iron-based materials. The occurrence of stripe-type magnetic order is also suggested by NMR and muSR resultsWang et al. (2016b); Khasanov et al. (2017). The magneto-structural transition temperature traces out a dome with increasing pressure, with a maximum of K occurring around 5 GPa Sun et al. (2016).
Here, we present a microscopic study of the magnetism, crystallographic symmetry, and in-plane lattice parameters of FeSe under hydrostatic pressure. The temperature dependence of the ordered magnetic hyperfine field and of the orthorhombic distortion in vapor-grown single crystals have been determined over a pressure range of – GPa using high-energy x-ray diffraction and nuclear forward scattering. Figure 1 summarizes the experimental results. In the temperature-pressure phase diagram of FeSe in Fig. 1(a), the nematic, tetragonal-paramagnetic (T+PM) region on the low-pressure side borders an orthorhombic-magnetically-ordered dome (OR+M). We find that magnetic order persists on the high-pressure side of the magnetic dome in the absence of an orthorhombic distortion (T+M). The whole phase diagram is ”cut-off” by a sharp and first-order structural transition at GPa into an orthorhombic ”OR2” phase Kumar et al. (2010); Svitlyk et al. (2017). The low-temperature values of the magnetic and structural order parameters are shown in Fig. 1(b). The ordered magnetic hyperfine field increases monotonically over the orthorhombic-magnetic dome, whereas the orthorhombic distortion has a complex pressure dependence and mainly decreases on increasing pressure. The temperature-pressure phase diagram of FeSe is a surprisingly close parallel to the temperature-doping phase diagram of the -type systems, if both electron-and hole-doping are considered. On the other hand, an analysis of the pressure dependent orthorhombic distortion and magnetic hyperfine field suggests that these ordering phenomena have distinct origins, although the order parameters couple cooperatively.
II Experimental Methods
Single-crystals of FeSe were prepared by chemical vapor transport as described in Ref. Böhmer et al., 2016. Batch A samples are from several batches using natural-abundance elements, whereas batch B samples are from a batch prepared using enriched 57Fe. As described in Ref. Böhmer et al., 2016, the sample properties can vary even with tiny variations in growth conditions. Batch B was found to have less perfect mosaicity and less sharp phase transitions than samples from batch A, however batch A and B both have very similar transition temperatures and values for the orthorhombic distortion (see Fig. 1).
High-energy ( keV), high-resolution x-ray diffraction experiments were performed at endstation ID-D of the APS Argonne on samples from batches A and B. The samples were pressurized in diamond anvil cells (DACs) using He gas as a highly hydrostatic pressure-transmitting medium. We used diamonds with 600 m culets and stainless-steel and CuBe gaskets preindented to thicknesses of m and with laser-drilled holes of m. The position of a fluorescence line for ruby was used for ambient-temperature pressure calibration. Measurements of the lattice parameter of polycrystalline silver were used for in-situ pressure determination at all temperatures, so that the actual temperature-dependent pressure values are reported. Extended regions of selected reciprocal lattice planes and the powder diffraction pattern of silver were recorded by a MAR image plate system positioned m behind the DAC, as the DAC was rocked by up to about two independent axes perpendicular to the incident x-ray beam. High-resolution diffraction patterns of selected Bragg reflections of samples from batch A were also recorded using a Pixirad- detector positioned m behind the DAC while rocking around one of the two axes perpendicular to the x-ray beam. The in-plane lattice parameters were determined by fitting the Bragg peak positions after integrating the data over the transverse scattering directions. This procedure was used for both the data recorded by the Pixirad- detector and by the MAR image plate system.
Nuclear forward scattering (NFS), i.e. time-domain Mössbauer spectroscopy, was performed on stations ID-B and ID-D at the APS on samples from batch B. Diamond anvil cells with He as a pressure transmitting medium and ruby as an in-situ pressure calibrant were used and the pressure cells were set up in a similar way as for the diffraction experiments. At 3ID-B, miniature panoramic DACs Bi et al. (2015) were used. The incident x-ray beam was monochromated to the 57Fe nuclear resonance energy of keV with a resolution of 2 meV and the intensity of the scattered beam in the forward direction was recorded by an Avalanche Photo Diode detector. The beam size at ID-B and ID-D was m2 and m2, respectively. Spectra for GPa were collected at ID-D using the 24-bunch standard timing mode of the Advanced Photon Source, where an x-ray pulse of 80 ps duration hits the sample with a periodicity of 153 ns. Spectra for GPa were collected at 3ID-B beamline in the so-called “hybrid mode” with a s clear time for measurements after the initial excitation pulse hits the nuclei. This long-pulse mode reduces the counting rate by an order of magnitude. However, it drastically improves the sensitivity and precision of determining the internal magnetic hyperfine field due to the increased observation time of the nuclear decay, which is particularly relevant when hyperfine fields are very small. The program conuss Sturhahn (2000) was used to analyze the spectra and determine the magnetic field hyperfine at the iron sites.
III Results
III.1 Nuclear forward scattering and x-ray diffraction
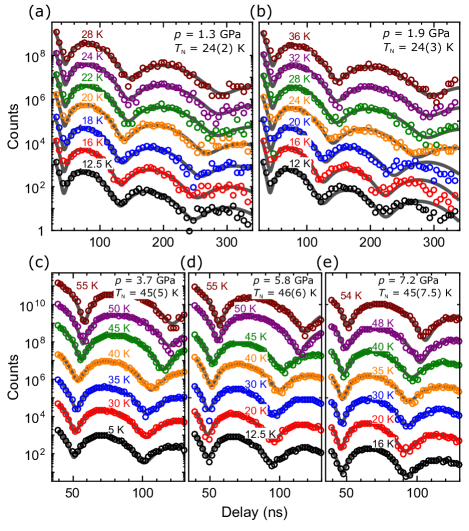
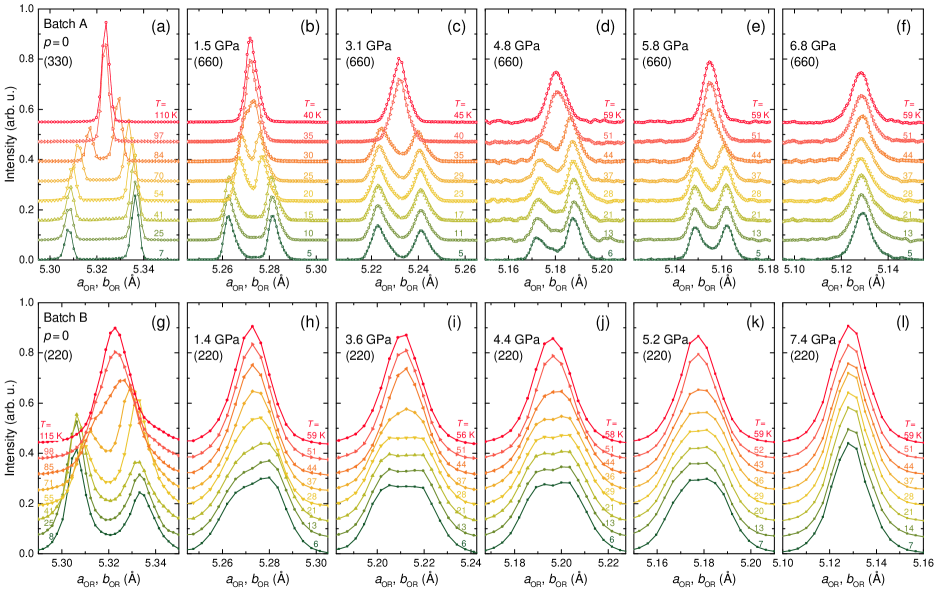
Figure 2 shows the NFS spectra at various pressures up to GPa, from which the information about the magnetic order is obtained. Data for low pressures were obtained to longer delay times on a m thick sample so that small magnetic hyperfine fields could be determined more accurately. Data for pressures above GPa were obtained on an m thick sample. The observed quantum beats originate from a convolution of the hyperfine field, quadrupole splitting and sample thickness. A change in the spectra, most notably the shift of the minima, e.g., between K and K at GPa, indicates that a magnetic phase transition has occurred. Such a transition is observed for pressures up to GPa. At 1.3 GPa a similar, though more continuous shift is discernible and identified as a magnetic phase transition. The corresponding magnetic hyperfine fields are reported in Fig. 5 below.
Figures 3 and 4 show the results of high-energy x-ray diffraction measurements made close to -type Bragg peaks and reveal the temperature and pressure dependence of the orthorhombic distortion. In Fig. 3 data on samples from batches A (obtained with the Pixirad- detector) and B (obtained with the MAR detector) are compared. An obvious difference in peak profiles results from the different orders of the chosen Bragg peaks, the use of different detectors, and the broader mosaicity of samples from batch B. A low-temperature peak-splitting or broadening indicates an orthorhombic ground state. Structural transitions are clearly visible for samples from both batches. At the highest pressures of and GPa, the absence of any peak splitting or broadening and the temperature independent peak profiles up to K indicate a tetragonal ground state.
As already shown in Ref. Kothapalli et al., 2016, the ambient-pressure second-order tetragonal-to-orthorhombic transition at is suppressed under pressure. At GPa, a first-order transition occurs at and the two transitions merge for slightly higher pressures. This first-order transition is observed in the same manner up to GPa. To investigate the pressure-evolution of the orthorhombic distortion of FeSe in more detail, samples from batch A have been studied with additional fine pressure steps between 5.8 and 6.8 GPa (Figure 4).
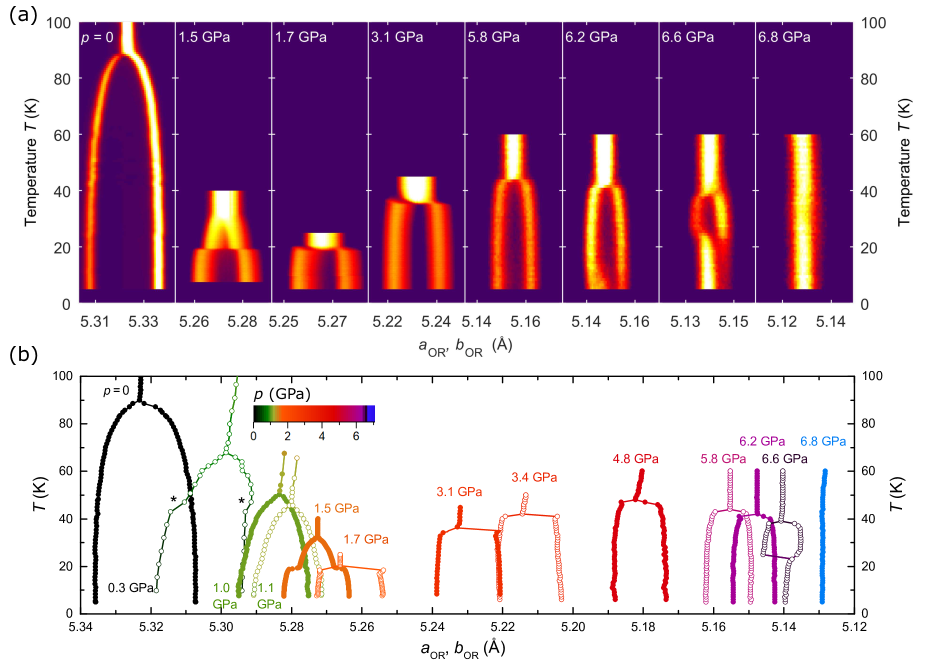
At pressures above 5.8 GPa, a new behavior is observed, which is most pronounced at GPa. On decreasing temperature, the sample first undergoes the first-order tetragonal-to-orthorhombic transition, at K, before it transforms back into a tetragonal structure at K. At the just slightly higher pressure of 6.8 GPa, the sample remains tetragonal at all temperatures. We note that a small phase fraction () appears to become orthorhombic in a limited temperature range even at 6.8 GPa, apparently experiencing a slightly lower effective pressure due to small internal stresses. Similarly, at the lower pressure of 6.2 GPa, a tetragonal fraction of the sample () coexists with the major orthorhombic phase at base temperature. On heating, this phase fraction transforms to orthorhombic at K. This ”structurally reentrant” behavior is reminiscent of the ”structural reentrance” in hole-doped 122-type materials upon transition into the tetragonal magnetic phaseAvci et al. (2014); Böhmer et al. (2015); Allred et al. (2016); Taddei et al. (2017).
Figure 4(b) shows the in-plane lattice parameters of the majority phase of FeSe vs. temperature for all the studied pressures. FeSe has a high compressibility and the tetragonal in-plane lattice parameter is decreased by 3.7% at GPa. In the pressure range 1.7-4.8 GPa, the orthorhombic transition results in an asymmetric change of in-plane lattice parameters so that the average of the and lattice constants decreases at the transition, similar to the Ba(Fe,Co)2As2 systemMeingast et al. (2012). This reverses at higher pressures, so that at GPa, the - average increases on cooling through , similarly to underdoped (Ba,K)Fe2As2Böhmer et al. (2015).

III.2 Structural and magnetic order parameters
The temperature and pressure evolution of the orthorhombic order parameter and the magnetic hyperfine field at the iron site are presented in Fig. 5. Here, we also compare the diffraction results for the two different batches. The transitions are very sharp in samples from batch A, whereas samples from batch B exhibit clear tails to the transitions, which likely arise from inhomogeneities caused by internal stresses. The hyperfine fields deduced from the NFS spectra in Fig. 5(j,k) likely exhibit similar tails of the same origin. Nevertheless, transition temperatures can be well defined as the points of highest rate change of order parameters and the determined values of agree well between the two batches (see Fig. 1).
A second-order structural transition occurs in the absence of magnetic order at the lowest pressures GPa. At the slightly higher pressure of 1.35 GPa, magnetic order emerges in a second-order like transition at . In an intermediate pressure range GPa, magnetic and structural transitions are both first order and are firmly coupled, as discussed in Ref. Kothapalli et al., 2016. The coupling between structural and magnetic order surprisingly breaks down at pressures GPa, when FeSe exhibits a tetragonal ground state even though an ordered magnetic hyperfine field is still observed at a pressure as high as 7.2 GPa. This indicates the presence of a tetragonal magnetic phase.
We note that the tetragonal magnetic state in (Sr,Na)Fe2As2 was shown to be a coherent superposition of two spin-density waves and is characterized by two distinct Fe sites - one with zero and one with double the hyperfine field of the regular stripe-type phaseAllred et al. (2016). Unfortunately, our time-domain Mössbauer spectroscopic experiment is unable to distinguish such a state from a state of the same hyperfine field on all Fe sites. Here, we show the results of fitting with a single hyperfine field, . A model in which zero moment is imposed for half of the Fe sites is able to fit our data at 7.2 GPa equally well, with a fitted value of T for the moment-bearing Fe-sites at base temperature. Nevertheless, it is also possible that FeSe exhibits a completely different type of magnetic order, as might be indicated by the presence of Néel type magnetic fluctuations at ambient pressureWang et al. (2016a).
Figures 5(a)-(b) [see also Fig. 1(b)] summarize the temperature and pressure evolution of the structural and magnetic order parameters over the phase diagram. The low-temperature value of the magnetic hyperfine field of the orthorhombic-magnetic phase increases monotonically under pressure up to GPa, even though the magnetic transition temperature has a dome-like pressure dependence and peaks around 4.8 GPa. The orthorhombic distortion exhibits a complex temperature-pressure dependence. Initially, on increasing pressure, the value of the orthorhombic distortion is suppressed. The low-temperature value of barely changes as a function of pressure between GPa and then gradually decreases under pressure over the range at which has a maximum. The structurally ”reentrant” tetragonal behavior with vanishing lattice distortion at the lowest temperatures is limited over a very small pressure range GPa and the orthorhombic distortion is absent at all temperatures at 6.8 GPa.
IV Comparison of FeSe and BaFe2As2-based superconductors
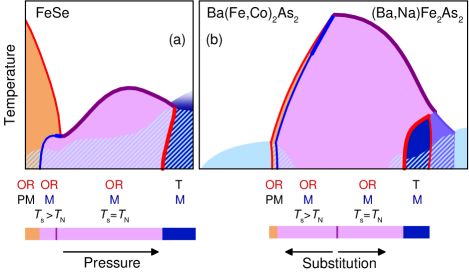
The schematic temperature-pressure phase diagram of FeSe in Fig. 6(a) has remarkable similarities to the temperature-substitution phase diagram of the canonical BaFe2As2 iron-based superconductors [6(a)]. In particular, we consider substitution of Co on the Fe-site (”electron-doping”) and substitution of Na on the Ba site (”hole-doping”) as a way of tuning BaFe2As2 quasi-continuously as shown in Figure 6(b). Then, the sequence of magnetic/structural ground states and the topology of the phase diagrams formed by the corresponding phase lines are similar. FeSe at low pressures and slightly underdoped Ba(Fe,Co)2As2 both have an orthorhombic paramagnetic ground state. On increasing pressure or decreasing Co content the ground state changes to orthorhombic and antiferromagnetic within a region for which until the structural and magnetic phase lines merge. On the high-pressure side of FeSe and in close to optimally doped (Ba,Na)Fe2As2 a tetragonal magnetic ground state emerges.
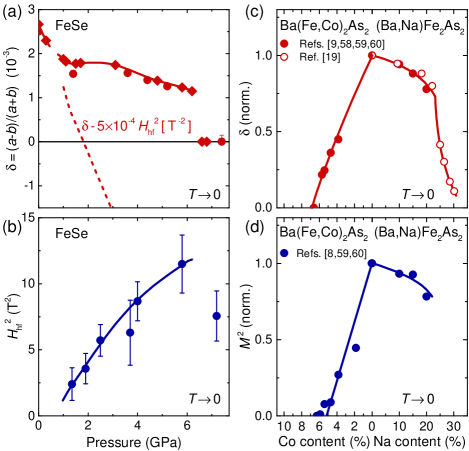
A qualitative difference between FeSe under pressure and substituted BaFe2As2 becomes evident when the value of the orthorhombic and magnetic order parameters are considered. In the 122-type systems, the orthorhombic distortion, , and the ordered magnetic moment, , in the low-temperature limit follow each other closely. Linear-quadratic coupling is theoretically expectedBarzykin and Gor’kov (2009); Qi and Xu (2009); Fernandes et al. (2010); Cano et al. (2010). It has, for example, explicitly been shown experimentally for (Ba,K)Fe2As2 Avci et al. (2012), which features strongly coupled magneto-structural transitions. This proportionality does not hold for FeSe, where increases monotonically up to GPa and has a complex non-monotonic pressure dependence (Figure 7).
One way to rationalize our results on FeSe is to assume that the material’s tendency for an orthorhombic distortion at ambient pressure is independent of the pressure-induced magnetic order. Under increasing pressure, this structural instability is weakened and decreases, whereas the magnetic instability is strengthened. The low cost of orthorhombic distortion at moderate pressures likely favors a stripe-type antiferromagnetic order. By symmetry, an orthorhombic distortion and stripe-type magnetic order couple cooperatively so that the low-temperature value of should increase by an amount , whenever both types of order occur. If such a contribution to the experimental value of is subtracted, the initial trend of indeed continues smoothly [dashed line in Fig. 7(b)]. Symmetry also dictates that structural and magnetic phase lines merge when meets , because the stripe-type AFM state is necessarily orthorhombic. Only above GPa does any orthorhombic distortion become so unfavorable that tetragonal magnetic order is established instead of stripe-type antiferromagnetism. Thus, the origin of the orthorhombic distortion of FeSe at ambient pressure is likely independent from the pressure-induced magnetic order. Theoretically, the nematic order of FeSe at ambient pressure has been found to arise from a Pomeranchuk instability within a renormalization group analysisChubukov et al. (2016), which could explain the observed result. Similarly, the theoretically proposed antiferroquadrupolar orderYu and Si (2015) is a candidate. The effect of pressure as a tuning parameter has been subject to numerous theoretical studies as wellGlasbrenner et al. (2015); Yamakawa et al. (2016); Scherer et al. (2017); Ishizuka et al. (2018). ModelScherer et al. (2017) and ab-initioIshizuka et al. (2018) calculations find a decrease of the tendency to charge order under pressure that could be associated with our results.
The similarity between FeSe under pressure and substituted BaFe2As2 does not hold for the pressure dependence of superconductivity. In Fig. 1 we report as determined from zero resistanceSun et al. (2016) and the onset of diamagnetismMiyoshi et al. (2014). However, it has been questioned whether superconductivity can microscopically coexists with magnetic order in FeSe. The dc magnetization in Ref. Miyoshi et al., 2014 indicates an unchanged amount of diamagnetic shielding up to 7 GPa. Nevertheless, the superconducting transition becomes significantly broader in the pressure range in which orthorhombic magnetism and superconductivity overlapTerashima et al. (2015); Sun et al. (2016) and the spin-lattice relaxation rate in NMR does not change at the putative Wang et al. (2016b), questioning bulk superconductivity. Similarly, such a coexistence has been questioned in Fe(Se,S)Yip et al. (2017). None of our diffraction or NFS results show any anomaly that could be associated with . Since the question of bulk superconductivity in FeSe under pressure is not solved, any conclusion about relation between the tetragonal magnetic phase and superconductivity at high pressures has to be speculative. From the literature, it seems that is maximized in this pressure range. We note that in hole-doped 122’s, tends to be slighlty suppressedBöhmer et al. (2015); Wang et al. (2017) by the presence of the tetragonal magnetic phase.
V Conclusion
In summary, we have studied the structural and magnetic phase diagram and order parameters of FeSe. We have exposed an unexpected variability of the pressure-induced magnetic order. It couples cooperatively with an orthorhombic distortion in the intermediate pressure range. However, at higher pressures, we have discovered the complete suppression of orthorhombic distortion and a tetragonal magnetic phase. This sets the stage for high-temperature superconductivity in FeSe under pressure. The topology of the temperature-pressure phase diagram of FeSe resembles closely the well-known phase diagram of electron/hole-doped BaFe2As2. The origin of the nematic phase in BaFe2As2-based materials is widely accepted to be tied to their stripe-type antiferromagnetism. Here, the pressure evolution of the magnetic and structural order parameters of FeSe leads us to suggest that the origin of the orthorhombic phase in FeSe is distinct from the pressure induced magnetic order. The cooperative coupling between orthorhombicity and magnetic order that is present in both FeSe and BaFe2As2-based systems likely leads to the similarities in the phase diagrams.
VI Acknowledgements
We would like to acknowledge the assistance of D. S. Robinson, C. Benson, S. Tkachev, S. G. Sinogeikin, Ross Hrubiak, Barbara Lavina, R. Somayazulu and M. Baldini, and helpful discussions with R. J. McQueeney. Work at the Ames Laboratory was supported by the Department of Energy, Basic Energy Sciences, Division of Materials Sciences & Engineering, under Contract No. DE-AC02-07CH11358. This research used resources of the Advanced Photon Source, a U.S. Department of Energy (DOE) Office of Science User Facility operated for the DOE Office of Science by Argonne National Laboratory under Contract No. DE-AC02-06CH11357. HPCAT operations are supported by DOE-NNSA under Award No. DE-NA0001974, with partial instrumentation funding by NSF. Use of the COMPRES-GSECARS gas loading system was supported by COMPRES under NSF Cooperative Agreement EAR 11-57758 and by GSECARS through NSF grant EAR-1128799 and DOE grant DE-FG02-94ER14466. Y.X. acknowledges the support of DOE-BES/DMSE under Award DE-FG02-99ER45775. W.B. acknowledges the partial support by COMPRES, the Consortium for Materials Properties Research in Earth Sciences under NSF Cooperative Agreement EAR 1606856.
Appendix A High-pressure phase of FeSe
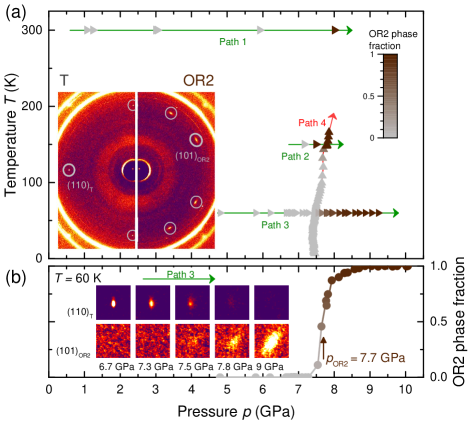
At just slightly higher pressures than those presented in Fig. 5 the samples of both batches undergo a severe structural transition illustrated in Fig. 8. This transition is well-known in literatureMedvedev et al. (2009); Margadonna et al. (2009); Kumar et al. (2010); Svitlyk et al. (2017); Lebert et al. (2017) and the high-pressure orthorhombic ”OR2” phase has been identified as having MnP-type structure with a dramatic volume reduction of with respect to the layered PbO-type FeSe-phase that is stable at lower pressures. The inset in Fig. 8(a) shows sections of the () scattering plane of the two phases at representative pressures. The sharp Bragg peaks of the tetragonal phase completely disappear in the high-pressure OR2 phase. The latter is characterized by 8 much broader type reflections, indicating significant sample degradation which is clearly due to the huge volume reduction and build-up of stress due to domains of the MnP-type structure with different orientations. We have observed this transition in measurements with increasing pressure at constant temperatures 60 K, 150 K and 300 K, in three different samples (from batch A) and also on temperature increase (concomitant with a slight pressure increase, see path 4 in the Fig. 8) in a sample from batch B. The fine pressure steps along path 3 allow to resolve particularly well the rapidly changing OR2 phase fraction between GPa. Together, these four independent measurements define a sharp and nearly temperature-independent phase line at GPa. We found this transition to have a severe hysteresis and to cause irreversible changes to the single-crystalline sample. For example, no return to the tetragonal phase was observed even after decreasing pressure down to 3 GPa and increasing temperature to 300 K following the measurement along path 2.
In previous reports using polycrystalline materialMedvedev et al. (2009); Margadonna et al. (2009); Kumar et al. (2010) and in a single-crystal study with glycerol pressure mediumSun et al. (2016), the structural transition into the OR2 phase has been observed at GPa and often with a significant phase coexistence range. Our lower critical pressure is, however, close to the one reported in Refs. Svitlyk et al., 2017; Lebert et al., 2017, which also used single crystals and He as pressure medium. This transition into a much more closely-packed crystal structure at high pressures marks the end of the stability of the layered structure of FeSe that shares its structural motive with iron-arsenide superconductors.
References
- Dai (2015) P. Dai, Rev. Mod. Phys. 87, 855 (2015).
- Cano et al. (2010) A. Cano, M. Civelli, I. Eremin, and I. Paul, Phys. Rev. B 82, 020408 (2010).
- Sapkota et al. (2014) A. Sapkota, G. S. Tucker, M. Ramazanoglu, W. Tian, N. Ni, R. J. Cava, R. J. McQueeney, A. I. Goldman, and A. Kreyssig, Phys. Rev. B 90, 100504 (2014).
- de la Cruz et al. (2008) C. de la Cruz, Q. Huang, J. W. Lynn, J. Li, W. R. II, J. L. Zarestky, H. A. Mook, G. F. Chen, J. L. Luo, N. L. Wang, and P. Dai, Nature 453, 899 (2008).
- Ni et al. (2008) N. Ni, M. E. Tillman, J.-Q. Yan, A. Kracher, S. T. Hannahs, S. L. Bud’ko, and P. C. Canfield, Phys. Rev. B 78, 214515 (2008).
- Chu et al. (2009) J.-H. Chu, J. G. Analytis, C. Kucharczyk, and I. R. Fisher, Phys. Rev. B 79, 014506 (2009).
- Fernandes et al. (2014) R. M. Fernandes, A. V. Chubukov, and J. Schmalian, Nature Physics 10, 97 (2014).
- Fernandes et al. (2010) R. M. Fernandes, L. H. VanBebber, S. Bhattacharya, P. Chandra, V. Keppens, D. Mandrus, M. A. McGuire, B. C. Sales, A. S. Sefat, and J. Schmalian, Phys. Rev. Lett. 105, 157003 (2010).
- Nandi et al. (2010) S. Nandi, M. G. Kim, A. Kreyssig, R. M. Fernandes, D. K. Pratt, A. Thaler, N. Ni, S. L. Bud’ko, P. C. Canfield, J. Schmalian, R. J. McQueeney, and A. I. Goldman, Phys. Rev. Lett. 104, 057006 (2010).
- Ni et al. (2010) N. Ni, A. Thaler, J. Q. Yan, A. Kracher, E. Colombier, S. L. Bud’ko, P. C. Canfield, and S. T. Hannahs, Phys. Rev. B 82, 024519 (2010).
- Parker et al. (2010) D. R. Parker, M. J. P. Smith, T. Lancaster, A. J. Steele, I. Franke, P. J. Baker, F. L. Pratt, M. J. Pitcher, S. J. Blundell, and S. J. Clarke, Phys. Rev. Lett. 104, 057007 (2010).
- Hassinger et al. (2012) E. Hassinger, G. Gredat, F. Valade, S. R. de Cotret, A. Juneau-Fecteau, J.-P. Reid, H. Kim, M. A. Tanatar, R. Prozorov, B. Shen, H.-H. Wen, N. Doiron-Leyraud, and L. Taillefer, Phys. Rev. B 86, 140502 (2012).
- Avci et al. (2014) S. Avci, O. Chmaissem, J. Allred, S. Rosenkranz, I. Eremin, A. Chubukov, D. Bugaris, D. Chung, M. Kanatzidis, J.-P. Castellan, J. Schlueter, H. Claus, D. Khalyavin, P. Manuel, A. Daoud-Aladine, and R. Osborn, Nature Communications 5, 3845 (2014).
- Böhmer et al. (2015) A. E. Böhmer, F. Hardy, L. Wang, T. Wolf, P. Schweiss, and C. Meingast, Nature Communications 6, 8911 (2015).
- Allred et al. (2016) J. M. Allred, K. M. Taddei, D. E. Bugaris, M. J. Krogstad, S. H. Lapidus, D. Y. Chung, H. Claus, M. Kanatzidis, D. E. Brown, J. Kang, R. M. Fernandes, I. Eremin, S. Rosenkranz, O. Chmaissem, and R. Osborn, Nature Physics 12 (2016).
- Kreyssig et al. (2010) A. Kreyssig, M. G. Kim, S. Nandi, D. K. Pratt, W. Tian, J. L. Zarestky, N. Ni, A. Thaler, S. L. Bud’ko, P. C. Canfield, R. J. McQueeney, and A. I. Goldman, Phys. Rev. B 81, 134512 (2010).
- Allred et al. (2015) J. M. Allred, S. Avci, D. Y. Chung, H. Claus, D. D. Khalyavin, P. Manuel, K. M. Taddei, M. G. Kanatzidis, S. Rosenkranz, R. Osborn, and O. Chmaissem, Phys. Rev. B 92, 094515 (2015).
- Hassinger et al. (2016) E. Hassinger, G. Gredat, F. Valade, S. R. de Cotret, O. Cyr-Choinière, A. Juneau-Fecteau, J.-P. Reid, H. Kim, M. A. Tanatar, R. Prozorov, B. Shen, H.-H. Wen, N. Doiron-Leyraud, and L. Taillefer, Phys. Rev. B 93, 144401 (2016).
- Wang et al. (2017) L. Wang, F. Hardy, T. Wolf, P. Adelmann, R. Fromknecht, P. Schweiss, and C. Meingast, physica status solidi (b) 254, 1600153 (2017).
- Taddei et al. (2016) K. M. Taddei, J. M. Allred, D. E. Bugaris, S. Lapidus, M. J. Krogstad, R. Stadel, H. Claus, D. Y. Chung, M. G. Kanatzidis, S. Rosenkranz, R. Osborn, and O. Chmaissem, Phys. Rev. B 93, 134510 (2016).
- Taddei et al. (2017) K. M. Taddei, J. M. Allred, D. E. Bugaris, S. H. Lapidus, M. J. Krogstad, H. Claus, D. Y. Chung, M. G. Kanatzidis, R. Osborn, S. Rosenkranz, and O. Chmaissem, Phys. Rev. B 95, 064508 (2017).
- Meier et al. (2018) W. R. Meier, Q.-P. Ding, A. Kreyssig, S. L. Bud’ko, A. Sapkota, K. Kothapalli, V. Borisov, R. Valentí, C. D. Batista, P. P. Orth, R. M. Fernandes, A. I. Goldman, Y. Furukawa, A. E. Böhmer, and P. C. Canfield, npj Quantum Materials 3, 5 (2018).
- McQueen et al. (2009) T. M. McQueen, A. J. Williams, P. W. Stephens, J. Tao, Y. Zhu, V. Ksenofontov, F. Casper, C. Felser, and R. J. Cava, Phys. Rev. Lett. 103, 057002 (2009).
- Watson et al. (2015) M. D. Watson, T. K. Kim, A. A. Haghighirad, N. R. Davies, A. McCollam, A. Narayanan, S. F. Blake, Y. L. Chen, S. Ghannadzadeh, A. J. Schofield, M. Hoesch, C. Meingast, T. Wolf, and A. I. Coldea, Phys. Rev. B 91, 155106 (2015).
- Wang et al. (2016) Q. Wang, Y. Shen, B. Pan, Y. Hao, M. Ma, F. Zhou, P. Steffens, K. Schmalzl, T. R. Forrest, M. Abdel-Hafiez, X. Chen, D. A. Chareev, A. N. Vasiliev, P. Bourges, Y. Sidis, H. Cao, and J. Zhao, Nature Materials 15, 159 (2016).
- Fanfarillo et al. (2016) L. Fanfarillo, J. Mansart, P. Toulemonde, H. Cercellier, P. Le Fèvre, F. Bertran, B. Valenzuela, L. Benfatto, and V. Brouet, Phys. Rev. B 94, 155138 (2016).
- Yamakawa et al. (2016) Y. Yamakawa, S. Onari, and H. Kontani, Phys. Rev. X 6, 021032 (2016).
- Tanatar et al. (2016) M. A. Tanatar, A. E. Böhmer, E. I. Timmons, M. Schütt, G. Drachuck, V. Taufour, K. Kothapalli, A. Kreyssig, S. L. Bud’ko, P. C. Canfield, R. M. Fernandes, and R. Prozorov, Phys. Rev. Lett. 117, 127001 (2016).
- Chinotti et al. (2017) M. Chinotti, A. Pal, L. Degiorgi, A. E. Böhmer, and P. C. Canfield, Phys. Rev. B 96, 121112 (2017).
- Watson et al. (2017) M. D. Watson, A. A. Haghighirad, L. C. Rhodes, M. Hoesch, and T. K. Kim, New Journal of Physics 19, 103021 (2017).
- He et al. (2017) M. He, L. Wang, F. Hardy, L. Xu, T. Wolf, P. Adelmann, and C. Meingast, ArXiv e-prints (2017), 1709.03861 .
- Böhmer and Kreisel (2018) A. E. Böhmer and A. Kreisel, Journal of Physics: Condensed Matter 30, 023001 (2018).
- Bendele et al. (2010) M. Bendele, A. Amato, K. Conder, M. Elender, H. Keller, H.-H. Klauss, H. Luetkens, E. Pomjakushina, A. Raselli, and R. Khasanov, Phys. Rev. Lett. 104, 087003 (2010).
- Wang et al. (2016a) Q. Wang, Y. Shen, B. Pan, X. Zhang, K. Ikeuchi, K. Iida, A. D. Christianson, H. C. Walker, D. T. Adroja, M. Abdel-Hafiez, X. Chen, D. A. Chareev, A. N. Vasiliev, and J. Zhao, Nat. Comm. 7, 12182 (2016a).
- Hsu et al. (2008) F.-C. Hsu, J.-Y. Luo, K.-W. Yeh, T.-K. Chen, T.-W. Huang, P. M. Wu, Y.-C. Lee, Y.-L. Huang, Y.-Y. Chu, D.-C. Yan, and M.-K. Wu, Proceedings of the National Academy of Sciences 105, 14262 (2008).
- Mizuguchi et al. (2008) Y. Mizuguchi, F. Tomioka, S. Tsuda, T. Yamaguchi, and Y. Takano, Applied Physics Letters 93, 152505 (2008).
- Medvedev et al. (2009) S. Medvedev, T. M. McQueen, I. A. Troyan, T. Palasyuk, M. I. Eremets, R. J. Cava, S. Naghavi, F. Casper, V. Ksenofontov, G. Wortmann, and C. Felser, Nature Mat. 8, 630 (2009).
- Margadonna et al. (2009) S. Margadonna, Y. Takabayashi, Y. Ohishi, Y. Mizuguchi, Y. Takano, T. Kagayama, T. Nakagawa, M. Takata, and K. Prassides, Phys. Rev. B 80, 064506 (2009).
- Garbarino et al. (2009) G. Garbarino, A. Sow, P. Lejay, A. Sulpice, P. Toulemonde, M. Mezouar, and M. Núñez-Regueiro, EPL (Europhysics Letters) 86, 27001 (2009).
- Ge et al. (2015) J.-F. Ge, Z.-L. Liu, C. Liu, C.-L. Gao, D. Qian, Q.-K. Xue, Y. Liu, and J.-F. Jia, Nature Materials 14, 285 (2015).
- Kaluarachchi et al. (2016) U. S. Kaluarachchi, V. Taufour, A. E. Böhmer, M. A. Tanatar, S. L. Bud’ko, V. G. Kogan, R. Prozorov, and P. C. Canfield, Phys. Rev. B 93, 064503 (2016).
- Sun et al. (2016) J. P. Sun, K. Matsuura, G. Z. Ye, Y. Mizukami, M. Shimozawa, K. Matsubayashi, M. Yamashita, T. Watashige, S. Kasahara, Y. Matsuda, J. Q. Yan, B. C. Sales, Y. Uwatoko, J. G. Cheng, and T. Shibauchi, Nature Communications 7, 12146 (2016).
- Miyoshi et al. (2014) K. Miyoshi, K. Morishita, E. Mutou, M. Kondo, O. Seida, K. Fujiwara, J. Takeuchi, and S. Nishigori, Journal of the Physical Society of Japan 83, 013702 (2014).
- Terashima et al. (2015) T. Terashima, N. Kikugawa, S. Kasahara, T. Watashige, T. Shibauchi, Y. Matsuda, T. Wolf, A. E. Böhmer, F. Hardy, C. Meingast, H. v. Löhneysen, and S. Uji, Journal of the Physical Society of Japan 84, 063701 (2015).
- Kothapalli et al. (2016) K. Kothapalli, A. E. Böhmer, W. T. Jayasekara, B. G. Ueland, P. Das, A. Sapkota, V. Taufour, Y. Xiao, E. E. Alp, S. L. Bud’ko, P. C. Canfield, A. Kreyssig, and A. I. Goldman, Nature Communications 7, 12728 (2016).
- Wang et al. (2016b) P. S. Wang, S. S. Sun, Y. Cui, W. H. Song, T. R. Li, R. Yu, H. Lei, and W. Yu, Phys. Rev. Lett. 117, 237001 (2016b).
- Bendele et al. (2012) M. Bendele, A. Ichsanow, Y. Pashkevich, L. Keller, T. Strässle, A. Gusev, E. Pomjakushina, K. Conder, R. Khasanov, and H. Keller, Phys. Rev. B 85, 064517 (2012).
- Büchner and Hess (2009) B. Büchner and C. Hess, Nature Materials 8, 615 (2009).
- Khasanov et al. (2017) R. Khasanov, Z. Guguchia, A. Amato, E. Morenzoni, X. Dong, F. Zhou, and Z. Zhao, Phys. Rev. B 95, 180504 (2017).
- Kumar et al. (2010) R. S. Kumar, Y. Zhang, S. Sinogeikin, Y. Xiao, S. Kumar, P. Chow, A. L. Cornelius, and C. Chen, The Journal of Physical Chemistry B 114, 12597 (2010).
- Svitlyk et al. (2017) V. Svitlyk, M. Raba, V. Dmitriev, P. Rodière, P. Toulemonde, D. Chernyshov, and M. Mezouar, Phys. Rev. B 96, 014520 (2017).
- Böhmer et al. (2016) A. E. Böhmer, V. Taufour, W. E. Straszheim, T. Wolf, and P. C. Canfield, Phys. Rev. B 94, 024526 (2016).
- Bi et al. (2015) W. Bi, J. Zhao, J. Lin, Q. Jia, M. Y. Hu, C. Jin, R. Ferry, W. Yang, V. Struzhkin, and E. E. Alp, Journal of Synchrotron Radiation 22, 760 (2015).
- Sturhahn (2000) W. Sturhahn, Hyperfine Interact. 125, 149–172 (2000).
- Böhmer et al. (2015) A. E. Böhmer, T. Arai, F. Hardy, T. Hattori, T. Iye, T. Wolf, H. v. Löhneysen, K. Ishida, and C. Meingast, Phys. Rev. Lett. 114, 027001 (2015).
- Meingast et al. (2012) C. Meingast, F. Hardy, R. Heid, P. Adelmann, A. Böhmer, P. Burger, D. Ernst, R. Fromknecht, P. Schweiss, and T. Wolf, Phys. Rev. Lett. 108, 177004 (2012).
- Hardy et al. (2010) F. Hardy, T. Wolf, R. A. Fisher, R. Eder, P. Schweiss, P. Adelmann, H. v. Löhneysen, and C. Meingast, Phys. Rev. B 81, 060501 (2010).
- Prozorov et al. (2009) R. Prozorov, M. A. Tanatar, N. Ni, A. Kreyssig, S. Nandi, S. L. Bud’ko, A. I. Goldman, and P. C. Canfield, Phys. Rev. B 80, 174517 (2009).
- Avci et al. (2012) S. Avci, O. Chmaissem, D. Y. Chung, S. Rosenkranz, E. A. Goremychkin, J. P. Castellan, I. S. Todorov, J. A. Schlueter, H. Claus, A. Daoud-Aladine, D. D. Khalyavin, M. G. Kanatzidis, and R. Osborn, Phys. Rev. B 85, 184507 (2012).
- Avci et al. (2013) S. Avci, J. M. Allred, O. Chmaissem, D. Y. Chung, S. Rosenkranz, J. A. Schlueter, H. Claus, A. Daoud-Aladine, D. D. Khalyavin, P. Manuel, A. Llobet, M. R. Suchomel, M. G. Kanatzidis, and R. Osborn, Phys. Rev. B 88, 094510 (2013).
- Barzykin and Gor’kov (2009) V. Barzykin and L. P. Gor’kov, Phys. Rev. B 79, 134510 (2009).
- Qi and Xu (2009) Y. Qi and C. Xu, Phys. Rev. B 80, 094402 (2009).
- Chubukov et al. (2016) A. V. Chubukov, M. Khodas, and R. M. Fernandes, Phys. Rev. X 6, 041045 (2016).
- Yu and Si (2015) R. Yu and Q. Si, Phys. Rev. Lett. 115, 116401 (2015).
- Glasbrenner et al. (2015) J. K. Glasbrenner, I. I. Mazin, H. O. Jeschke, P. J. Hirschfeld, R. M. Fernandes, and R. Valentí, Nature Physics 11, 953 (2015).
- Scherer et al. (2017) D. D. Scherer, A. C. Jacko, C. Friedrich, E. Şaşıoğlu, S. Blügel, R. Valentí, and B. M. Andersen, Phys. Rev. B 95, 094504 (2017).
- Ishizuka et al. (2018) J. Ishizuka, T. Yamada, Y. Yanagi, and Y. Ōno, Journal of the Physical Society of Japan 87, 014705 (2018).
- Yip et al. (2017) K. Y. Yip, Y. C. Chan, Q. Niu, K. Matsuura, Y. Mizukami, S. Kasahara, Y. Matsuda, T. Shibauchi, and S. K. Goh, Phys. Rev. B 96, 020502 (2017).
- Lebert et al. (2017) B. W. Lebert, V. Balédent, P. Toulemonde, J. M. Ablett, S. Klotz, T. Hansen, P. Rodière, M. Raba, and J.-P. Rueff, ArXiv e-prints , 1708.04805 (2017).