Discovery of a diffuse optical line emitting halo in the core of the Centaurus cluster of galaxies: Line emission outside the protection of the filaments.
Abstract
We present the discovery of diffuse optical line emission in the Centaurus cluster seen with the MUSE IFU. The unparalleled sensitivity of MUSE allows us to detect the faint emission from these structures which extend well beyond the bounds of the previously known filaments. Diffuse structures (emission surrounding the filaments, a northern shell and an extended Halo) are detected in many lines typical of the nebulae in cluster cores ([NII]λ6548&6583 ,[SII]λ6716&6731, [OI]λ6300, [OIII]λ4959&5007 etc.) but are more than an order of magnitude fainter than the filaments, with the faint halo only detected through the brightest line in the spectrum ([NII]λ6583). These structures are shown to be kinematically distinct from the stars in the central galaxy and have different physical and excitation states to the filaments. Possible origins are discussed for each structure in turn and we conclude that shocks and/or pressure imbalances are resulting in gas dispersed throughout the cluster core, formed from either disrupted filaments or direct cooling, which is not confined to the bright filaments.
keywords:
galaxies: clusters: individual: Centaurus - galaxies: clusters: intracluster medium - galaxies: elliptical and cD1 Introduction
X-ray observations of the cores of many massive galaxy clusters show highly peaked surface brightness profiles suggesting that the hot gas they contain is rapidly losing energy and should thus cool quickly to produce cool gas reservoirs (see reviews by Fabian, 2012; McNamara & Nulsen, 2012). At the centre of these cool core clusters resides a massive brightest cluster galaxy (BCG) which is often surrounded by an extended optical line emitting nebula (e.g. Heckman et al., 1989; Conselice et al., 2001; Hamer et al., 2016) in the form of filaments extending out over several kpc (e.g. McDonald et al., 2010, 2011). High resolution X-ray observations of cool core clusters show similar filamentary structures are also present within the hot gas of the intracluster medium (ICM). Comparison of these structures with H filaments show there is typically a strong qualitative consistency, with line emitting structures matched by similar structures in the soft X-ray gas (for example Fabian et al., 2003, 2008). However, the reverse is not always true and ICM structures seen in X-rays do not always show line emitting counter parts.
Substantial work has been conducted studying the optical nebula within the centres of cool core clusters over the last few decades (e.g. Heckman et al., 1989; Crawford et al., 1999; Crawford et al., 2005; Conselice et al., 2001; O’Dea et al., 2004, 2010; Jaffe et al., 2005; Oonk et al., 2010; McDonald et al., 2011, etc.) revealing a wide range of extents and surface brightnesses between the different nebulae, though in most cases high surface filling factors are found within the central regions (4 kpc from the BCG nucleus) of the nebulae. NGC 4696, the BCG at the centre of a local (DL =49.3 Mpc) cool core galaxy cluster (the Centaurus cluster), is surrounded by a bright (LHα=1.61040 erg s-1) and well studied optical line emitting nebula (e.g. Fabian et al., 1982; Fabian et al., 2016; Canning et al., 2011) making it an ideal target for deep studies of these objects. The nebula is seen to take the form of a network of optical line emitting filaments extended over 14 kpc within the cluster core to the south, west and east of the BCG (Canning et al., 2011; Fabian et al., 2016). However, emission has not been detected to the north of the BCG beyond 2 kpc making this an unusual case.
The optical filaments surrounding NGC 4696 correlate with similar structures seen in the soft X-ray emission (Crawford et al., 2005). These filamentary structures occupy a region of the ICM with low temperatures and relatively low pressures as seen in Sanders et al. (2016). Cavities are also seen in the X-ray image which are inflated by radio jets from the AGN at the centre of the BCG (Fabian et al., 2005). The energy injected into the ICM through this process is believed to be responsible for replacing much of the energy lost through X-ray emission (see Fabian, 2012; McNamara & Nulsen, 2012, for reviews). This suggests the filaments may have formed as gas was dragged out of the BCG by the expanding radio jets. However, Sanders et al. (2016) detect cavities to the north of the BCG in a region of high temperature and pressure where no filaments are seen. This wide array of features in such a local southern hemisphere cluster make Centaurus an ideal system in which to study the cores of galaxy clusters.
One striking feature of the core of the Centaurus cluster when observed in soft X-ray and optical bands is its distorted morphology. The H filaments appear to extend only from the southern edge of the BCG (see HST narrowband image in Fabian et al., 2016, for example) and spiral outwards in a clockwise direction. The X-ray morphology is similar extending the spiral structure further to the north east. There is an offset between the nucleus of the BCG and the X-ray centroid of the ICM seen in only a small fraction of clusters with optical nebulae (Sanderson et al., 2009; Hamer et al., 2012) which suggests the BCG may not be at rest with respect to the cluster core. The ICM also shows evidence of cold fronts seen as an an anticorrelation between X-ray surface brightness and temperature (Sanders et al., 2016). All of this suggests that the cluster core is sloshing which may be responsible for producing the spiral like structure seen in the filaments.
In this paper we present observations of the core of the Centaurus cluster with the Multi Unit Spectroscopic Explorer (MUSE) instrument on the VLT which provides excellent sensitivity over the entire nebula. In 2 the observations and data analysis are described. The detection of previously unknown diffuse components to the nebula is presented in 3. Potential origins for these structures are discussed in 4 and conclusions are presented in 5. We assume a standard cosmology throughout with H0=70 km s-1 Mpc-1 and =0.3, as such at the redshift of the Centaurus cluster (z=0.0114) 1" = 233 pc.
2 Observations and Data Reduction
Observations of the Centaurus cluster were obtained using the Multi Unit Spectroscopic Explorer (MUSE, Bacon et al., 2010) integral field unit (IFU) on board ESOs VLT during period 94 (Program 094.A-0859, PI: S. Hamer) on 8 December 2014 and 7 January 2015. The observations consisted of four pointings of 820s each, three were targeted at the Brightest Cluster Galaxy with a 5" dither and 90∘ rotation between each resulting in a total field of view of 7070 arcsec. The fourth was targeted at an empty region 2’ to the north west to provide an accurate measure of the sky spectrum which is uncontaminated by emission lines from the cluster. The mean DIMM seeing during the observations was 1.2 arcsec.
The data were reduced using version 1.0.4 of the MUSE data reduction pipeline with the individual recipes being executed from the European Southern Observatory Recipe Execution Tool (ESOREX v. 3.12) command-line interface. Sky subtraction of the final datacube was done using version 2.1 of the Zurich Atmosphere Purge (ZAP, Soto et al., 2016) measuring the sky from the offset region before subtracting it from the datacube. The data are corrected for galactic extinction using an O’Donnell extinction curve (O’Donnell, 1994) and the dust maps of Schlegel et al. (1998) (which were recalibrated in Schlafly & Finkbeiner, 2011). Spectra were fitted using the latest version of ppxf (Cappellari, 2017), taking stellar templates from the Indo-US spectral library (with T 3000 – 30000 K and [Fe/H] -3 – 1, Valdes et al., 2004) and fitting continuum and nebular emission simultaneously. Local extinction was accounted for using ppxfs built in function to include a reddening component to the spectral fit.
In regions of weak line emission but strong continuum the Balmer absorption features from stars completely dominate over the gas emission lines making it extremely difficult to accurately fit the Balmer features. It should be noted that while there is no reason to expect a bright stellar component to be spatially and kinematically correlated with the gas emission the full region covered by the observation falls within the BCGs extended stellar envelope. This results in the Balmer emission lines falling close to the bottom of the intrinsically broad Balmer absorption features in the stellar spectrum except in cases where line emission has a significant velocity offset from the BCG. At times this resulted in a degeneracy between the absorption and emission, in which overly deep absorption features were fit, balanced by extremely broad emission features at the same velocity.
In order to eliminate this problem the fitting was performed in a three step process. First the wavelengths within 300 km s-1 of the expected position of each bright emission line were masked and a continuum only fit performed to the remaining parts of the spectra. After this the resulting continuum models were subtracted from the full spectra and a fit to the residual emission line features was performed. Finally a combined fit (continuum and emission lines) to the full spectrum was performed fixing the kinematics of the emission lines to those found from the emission line only fit. This process produced excellent fits to the spectrum, while maintaining the simultaneous fitting of continuum and emission features and minimising the degeneracy between absorption and broad emission lines.
3 Results
Continuum subtracted narrow band images produced from the datacube detect the previously known filamentary H emitting nebula (Figure 1 Right). This filamentary nebular has been extensively studied over the last three decades using both narrow band imaging (e.g. Sparks et al., 1989; Crawford et al., 2005; Fabian et al., 2016) and IFU observations (e.g. the long VIMOS observation of Canning et al., 2011). However, while the majority of the [NII]λ6583 emission also traces this filamentary structure, we note that it appears more diffuse, with [NII]λ6583 emission extending between and beyond the filaments (Figure 1 Left). As both of these lines typically fall within the bands used by imaging studies this contrast is not apparent in previous observations of this cluster.
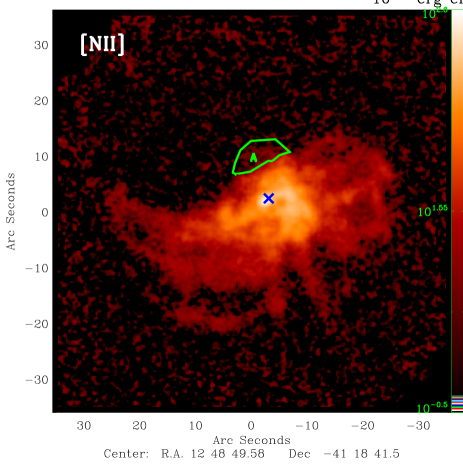
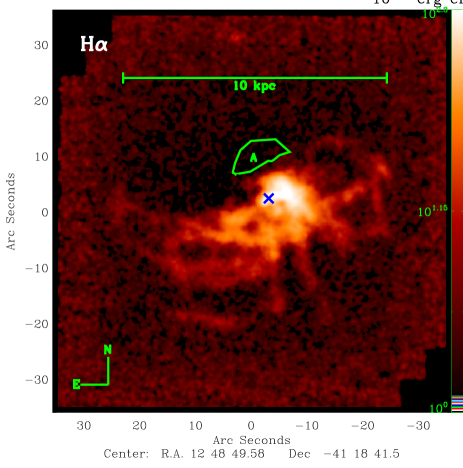
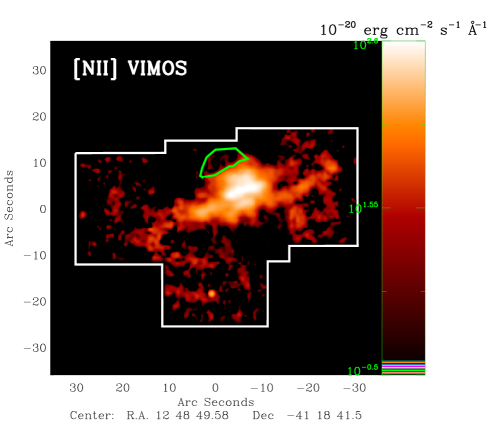
Figure 2 (Left) shows a narrowband image produced from the VIMOS (VIsible Multi-Object Spectrograph, Le Fèvre et al., 2003) data of Canning et al. (2011) using the same wavelength limits as the MUSE [NII] narrow band image seen in figure 1. The improvement in sensitivity from the MUSE data is immediately apparent when comparing these two images. Not only is the diffuse component from the nebula not apparent in the VIMOS data, but some of the filaments are not visible in this narrowband image either (e.g. the centre filament extending to the south-west of the centre). What is also apparent from comparing these two images is the diffuse structure to the north of the BCG (region A) seen in the MUSE [NII] narrow band image is not clearly detected in the VIMOS narrow band image. In the MUSE [NII] narrow band image region A has an average surface brightness of 51.910-20 erg cm-2 s-1 Å-1 arcsec-2 far in excess of the background level of 0.1710-20 erg cm-2 s-1 Å-1 arcsec-2, however in the VIMOS narrow band image the surface brightness of region A (64.710-20 erg cm-2 s-1 Å-1 arcsec-2) is less than twice that of the background (36.910-20 erg cm-2 s-1 Å-1 arcsec-2) indicating it is not sufficiently bright to stand out above the noise.
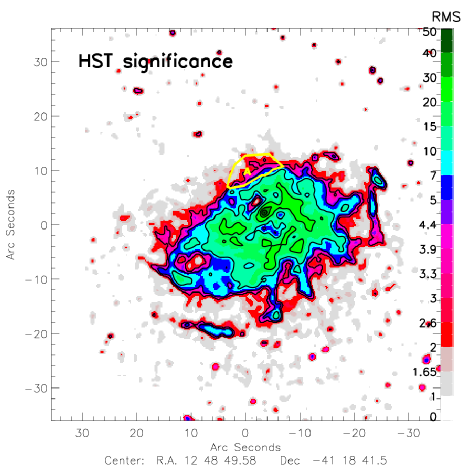
The narrow band image of Fabian et al. (2016) is one of the deepest to be taken on this object. It shows some tentative evidence of the line emission seen in region A however, a direct comparison of this region to a significance map of the image (Figure 2, Left) suggests that much of this does not exceed a 3 significance. Comparing the [NII] and H narrow band images from MUSE it is apparent that while region A shows the presence of [NII] emission no evidence of H emission is seen (the H surface brightness is 0.2510-20 erg cm-2 s-1 Å-1 arcsec-2 barely exceeding the background level of 0.2410-20 erg cm-2 s-1 Å-1 arcsec-2). While it is possible that this region is really lacking in H emission this would suggest a different excitation mechanism or significantly different metallicity than the rest of the nebula. The more plausible explanation is that H emission is present in this region but is lost to the Balmer absorption feature of the BCGs stellar continuum. This structure is not discussed in previous studies of this cluster and most suggest that the nebular extends exclusively on the southern side of the BCG.
This faint diffuse emission is detected thanks to the combination of the unprecedented sensitivity of MUSE and its ability to isolate individual emission lines (e.g. Hamer et al., 2015). This is particularly important in this case where the underlying continuum spectrum has significant structure in the form of the stellar H absorption feature. By isolating a single line when producing the narrow band image the continuum variations within the band are minimised and the contribution of the continuum emission is significantly reduced. This reduces the errors associated with the continuum subtraction which allows for the faint structures to be seen at much higher contrast than is possible with available narrowband images (e.g. Fabian et al., 2016).
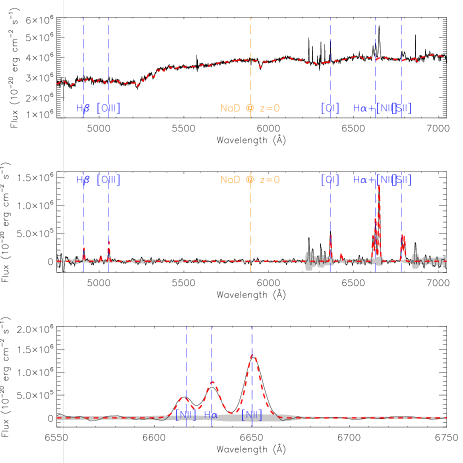
The top panel of figure 3 shows the total integrated spectrum produced from the datacube along with the fit to the stellar continuum. Most strong optical emission lines within the covered wavelength are already visible without continuum subtraction. The middle and bottom panels of figure 3 show the continuum subtracted spectra (full and zoomed in around the H-[NII] complex) along with the fits to the strong emission lines present. [NII]λ6583 is by far the strongest line in the spectrum with a total detected flux of 27.20.5710-14 erg cm-2 s-1. This is a factor of 2.330.06 brighter than the H flux of 11.70.1710-14 erg cm-2 s-1, which is also more greatly affected by stellar absorption. These two factors make the H narrow band image in figure 1 less reliable than the [NII]λ6583 narrow band image for determining the overall structure of the nebula.
As such the morphology seen in the [NII]λ6583 emission, with the additional more extended and seemingly diffuse structures (see Figure 1), likely represents the true extent and structure of the nebula. These diffuse structures are too faint to have been studied with previous observations so the MUSE data enables a quantitative study of their properties for the first time. Much of the extended emission follows the approximate structure of the bright filaments (with the exception of region A) suggesting the structures may be related. However, this extended emission is more than an order of magnitude fainter than the faintest filaments in this system and extends far beyond the tightly constrained filaments seen in high resolution HST imaging (Fabian et al., 2016). This suggests the possibility they are a distinct, previously unknown, component of the nebula which, while seemingly related to the filaments, may have different formation and excitation mechanisms.
3.1 The filaments
The filamentary system in Centaurus has been extensively studied by many authors (e.g. Sparks et al., 1989; Crawford et al., 2005; Fabian et al., 2016; Sanders et al., 2016, to name a few). In particular Canning et al. (2011) perform a detailed analysis using deep VIMOS IFU observations to study the kinematics and physical properties of the optical line emitting filaments. The MUSE data presented in this paper are considerably more sensitive than this VIMOS data and have improved spatial sampling and a much larger field of view (see Figure 2). However, the filaments in this system are bright and were already well detected by the VIMOS observations. The kinematic and physical properties measured with MUSE are consistent with those found in Canning et al. (2011) and thus will not be readdressed in this paper.
We define the filaments as the structures detected at greater than 3 in the H narrowband image (Figure 1). Total detected fluxes of all measured lines from this filament region are given in Table 1. The brightest lines in the spectrum ([NII]λ6548&6583 & H) have fluxes slightly higher than those quoted by Canning et al. (2011) but this can be attributed to recovering the filaments over a larger extent than was possible with the VIMOS data. Likewise the H and [OIII]λ4959&5007 fluxes are significantly higher as these are now recovered from the full filament system not just the central 2727 arcsec2. The [OI]λ6300 and [SII]λ6716&6731 are significantly brighter than in the VIMOS data, this is likely due to the increased sensitivity of MUSE allowing flux from these weaker lines to be recovered from the fainter regions of the filaments.
Table. 1.
Total emission line fluxes from the filaments
| Emission | Total Flux | Flux/FHα |
|---|---|---|
| Line | (erg s-1 cm-2) | |
| H | 4.10.06 10-14 | 0.34 |
| [OIII]λ4959 | 1.10.33 10-14 | 0.09 |
| [OIII]λ5007 | 3.30.98 10-14 | 0.28 |
| [NII]λ5755 | 5.8 10-16 | 5 10-3 |
| [OI]λ6300 | 7.91.38 10-14 | 0.67 |
| [NII]λ6548 | 9.10.19 10-14 | 0.78 |
| H | 11.70.17 10-14 | 1.00 |
| [NII]λ6583 | 27.20.57 10-14 | 2.33 |
| [SII]λ6716 | 9.90.12 10-14 | 0.85 |
| [SII]λ6731 | 8.60.11 10-14 | 0.73 |
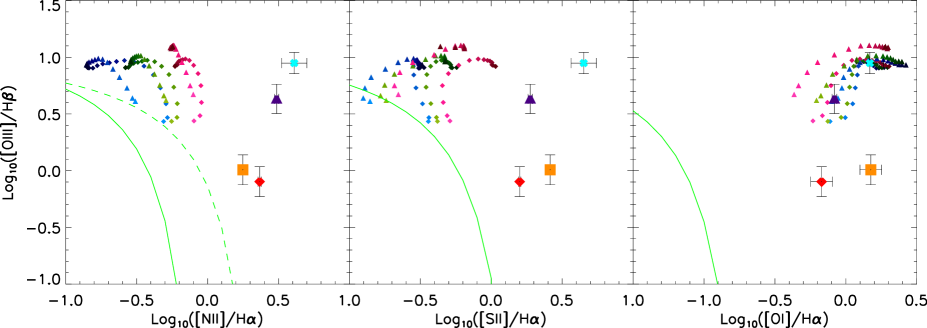
Figure 4 shows the standard line ratio diagnostic plots (Baldwin et al., 1981; Kewley et al., 2006) for emission from the filaments (red diamond). The position of the filaments on these falls within the LINER region of the plots, consistent with the findings of (Canning et al., 2011). The line ratios are strongly inconsistent with models of star formation excitation (Kewley et al., 2006) as is typically the case for optical nebulae in cluster cores (e.g. Johnstone & Fabian, 1988; Crawford & Fabian, 1992; Hamer et al., 2016). The line ratios are very consistent with the particle heating models (cosmic rays) produced by Ferland et al. (2009) which are often invoked to explain the line ratios from optical nebula in galaxy cluster cores. However in this case we cannot rule out excitation through slow shocks (300 km s-1, the lower velocity limit for the shock models plotted in Figure 4, taken from Allen et al., 2008) from this analysis alone.
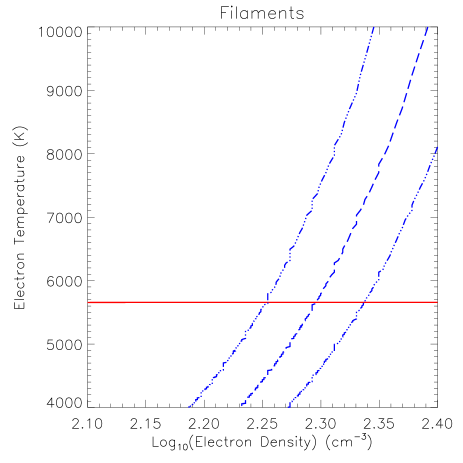
The [SII]λ6716 / [SII]λ6731 line ratio measured from the MUSE data (1.160.021) is slightly lower than that measured from the VIMOS data (1.220.13). The MUSE data also allow a considerably stronger upper limit to be placed on the flux of the [NII]λ5755 emission line which is significantly weaker than the measured [NII]λ6548 & [NII]λ6583 lines. The combination of these five lines allows strong constraints to be placed on the electron temperature (Te) and electron density (ne) within the filaments. These diagnostics give an upper limit on electron temperature in the filaments of T 5685 K with an electron density of ne=159–198 cm-3 (Figure 5) assuming a lower limit on temperature of 3500 K. This corresponds to an upper limit on the pressure within the filaments of P 1.13106 K cm-3 which is consistent with the ICM pressure within the filaments over a similar extent (0.06–0.07 keV cm-3 0.7–0.8106 K cm-3, from Figure 17 in Sanders et al., 2016).
3.2 The diffuse extended nebula
While evidence of the extended emission filling the regions between cavities is present in the data used by previous studies (e.g. Canning et al., 2011; Fabian et al., 2016) its properties have not been studied. The resolution and sensitivity of the MUSE data allows these regions to be isolated and studied in detail so they can be contrasted to the brighter filaments. We define this extended emission as coming from pixels in which [NII]λ6583 emission is detected at greater than 3 but H is not in the narrow band images (Figure 1, a masked [NII]λ6583 image is provided in Figure 6). The total spectrum from this emission, along with the spectral fits can be found in Figure 7. The [NII]λ6583 emission is immediately apparent in this spectrum, peaking at the red edge of the H absorption feature even prior to continuum subtraction. The total detected fluxes of all measured lines from this extended emission are given in Table 2.
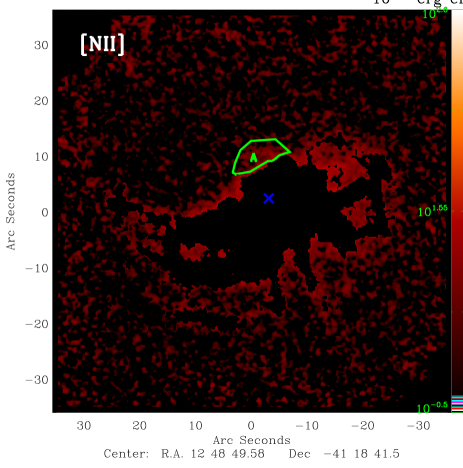
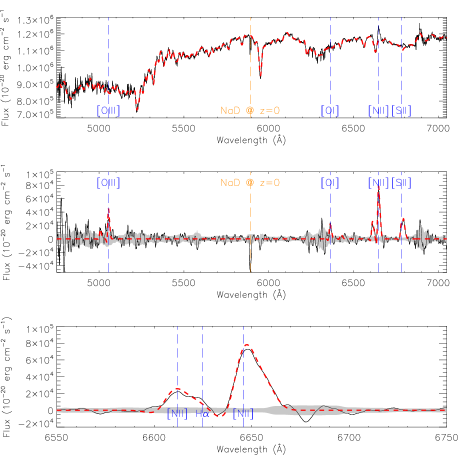
Table. 2.
Total emission line fluxes from the extended emission
| Emission | Total Flux | Flux/FHα |
|---|---|---|
| Line | (erg s-1 cm-2) | |
| H | 2.50.73 10-15 | 0.35 |
| [OIII]λ4959 | 3.60.20 10-15 | 0.50 |
| [OIII]λ5007 | 10.80.61 10-15 | 1.49 |
| [NII]λ5755 | 3.8 10-16 | 0.05 |
| [OI]λ6300 | 6.00.18 10-15 | 0.82 |
| [NII]λ6548 | 7.30.15 10-15 | 1.01 |
| H | 7.30.25 10-15 | 1.00 |
| [NII]λ6583 | 22.00.4 10-15 | 3.04 |
| [SII]λ6716 | 6.40.17 10-15 | 0.88 |
| [SII]λ6731 | 7.10.19 10-15 | 0.98 |
Overall most of the measured lines fluxes from the extended emission are around an order of magnitude fainter than they are in the filaments. The exception here is the [OIII]λ4959&5007 emission line fluxes which are only a factor 3 fainter in the extended emission than the filaments. Of particular note is that these lines are now significantly stronger relative to the other emission lines, being 5 times brighter relative to H and 4 times brighter relative to [OI]λ6300. Some of this difference may be a result of the increased uncertainty on the measured line fluxes due to the lower signal to noise, in particular the Balmer lines where the subtraction of continuum features compounds this. However, we note that relative to H the other line fluxes remain relatively consistent between the two regions, changing by no more than 30%. The structure of the other forbidden lines in continuum subtracted narrowband images is similar to the [NII]λ6583 narrowband, showing some evidence of diffuse extended emission. However as these lines are significantly fainter it is not possible to map them to the full extent seen in [NII]λ6583.
The relatively strong [OIII]λ4959&5007 emission suggests the physical conditions within these regions may be significantly different to that of the filaments. In particular the high flux of [OIII]λ4959&5007 relative to [OI]λ6300 largely rules out excitation through particle heating (Ferland et al., 2009). The standard line ratio diagnostic plots for the extended emission are shown in Figure 4 as the purple triangle. As expected, and much like the filaments, the extended emission line ratios are very inconsistent with star formation excitation but due to the strong [OIII]λ4959&5007 are also inconsistent with particle heating. The measured line ratios are best matched with the shock models of Allen et al. (2008) (, which is consistent with the strong [OIII]λ4959&5007 emission found in these regions. We do note that the measured [NII]/H and [SII]/H ratios are far higher than those predicted by the shock models, however at these densities the shock models are only defined for solar abundances while the abundances of N and S in the core of the centaurus cluster rise to approximatly 2 Z⊙ (Sanders & Fabian, 2002, 2006). This would increase these ratios so could account for this discrepancy.
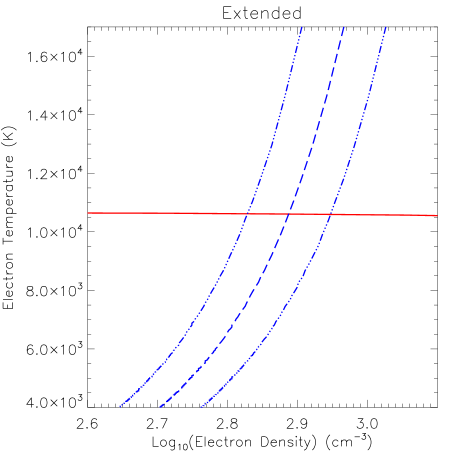
The [SII]λ6716 / [SII]λ6731 line ratio measured from the extended emission is 0.890.034 making it significantly different to that of the filaments (1.160.021). The [SII]λ6716&6731 lines are both detected at high significance allowing this ratio to be used to place strong constrains on the electron density (ne) from these extended emission regions. However, the lower signal to noise means that the upper limit on the [NII]λ5755 flux is significantly higher relative to the measured flux of the [NII]λ6548&6583 lines (1%). As such the electron temperature (Te) in this region is not as well constrained as in the filaments with a value of T 10555 K. The electron density within this region is then ne=471–766 cm-3 (assuming a lower limit on temperature of 3500 K) which is considerably higher than within the filaments (Figure 8). This puts an upper limit on the pressure of P 8.09106 K cm-3, significantly higher than within the filaments which is consistent with the presence of shocks within these regions. Unfortunately as these values are measured from irregular regions between the bright filaments accurately matched estimates of the ICM pressure (which tend to be extracted from large radial bins) are not available.
3.3 Emission from the filament free region to the north east
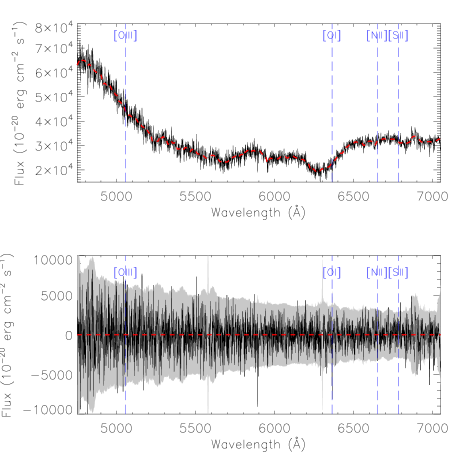
As discussed in Section 3 the narrow band [NII]λ6583 image (Figure 1) shows emission extended to the north of the BCG where no filaments have been detected in previous studies. The structure of this emission closely matches that of a shell like structure in the x-ray emission seen by Sanders et al. (2016) and corresponds to a high pressure region of the ICM (see their figure 13). We designate this as region A and it occupies an area on the sky of 36 arcsec2. Figure 9 shows the extracted spectrum of Region A along with spectral fits to the stellar and nebula components. Prior to the continuum subtraction only the [NII]λ6583 is visible in the spectrum but the emission lines detected in the other regions are revealed once the continuum is removed. The measured fluxes of all lines detected in region A are listed in Table 3.
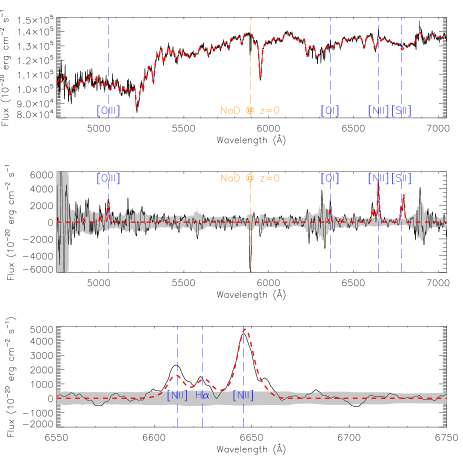
Table. 3.
Total emission line fluxes from region A
| Emission | Total Flux | Flux/FHα |
|---|---|---|
| Line | (erg s-1 cm-2) | |
| H | 8.91.8 10-17 | 0.35 |
| [OIII]λ4959 | 26.52.0 10-17 | 1.03 |
| [OIII]λ5007 | 79.46.1 10-17 | 3.10 |
| [NII]λ5755 | 6.6 10-17 | 0.25 |
| [OI]λ6300 | 37.83.7 10-17 | 1.48 |
| [NII]λ6548 | 34.81.1 10-17 | 1.01 |
| H | 25.65.2 10-17 | 1.00 |
| [NII]λ6583 | 104.43.3 10-17 | 4.08 |
| [SII]λ6716 | 43.93.3 10-17 | 1.72 |
| [SII]λ6731 | 70.83.3 10-17 | 2.77 |
The measured line fluxes from this region are all 2–3 orders of magnitude fainter than the total measured from the filaments, though we do note that region A covers a significantly smaller area. While [NII]λ6583 remains the brightest line the [OIII]λ4959&5007 lines are extremely bright relative to the other lines, with the [OIII]λ5007 the second brightest having 76% the flux of the [NII]λ6583. The Balmer lines are very faint in this region, possibly due to the continuum fit not fully accounting for the absorption features, with an [NII]λ6583/H ratio of 4. Despite this they remain consistent with each other, with H/H = 0.35, similar to that seen in the rest of the nebula. The [NII]λ6583 flux detected from this region represents less than 0.5% of the total from the nebula. This results in an average surface brightness of 2.90.110-17 erg cm-2 s-1 arcsec-2 or 8.70.410-19 erg cm-2 s-1 spaxel-1 making it impossible to map the detailed structure of this extended emission with the data presented here.
The strong [OIII]λ4959&5007 emission, with [OIII]λ5007 more than three times brighter than the H line and twice as bright as the [OI]λ6300, suggests the physical conditions in this regions are more like that of the extended emission than the the filaments which is consistent with the faint and apparently diffuse structure of the region. Line ratio diagnostics for region A are shown in Figure 4 as the cyan cross and immediately rule out excitation by star formation. Much like the extended regions the line ratios are inconsistent with particle heating as the source of excitation within region A which is expected given the high [OIII]λ5007/[OI]λ6300 ratio. The strong [OIII]λ4959&5007 suggests that shocks could be involved in exciting the gas, however the [NII]λ6583/H and [SII]λ6716&6731/H ratios are too high to be explained by the shock models of Allen et al. (2008). To bring the measured values into agreement with the shock models would require either the gas abundances to be much higher than solar or a considerable underestimation of the measured Balmer line flux.
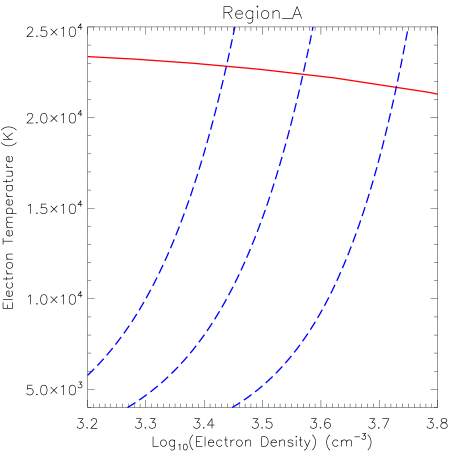
A key point to consider here however, is that region A occupies a high pressure region of the ICM (see Figure 13 in Sanders et al., 2016) and matches the structure of a shell surrounding the radio source which Sanders et al. (2016) suggest may be a shock generated by an outburst from the central AGN. The close correlation between these two structures indicate the two are likely related, further suggesting shock excitation within region A. The [SII]λ6716 / [SII]λ6731 ratio in region A is significantly lower than other parts of the nebula at 0.620.054 indicating the emitting gas is significantly denser. Unfortunately despite remaining undetected the best upper limit on the [NII]λ5755 flux for region A is very high at 6% of the [NII]λ6583 flux meaning the electron temperature in the region is very poorly constrained at T 22438 K. Assuming a lower limit on temperature of 3500 K this indicates an electron density of ne=1729–3354 cm-3 (Figure 10) and a pressure of P 7.52107 K cm-3. Given the bright [OIII]λ4959&5007 emission, high density/pressure and matched shell like structure in the ICM, the production of line emission in region A through shock excitation is the explanation most consistent with the currently available data.
Despite this we note that the measured upper limit to the pressure (P 7.52107 K cm-3) is considerably higher than the pressure seen in the ICM which peaks at 0.1 keV cm-3 (Sanders et al., 2016) or 1.16106 K cm-3. However, we note that the electron density, and thus the pressure, measured from the [SII]λ6731 / [SII]λ6716 ratio is dominated by the brightest (and densest) regions while the measured ICM pressure is the average over a large region. This suggests that the line emitting gas in region A may be clumpy. Assuming that region A is related to the shell like structure seen in the ICM then its three dimensional structure can be fairly well constrained (the shell will expand roughly equally in all directions). As such we can use the observed surface brightness of H in region A to determine the average density using the emission measure method (equations 3-35 & 3-36, Spitzer, 1978).
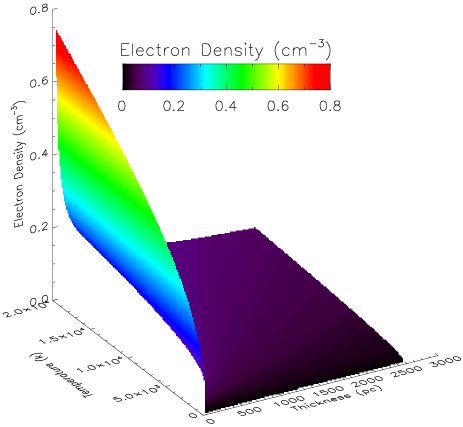
The measured intrinsic H surface brightness of region A is 3.910.1510-14 W cm-2 sr-1. Assuming the shell is spherical then the average distance through it is equal to average projected extent which is 2 kpc. The average density of the region (ne,av) is then n0.07 cm-3 at Te=20000 K (close to the upper limit of Te<22437 K) or n0.035 cm-3 at the electron temperature of the filaments (Te=5684 K). Figure 11 shows the measured average electron density for the parameter space Te=100–20000 K and thickness L=16–2560 pc. This does not exceed an electron density of ne=0.8 cm-3, still orders of magnitude lower than the value measured from the emission lines.
This suggests that the emitting medium is either an extremely thin sheet in the plane of the sky or very clumpy. We calculate that to match the electron density from the two measures would require the thickness of the emitting medium to be on the order of L=110-6 pc. Such a thin sheet of emitting gas extending over 2 kpc (nine orders of magnitude more) in the plane of the sky seems extremely unlikely. In the case of a clumpy medium the upper limit on the volume filling factor of the warm ionised gas in region A is 410-5 which is also extremely low. Given this and the apparent shock indicated by the X-ray shell it is likely that the line emitting structure has elements of both, forming a thin, flocculent shell of dense clumps along the shock front.
3.4 Radial variation
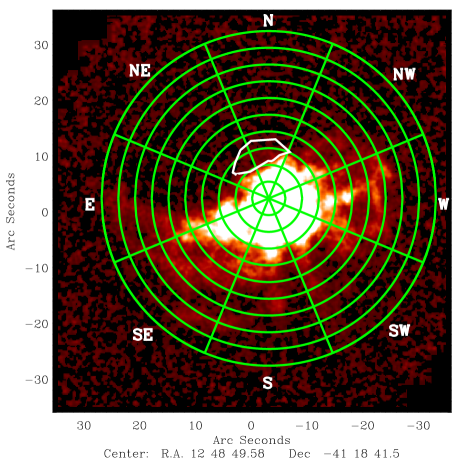
While the emission from this extended nebula is not sufficiently bright to resolve directly we can study its large scale properties through radial variations. Spectra were extracted from radial bins (3" thick by 45∘ wide) along the cardinal and ordinal directions out to a distance of 30" (6 kpc) from the centre of the BCG (sufficient to cover the extended nebula and filaments, see Figure 12). The spectra from each bin were fitted and the parameters of the continuum and nebula line emission extracted.
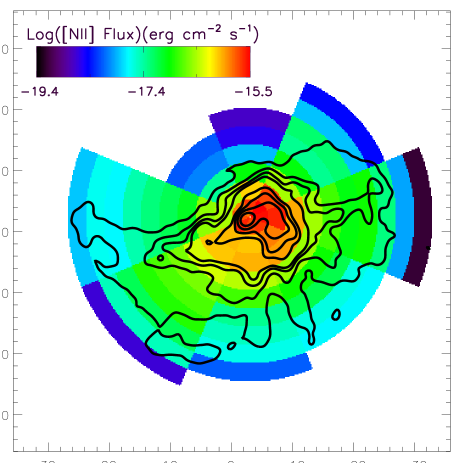
In Figure 13 we present the [NII]λ6583 flux map produced from fits to these radial bins (radial flux profiles can be seen in Figure 14). Along most directions [NII]λ6583 emission is only detected (at S/N > 3) in radial bins which show some filamentary structure in the [NII]λ6583 narrow band image. However, we note that to the north and north east [NII]λ6583 is detected out to a distance of 3.8 and 3.2 kpc (the 6th and 5th radial bins) respectively, extending beyond even region A (which mostly occupies the 3rd and 4th radial bins). Figure 15 shows the fits to the continuum subtracted spectra for the radial bins along the northern direction. The [NII]λ6583 is clearly visible peaking above the noise level out to the 6th radial bin indicating the significance of these detections.
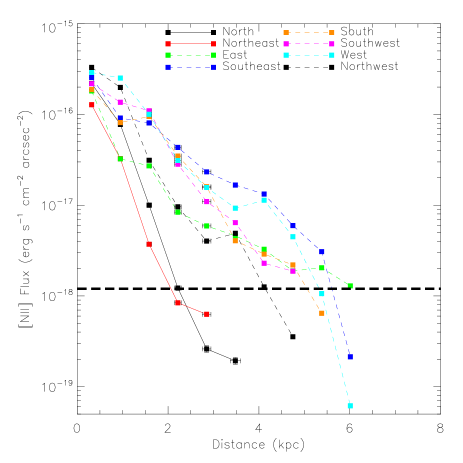
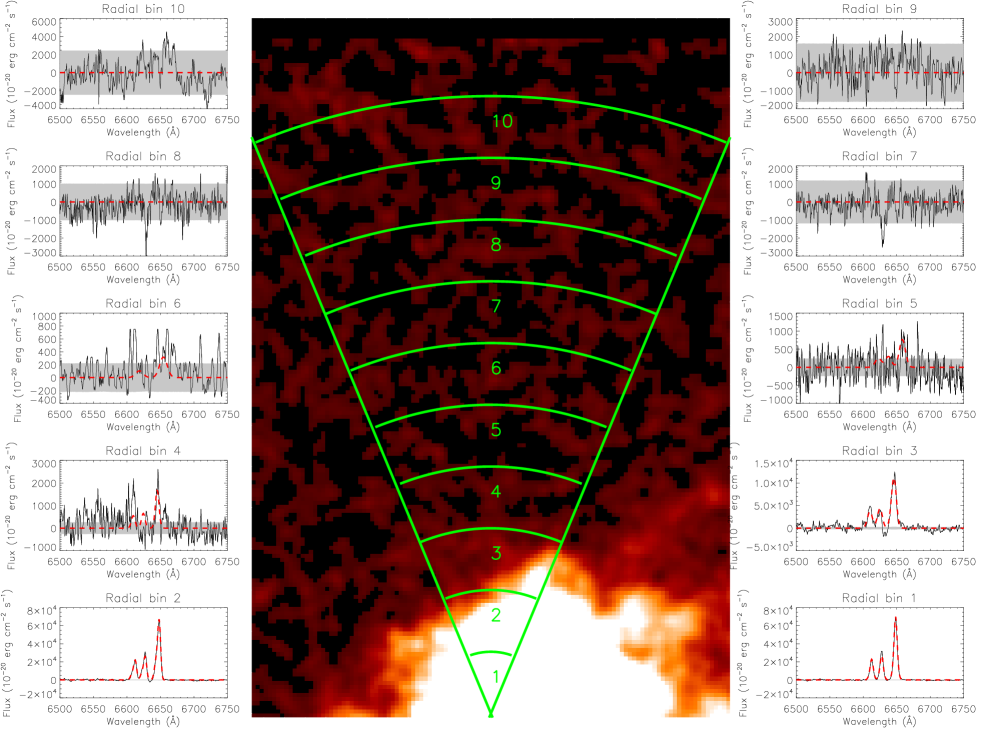
To the north and north east, [NII]λ6583 emission is detected in regions which do not contain bright filamentary structures (which only extend as far as 1.9 and 1.3 kpc or the 3rd and 2nd radial bins) or any of the fainter structures seen in the [NII]λ6583 narrowband image (Figure 1 and discussed in the previous sections). This emission indicates the presence of a nebula component which extends beyond both the filaments and the other extended structures already discussed. A similar structure is potentially present throughout the nebula but is not clearly detected in other regions due to the dominance of the emission from the filaments. Indeed we note that along the north and north east directions the [NII]λ6583 flux is consistent with that detected along the directions containing filaments out to the second radial bin (1.3 kpc). Beyond this the flux drops sharply and is more than an order of magnitude fainter than the filaments by the 4th radial bin (2.5 kpc) and is consistent with the flux from the filaments at their most extended regions (8th-9th radial bins, 5-5.7 kpc). This suggests the most extended emission to the north and north-east may represent a more extended line emitting halo which the filaments are extending into.
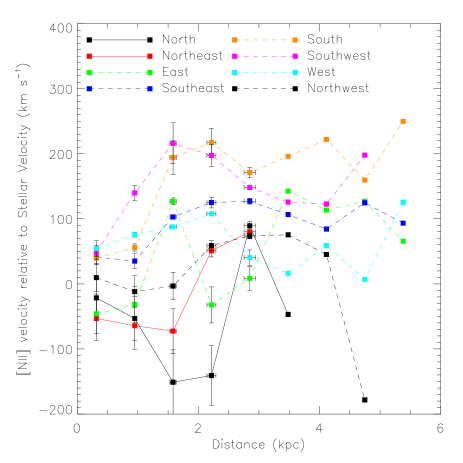
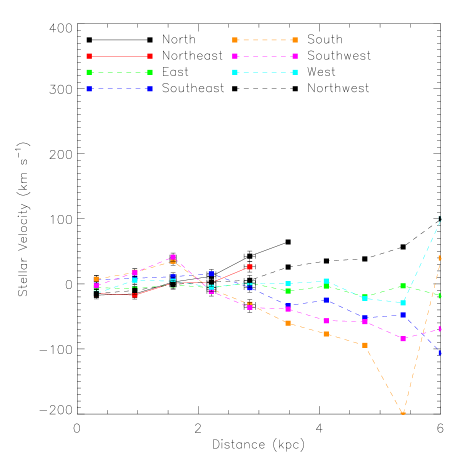
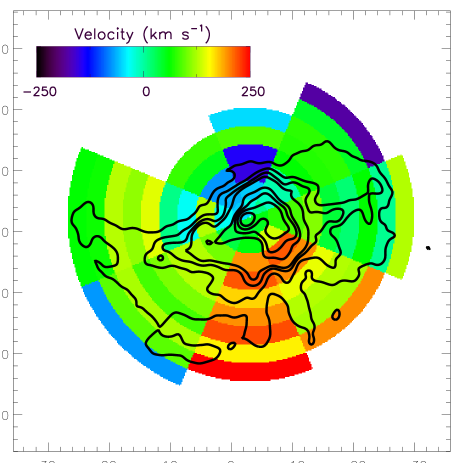
Profiles of the [NII]λ6583 velocity relative to the local stellar velocity (Figure 16) show considerable scatter but are typically significantly offset from a matching velocity indicating that both the filaments and halo are kinematically distinct from the BCGs extended stellar component. A clear velocity gradient can be seen in the resolved velocity map (Figure 17) running across the galaxy, from redshifted emission in the south and south–west to blueshifted in the north and north–east. This was already seen in the velocity maps of Canning et al. (2011), though here the velocities are measured relative to that of the local stellar continuum (z=0.09869) making them 87 km s-1 higher. However, to the north and north–east this velocity gradient reverses when it reaches the most extended regions detected. This can be seen as a shift back towards redshifted velocities of 37713 km s-1 at 2.5 kpc to the north and 32850 km s-1 at 1.9 kpc to the north–east and can also be seen in the velocity profiles (Figure 16). At these distances the emission is from the halo and as such this velocity shift from filamentary to halo components may be indicating that the two are kinematically distinct. To confirm this it would be necessary to begin to resolve the diffuse emission so that the presence of a strong velocity shift across the transition could be confirmed.
3.5 X-ray Comparison
As is common in cluster cores the structure of the filamentary component of the optical nebula is qualitatively matched to the soft X-ray emission from the ICM (Figure 18). Region B (outlined in Yellow) appears to break this trend showing bright X-ray filaments but no evidence of line emission even in its total spectrum (see Figure 19). However, it must be noted that this region is at the edge of the MUSE cube so the signal to noise obtained will be lower due to having a lower total integration time (820–1640s) as a result of the dithering pattern employed during the observations. The measured upper limit on the [NII] flux from this region is 34.510-17 erg cm-2 s-1 which is higher than the H flux detected from region A where the X-ray surface brightness is similar. As such it is possible that line emission is present in this region, but is below the detection limit of the current data.
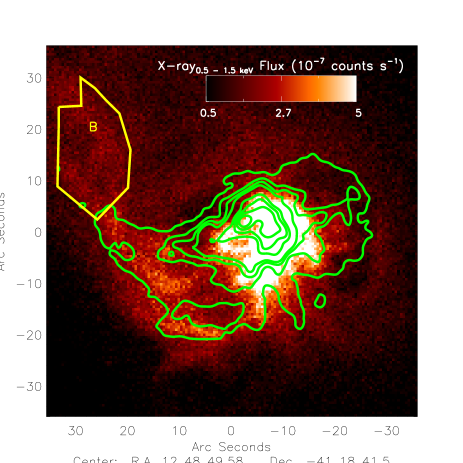
What is unclear is if the X-ray – optical structural relation holds for the halo presented in this paper. From Figure 18 it is apparent that the X-ray emission does show some structure to the north and north east of the core (beyond region A), where the halo is most clearly detected. The brighter part of this strucutre extends roughly the same distance from the core as the detected [NII]λ6583 halo hinting that the halo may be following this strucutre. However this is far from conclusive, and would require the mapping of a significant fraction of the halo at comparable resolution to the ICM to confirm, something beyond the limits of the current data.
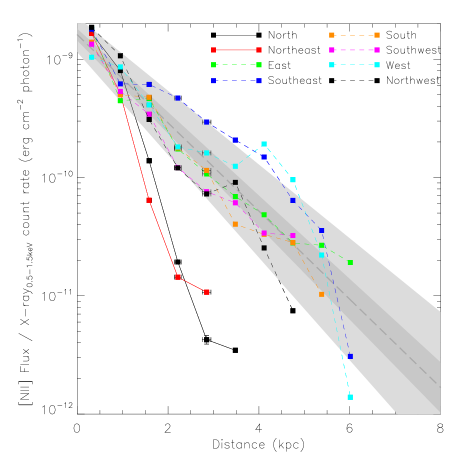
Comparing the radial profiles of [NII]λ6583/X-ray0.5-1.5keV fluxes (Figure 20) a general trend can be seen with the filamentary regions having higher ratios than the diffuse regions (region A and the Halo) at the same radius (similar to the [NII]λ6583 Flux profiles, Figure 14). All profiles are tightly correlated out to the second radial bin (0.95 kpc). Beyond this the filaments and diffuse regions diverge with the filaments all following the general trend of the form erg cm-2 photon-1 (where R is the projected distance from the centre of the BCG in kpc) to within 3. The diffuse regions fall more sharply and lie well below this trend suggesting either less optical line emitting gas is present or that it is excited through a different mechanism from the filaments. This is consistent with our analysis of region A, which shows a very low gas filling factor and significantly different line ratios to the filaments. Unfortunately additional optical emission lines are to weak to be detected in the halo making studying the excitation and physical properties of the gas through standard line ratio diagnostics impossible with the current data.
4 Discussion
The optical line emission detected in extended and seemingly non filamentary regions of the Centaurus cluster can be classified into three different structures.
-
(a)
Emission surrounding the filaments - Line emission seen from the regions of the cluster core surrounding the bright and high contrast filaments.
-
(b)
Emission from the northern shell (region A) - Line emission seen extending to the north of the BCG where there are no filaments and matching the position of an x-ray shell.
-
(c)
Emission from the extended halo - Line emission seen only when high levels of binning are employed, seen to the north and north–east of the BCG beyond the northern shell.
The emission from these structures appears to differ in many ways to the previously known emission from the filaments. In particular the emission surrounding the filaments and the northern shell suggest the gas in these regions is much denser (by as much as an order of magnitude in the case of region A) than in the filaments. Similarly, our line ratio analysis suggests that the dominant excitation mechanism in these regions may be shocks while the values are much more consistent with particle heating in the filaments.
Given the fact that the emission surrounding the filaments appears to follow the large scale filamentary structure of the nebula it seems unlikely that this emission is unrelated to the filaments. Despite this its excitation state (as measured by the line ratios) is not consistent with the dominant heating mechanism in the filaments (particle heating). However, the line ratios are more consistent with shock excitation, which is consistent with the higher electron density measured within these regions. It seems likely then that this emission originates from shocked regions of gas outside the filaments, perhaps liberated from the filaments by motions of the ICM or deposited in situ outside of the magnetic fields which support the filaments. Indeed the possibility of pressure imbalances within the multiphase ICM (Jaffe et al., 2001, 2005) could present a possibility where the outer shells of the filaments expand to fill the regions between them. However, in such a case the density and pressure of this extended gas would be lower than that of the filaments which is in contrast to the values measured here. It must be noted though that the [SII]λ6731 / [SII]λ67316 line ratio is most sensitive to the densest clumps of the gas and that the mean density of this region is likely much lower than indicated given the low surface brightness.
Likewise, the striking similarity in the structure and extent of region A to the X-ray shell seen by Sanders et al. (2016) suggests that the two structures are likely related. Indeed Sanders et al. (2016) suggest the shell may be related to a shock in the ICM and the high density of the line emitting gas in region A, as well as the line ratio diagnostics, are consistent with the presence of a shock in this region. A similar situation can be found within the Perseus cluster where a weak shock to the north of the BCG which corresponds to a region devoid of filaments (Graham et al., 2008). Interestingly in this case filaments are present either side of the shock, terminating at the shock front,suggesting that filaments may have once been continuous through this region but have since been disrupted by the shock. The low volume filling factor in region A ( <410-5) suggests that the gas is either extremely clumpy or forms a thin (10-6 pc thick) bubble expanding with the shock front. Given the extremely low values of both the volume filling factor and thickness of a continuous shell, the actual structure is potentially a combination, in the form of a thin clumpy regions expanding with the shock.
The nature of the extended halo is much less clear as it is so faint that only the brightest emission line ([NII]λ6583) can be significantly detected. However, the fact that it can only be detected when the spectra are binned over very large extents suggests that the emission may be diffuse rather than concentrated in narrow regions as is seen in the filaments. While the limits of the data make it difficult to draw strong conclusions on the nature of this halo emission several potential origins can still be explored:
-
1.
Faint Filaments could be present throughout the sampled region which are not sufficiently bright to be resolved. If the flux from these filaments was spread uniformly over 100 spaxels within each radial bin then this would make them comparable to the noise in our narrowband images and they would thus be undetected. This represents 25% of the bin size beyond the 2nd radial bin (0.95 kpc) so cannot be ruled out with the current data.
-
2.
Gas from destroyed/disrupted filaments that were once present in this region could now be spread more diffusely throughout the cluster core. Such filaments could have potentially been stripped by the ICM if a relative motion was present or could have been “evaporated" through the excitation mechanisms which illuminate them. Filaments are believed to be stabilised against such processes due to support by magnetic fields (Fabian et al., 2008) and this stabilisation would need to remain after the disruption of the filaments to prevent the cold gas being lost to the extremely hot ICM (107 K) and it is currently unclear how this could be accomplished.
-
3.
Mass loss from stars in the BCGs extended envelope could be responsible for the gas producing this emission. In this case however, we would expect the gas to share the local stellar velocity within each bin which does not appear to be the case (see Figure 16).
-
4.
Gas cooling from the ICM will recombine as it falls from 106 K to 103 K resulting in optical line emission, however the emission line flux detected from filaments is typically far in excess of what is expected to be produced in this way (Johnstone et al., 1987). Within the radial bins from the halo regions the [NII]λ6583 luminosity falls to 1.51037 erg s-1 at the most distant regions from the cluster. Assuming the [NII]λ6583/H ratio measured from the total nebula (2.330.06) and the standard H to H ratio of 2.86 (case B recombination at T=104 K & ne=102 cm-3 with no reddening) then using equation 1 from Johnstone et al. (1987) this line emission would represent a mass deposition rate of 0.1–0.2 M⊙ yr-1. While this seems low it represents a region of at most 3 kpc2 and if it were constant over the full region containing filaments would represent a total mass flow rate of 4.2–8.3 M⊙ yr-1 from the inner 6 kpc region. The lower end of this range is remarkably consistent with the upper limit of cooling determined from the FeXVII emission feature in the RGS spectra from a similar region of the Centaurus cluster core (4 M⊙ yr-1 Sanders et al., 2008).
-
5.
Light scattered along the line of sight by the ICM could be responsible for the extended diffuse emission (Fabian et al., 1989; Hines et al., 1999). Given the considerably lower flux in the diffuse regions this could be light which originated within the filaments. However, the electrons within the ICM will have thermal velocities of 10000 km s-1 (at 0.5 keV) which would broaden the scattered light to comparable line widths (Khedekar et al., 2014) which would be undetectable in the spectrum and are far in excess of those measured. The possibility remains that line emission could be scattered by cooler gas or dust (e.g. Dey et al., 1996; Zakamska et al., 2005), however dust should be quickly sputtered when exposed to the ICM unless shielded within dense cold gas clouds. As such scattering could only be responsible if cool gas were already present and as such is likely only having a boosting effect on the emission from these regions. To determine the fraction of emission that comes from scattered light would require polarization observations of these very faint regions which is beyond the capabilities of current instrumentation.
Since scattering would require cold gas to be present within these regions already option (v) cannot explain the observed features alone. The fact that the gas velocity does not match that of the stellar population makes it difficult to reconcile the line emission with gas produced by mass loss from stars in the BCGs extended envelope making origin (iii) extremely unlikely. The cooling rates from the ICM do appear sufficient to account for the emission from the halo suggesting option (iv) could be at work here. However, we note that the halo emission is detected from only a small region of the cluster core while emission from cooling gas would be expected to be spread more uniformly. This could potentially be a result of the bright filaments obscuring the halo emission in other parts of the cluster core, but it is not possible to resolve the individual components with the current data.
The radio structure from the AGN at the core of the Centaurus cluster shows a jet to the north splitting to form lobes which extend southwards forming a distinctive “U" shape (e.g. O’Dea et al., 1994; Taylor et al., 2006; Mittal et al., 2011). Such a structure suggests the possibility that the BCG is moving north at a significant velocity, leaving the radio plumes trailing behind it. This is consistent with the presence of a higher pressure region of the ICM to the north of the BCG. Taylor et al. (2006) do suggest that the jets appear to be being produced close to the line of sight (< 70∘ inferred from Doppler boosting) but also note that on larger scales the orientation of the jet is strongly modified so this is not inconsistent with the “U" shape being produced by a moving BCG. Such a motion could produce a wind as the BCG moves through the ICM which could have destroyed any filaments to the north east, disrupting them, and spreading their gas into the ICM.
The halo emission’s velocity offset from the BCG (of the order 100 km s-1) and the extent over which the emission is detected (of the order 1 kpc) would imply that even if this emission is related to disrupted filaments cold gas clouds must remain within this region for 10 Myrs () in order to produce the emission detected. This suggests that the cold gas from any disrupted filaments could not be short lived and must therefore retain some protection from the hot gas in the ICM (likely threaded by magnetic fields Fabian et al., 2008). While it is not clear how this could be achieved this is not sufficient to rule out origin (ii).
Of the four origins proposed only the third can be ruled out from the current data. Options (i), (ii) and (iv) all remain possibilities, although none are without their challenges, while option (v) is potentially boosting the observed flux. Unfortunately distinguishing between these options would require mapping the global structure, resolving the small scale structure and measuring the flux of multiple emission lines of this halo emission which is beyond the limits of the current data.
5 Conclusions
We present the detection of previously unknown extended structures seen in [NII]λ6583 emission surrounding the BCG in the Centaurus cluster. Notably these structures are much fainter than the filaments and appear to be more extended as well. The first structure appears to be related to the filaments, surrounding them and filling the gaps between them indicating that the gaps between filaments are not devoid of cool gas. A second structure forms a shell to the north of the BCG and is spatially coincident with an apparent shock structure seen in the X-ray emission. This fact and the high density and line ratios suggest that this structure is likely part of a shocked shell of gas surrounding the radio source.
The final structure appears in the form of halo emission which is orders of magnitude fainter than that from the previously known filaments. It is offset from the nearby filaments by 100–300 km s-1 in the region where it is most strongly detected. Noteably this offset is in the opposite direction to the larger scale velocity gradient (which produces similar sized offsets elsewhere in the nebula) suggesting it may be kinematically distinct. While it is too faint to extract measurable line ratios the measured [NII]λ6583 flux is consistent with that from filamentary regions with comparable X-ray flux, which does not suggest a drastically different excitation mechanism.
We conclude that this structure is most consistent with a filamentary origin, either representing extremely faint filaments or emission from filaments which have been disrupted (and their gas dispersed more diffusely) by their interactions with the cluster. However, we cannot rule out the possibility that this emission is related to gas cooling directly from the ICM and the fact that the required cooling rate to produce this emission is consistent with the measured cooling rate of the ICM is strongly suggestive of this possibility. In order to distinguish between these options more sensitive (and thus deeper) observations are required to allow us to map this extended structure and measure line ratios to more accurately constrain the gas excitation. Such observations should also cover a more extended region of the cluster core to allow a more extensive search for halo emission and additional soft x-ray structures within the ICM (such as the filaments to the far north east) to be investigated.
The optical nebula within cluster cores are typically assumed to be filamentary in nature as their structure is almost always seen to be filamentary. This may simply be due to the fact that the filaments make up the vast majority of the line flux and this discovery of a line emitting halo in the Centaurus cluster presents the first evidence that a more diffuse underlying structure may also be present. However, with the data presented it is not possible to rule out very faint filaments as a potential source of this newly detected emission, so it remains possible that deeper observations may yet identify filamentary structures within the halo. Despite the limitations, this discovery opens up the possibility of there being much more extended halos of optical line emission, and thus the associated cold gas, in cluster cores than previously known.
Acknowledgements
SLH & ACF acknowledge support from the European Research Council for Advanced Grant Program num 340442–FEEDBACK.
PS, FC, VO, FP & RB acknowledge support from the ANR grant LYRICS (ANR-16-CE31-0011).
Based on observations made with ESO Telescopes at the La Silla or Paranal Observatories under programme ID 094.A-0859.
References
- Allen et al. (2008) Allen M. G., Groves B. A., Dopita M. A., Sutherland R. S., Kewley L. J., 2008, ApJS, 178, 20
- Bacon et al. (2010) Bacon R., et al., 2010, in Ground-based and Airborne Instrumentation for Astronomy III. p. 773508, doi:10.1117/12.856027
- Baldwin et al. (1981) Baldwin J. A., Phillips M. M., Terlevich R., 1981, PASP, 93, 5
- Canning et al. (2011) Canning R. E. A., Fabian A. C., Johnstone R. M., Sanders J. S., Crawford C. S., Ferland G. J., Hatch N. A., 2011, MNRAS, 417, 3080
- Cappellari (2017) Cappellari M., 2017, MNRAS, 466, 798
- Conselice et al. (2001) Conselice C. J., Gallagher III J. S., Wyse R. F. G., 2001, AJ, 122, 2281
- Crawford & Fabian (1992) Crawford C. S., Fabian A. C., 1992, MNRAS, 259, 265
- Crawford et al. (1999) Crawford C. S., Allen S. W., Ebeling H., Edge A. C., Fabian A. C., 1999, MNRAS, 306, 857
- Crawford et al. (2005) Crawford C. S., Sanders J. S., Fabian A. C., 2005, MNRAS, 361, 17
- Dey et al. (1996) Dey A., Cimatti A., van Breugel W., Antonucci R., Spinrad H., 1996, ApJ, 465, 157
- Fabian (2012) Fabian A. C., 2012, ARA&A, 50, 455
- Fabian et al. (1982) Fabian A. C., Atherton P. D., Taylor K., Nulsen P. E. J., 1982, MNRAS, 201, 17P
- Fabian et al. (1989) Fabian A. C., Rees M. J., Stella L., White N. E., 1989, MNRAS, 238, 729
- Fabian et al. (2003) Fabian A. C., Sanders J. S., Crawford C. S., Conselice C. J., Gallagher J. S., Wyse R. F. G., 2003, MNRAS, 344, L48
- Fabian et al. (2005) Fabian A. C., Sanders J. S., Taylor G. B., Allen S. W., 2005, MNRAS, 360, L20
- Fabian et al. (2008) Fabian A. C., Johnstone R. M., Sanders J. S., Conselice C. J., Crawford C. S., Gallagher III J. S., Zweibel E., 2008, Nature, 454, 968
- Fabian et al. (2016) Fabian A. C., et al., 2016, MNRAS, 461, 922
- Ferland et al. (2009) Ferland G. J., Fabian A. C., Hatch N. A., Johnstone R. M., Porter R. L., van Hoof P. A. M., Williams R. J. R., 2009, MNRAS, 392, 1475
- Graham et al. (2008) Graham J., Fabian A. C., Sanders J. S., 2008, MNRAS, 386, 278
- Hamer et al. (2012) Hamer S. L., Edge A. C., Swinbank A. M., Wilman R. J., Russell H. R., Fabian A. C., Sanders J. S., Salomé P., 2012, MNRAS, p. 2520
- Hamer et al. (2015) Hamer S., Salomé P., Combes F., Salomé Q., 2015, A&A, 575, L3
- Hamer et al. (2016) Hamer S. L., et al., 2016, MNRAS, 460, 1758
- Heckman et al. (1989) Heckman T. M., Baum S. A., van Breugel W. J. M., McCarthy P., 1989, ApJ, 338, 48
- Hines et al. (1999) Hines D. C., Schmidt G. D., Wills B. J., Smith P. S., Sowinski L. G., 1999, ApJ, 512, 145
- Jaffe et al. (2001) Jaffe W., Bremer M. N., van der Werf P. P., 2001, MNRAS, 324, 443
- Jaffe et al. (2005) Jaffe W., Bremer M. N., Baker K., 2005, MNRAS, 360, 748
- Johnstone & Fabian (1988) Johnstone R. M., Fabian A. C., 1988, MNRAS, 233, 581
- Johnstone et al. (1987) Johnstone R. M., Fabian A. C., Nulsen P. E. J., 1987, MNRAS, 224, 75
- Kewley et al. (2006) Kewley L. J., Groves B., Kauffmann G., Heckman T., 2006, MNRAS, 372, 961
- Khedekar et al. (2014) Khedekar S., Churazov E., Sazonov S., Sunyaev R., Emsellem E., 2014, MNRAS, 441, 1537
- Le Fèvre et al. (2003) Le Fèvre O., et al., 2003, in Iye M., Moorwood A. F. M., eds, Proc. SPIEVol. 4841, Instrument Design and Performance for Optical/Infrared Ground-based Telescopes. pp 1670–1681, doi:10.1117/12.460959
- McDonald et al. (2010) McDonald M., Veilleux S., Rupke D. S. N., Mushotzky R., 2010, ApJ, 721, 1262
- McDonald et al. (2011) McDonald M., Veilleux S., Mushotzky R., 2011, ApJ, 731, 33
- McNamara & Nulsen (2012) McNamara B. R., Nulsen P. E. J., 2012, New Journal of Physics, 14, 055023
- Mittal et al. (2011) Mittal R., et al., 2011, MNRAS, 418, 2386
- O’Dea et al. (1994) O’Dea C. P., Baum S. A., Maloney P. R., Tacconi L. J., Sparks W. B., 1994, ApJ, 422, 467
- O’Dea et al. (2004) O’Dea C. P., Baum S. A., Mack J., Koekemoer A. M., Laor A., 2004, ApJ, 612, 131
- O’Dea et al. (2010) O’Dea K. P., et al., 2010, ApJ, 719, 1619
- O’Donnell (1994) O’Donnell J. E., 1994, ApJ, 422, 158
- Oonk et al. (2010) Oonk J. B. R., Jaffe W., Bremer M. N., van Weeren R. J., 2010, MNRAS, 405, 898
- Sanders & Fabian (2002) Sanders J. S., Fabian A. C., 2002, MNRAS, 331, 273
- Sanders & Fabian (2006) Sanders J. S., Fabian A. C., 2006, MNRAS, 371, 1483
- Sanders et al. (2008) Sanders J. S., Fabian A. C., Allen S. W., Morris R. G., Graham J., Johnstone R. M., 2008, MNRAS, 385, 1186
- Sanders et al. (2016) Sanders J. S., et al., 2016, MNRAS, 457, 82
- Sanderson et al. (2009) Sanderson A. J. R., Edge A. C., Smith G. P., 2009, MNRAS, 398, 1698
- Schlafly & Finkbeiner (2011) Schlafly E. F., Finkbeiner D. P., 2011, ApJ, 737, 103
- Schlegel et al. (1998) Schlegel D. J., Finkbeiner D. P., Davis M., 1998, ApJ, 500, 525
- Soto et al. (2016) Soto K. T., Lilly S. J., Bacon R., Richard J., Conseil S., 2016, MNRAS, 458, 3210
- Sparks et al. (1989) Sparks W. B., Macchetto F., Golombek D., 1989, ApJ, 345, 153
- Spitzer (1978) Spitzer L., 1978, Physical processes in the interstellar medium, doi:10.1002/9783527617722.
- Taylor et al. (2006) Taylor G. B., Sanders J. S., Fabian A. C., Allen S. W., 2006, MNRAS, 365, 705
- Valdes et al. (2004) Valdes F., Gupta R., Rose J. A., Singh H. P., Bell D. J., 2004, ApJS, 152, 251
- Zakamska et al. (2005) Zakamska N. L., et al., 2005, AJ, 129, 1212