Dark Matter in Ultra Diffuse Galaxies in the Virgo Cluster from their Globular Cluster Populations
Abstract
We present Keck/DEIMOS spectroscopy of globular clusters (GCs) around the ultra-diffuse galaxies (UDGs) VLSBB, VLSBD, and VCC615 located in the central regions of the Virgo cluster. We spectroscopically identify 4, 12, and 7 GC satellites of these UDGs, respectively. We find that the three UDGs have systemic velocities () consistent with being in the Virgo cluster, and that they span a wide range of velocity dispersions, from to km s-1, and high dynamical mass-to-light ratios within the radius that contains half the number of GCs (, , , respectively). VLSBD shows possible evidence for rotation along the stellar major axis and its is consistent with that of the massive galaxy M84 and the center of the Virgo cluster itself. These findings, in addition to having a dynamically and spatially ( kpc) off-centered nucleus and being extremely elongated, suggest that VLSBD could be tidally perturbed. On the contrary, VLSBB and VCC615 show no signals of tidal deformation. Whereas the dynamics of VLSBD suggest that it has a less massive dark matter halo than expected for its stellar mass, VLSBB and VCC615 are consistent with a M⊙ dark matter halo. Although our samples of galaxies and GCs are small, these results suggest that UDGs may be a diverse population, with their low surface brightnesses being the result of very early formation, tidal disruption, or a combination of the two.
Subject headings:
galaxies: clusters: individual (Virgo) – galaxies: individual (VLSBB, VLSBD, VCC615) – galaxies: kinematics and dynamics – galaxies: formation – galaxies: evolution1. Introduction
Ultra diffuse galaxies (UDGs) are extremely low surface brightness galaxies (central surface brightness mag arcsec-2) with luminosities in the dwarf galaxies regime (), and sizes in the massive galaxies regime (half-light radius kpc). UDGs are characterized by spheroidal shapes, nearly exponential surface brightness profiles, and quenched stellar populations (van Dokkum et al., 2015; Mihos et al., 2015, 2017).
Large low surface brightness galaxies were found for the first time in the Virgo cluster photographic plates by Sandage & Binggeli (1984); Binggeli et al. (1987). Later on, other studies found a few more of these diffuse galaxies (Impey et al., 1988; Dalcanton et al., 1997; Caldwell, 2006). However, with the new deep imaging surveys, a plethora of these systems are being found mainly in cluster environments (Koda et al., 2015; Mihos et al., 2015; Muñoz et al., 2015; van Dokkum et al., 2015; Martínez-Delgado et al., 2016; Toloba et al., 2016b; van der Burg et al., 2016; Janssens et al., 2017; Mihos et al., 2017; Román & Trujillo, 2017; Venhola et al., 2017).
There are three main posible mechanisms that could explain the observed properties of the UDGs. (1) They could be extended dwarf galaxies. Some simulations predict them to be rapidly rotating (Amorisco & Loeb, 2016), while others suggest that their extended sizes are the result of strong gas outflows (Di Cintio et al., 2017). (2) They could be tidal galaxies formed from the debris of harassed and ram pressure stripped galaxies that lost large fractions of stars. In these two scenarios, the UDGs are expected to have shallow potential wells which makes them vulnerable to the cluster environment (e.g., Moore et al., 1996). However, UDGs are found in extremely dense regions such as the core of the Virgo and Fornax clusters (Mihos et al., 2015, 2017; Muñoz et al., 2015) and the Coma cluster (van Dokkum et al., 2015). They could be falling in the cluster for the first time. (3) They are “failed” massive galaxies where the environment and/or internal feedback stopped the star formation and, as a result, the number of stars is smaller than expected for that size. In this scenario, UDGs have a massive dark matter halo that makes them less prone to disruption.
The large number of globular clusters (GCs) found in some UDGs (van Dokkum et al., 2017) points to the third scenario given that these numbers are more typical of massive galaxies than dwarfs (Peng et al., 2006). However, an analysis of a larger sample of UDGs suggests that they do not have a statistically significant excess of GCs compared to normal dwarf galaxies of the same stellar mass (Amorisco et al., 2016).
Measuring the dark matter halo would help to distinguish between formation scenarios. A massive dark halo can explain their survival in high density environments and their origin as “failed” massive galaxies gets stronger. A low mass dark halo would suggest that UDGs are puffed up dwarf galaxies that are likely on the verge of disruption. However, if disruption is currently happening, it is hard to interpret dark matter halo mass estimates based on observed velocities.
There are three UDGs with kinematic measurements in the literature. All three seem to have massive dark matter halos ( M⊙, Beasley et al., 2016; van Dokkum et al., 2016, 2017). We analyze here the internal dynamics of three UDGs in the central regions of the Virgo cluster doubling the current statistics. We assume the distance to the Virgo cluster is 16.5 Mpc (Mei et al., 2007; Blakeslee et al., 2009).
2. Data
2.1. Sample Selection
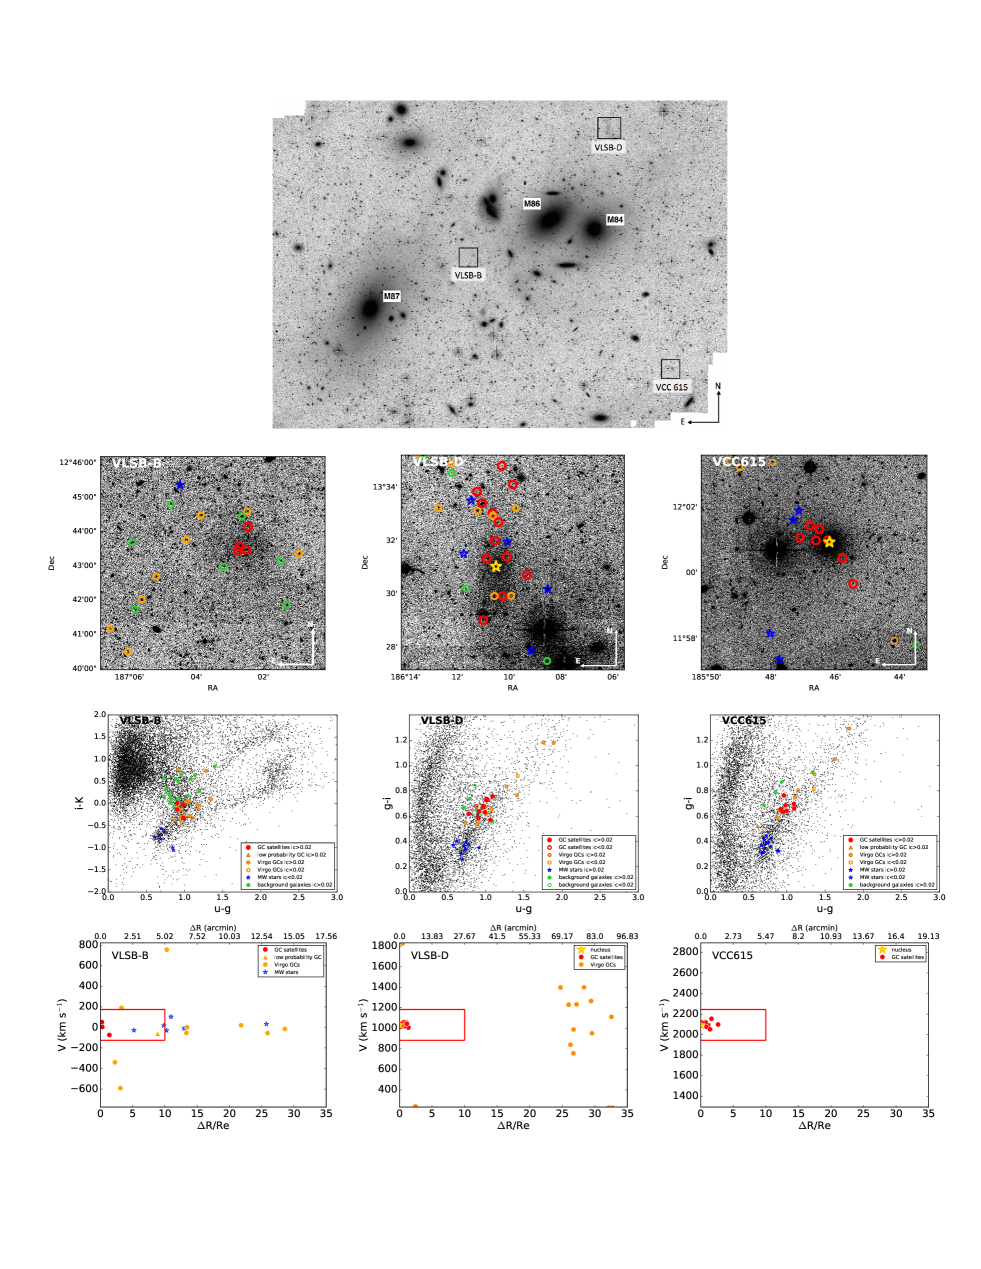
We target GC candidates in the Virgo UDGs VLSBB, VLSBD, and VCC615 (Binggeli et al., 1987; Mihos et al., 2015, 2017). The GCs are selected from the Next Generation Virgo cluster Survey (NGVS; Ferrarese et al., 2012). Point-like sources are split into three categories attending to their probability of being foreground stars, GCs in the Virgo cluster, and background galaxies. These probabilities are obtained combining the position of all point-like sources in different color-color diagrams based on , , , photometry (and only available for VLSBB, Muñoz et al., 2014) with the inverse concentration parameter (ic) which measures how point-like or extended the object is (see Figure 1; Powalka et al., 2016, Peng et at., in prep).
We select objects with and with higher probability of being GCs than being foreground stars or background galaxies. Due to the large field-of-view of the DEIMOS spectrograph (), we also include some foreground stars that, due to their position on the sky, are candidates for Virgo Overdensity and Sagittarius Streams (Figure 1). Their analysis will be presented in a future paper.
2.2. Observations and Data Reduction
The observations were carried out with the DEIMOS spectrograph (Faber et al., 2003) located at the KeckII 10m telescope (Mauna Kea Observatory). We designed one mask per UDG and the 600 lines/mm grating centered at 7200 Å with slit widths of and the GG455 blocking filter. The wavelength coverage is Å with a pixel scale of 0.52 Å/pixel, and a spectral resolution of 2.8 Å (FWHM).
The three DEIMOS slitmasks had position angles (P.A.) of 105 deg, deg, and deg, respectively for VLSBB, VLSBD, and VCC615. All the slits were aligned with the slitmasks but for VCC615, for which the slits had a 10 deg offset, resulting in the slits having P.A. deg.
The slitmasks were observed on March 04 2017, with exposure times of 83 min for VLSBB, 78 min for VLSBD, and 87 min for VCC615. The average seeing was (FWHM).
We reduced the data with the spec2d pipeline (Cooper et al., 2012; Newman et al., 2013) with improvements described by Kirby et al. (2015a, b). The wavelength solution is improved by tracing the sky lines along the slit and improving the extraction of the one-dimensional spectra by accounting for the differential atmospheric refraction along the slit. The main steps in the reduction process consisted of flat-field corrections, wavelength calibration, sky subtraction, and cosmic ray cleaning.
| VLSB-B | VLSB-D | VCC615 | |
| RA (hh:mm:ss) | 12:28:10.6 | 12:24:42.1 | 12:23:04.7 |
| DEC (dd:mm:ss) | 12:43:28 | 13:31:02 | 12:00:56 |
| MV (mag) | |||
| (kpc) | |||
| (mag arcsec-2) | |||
| (M⊙) | |||
| (kpc) | |||
| 4 | 12 | 7 | |
| (km s-1) | |||
| (km s-1) | |||
| (km s-1) | |||
| (km s-1 arcmin-1) | |||
| (km s-1) | |||
| (M⊙) | |||
| (ML⊙) | |||
| () |
3. Results
3.1. Radial Velocity Measurements and Membership Criteria
Line-of-sight radial velocities are measured following the same steps as described in Toloba et al. (2016a). In short, we feed the penalized pixel-fitting software (pPXF; Cappellari & Emsellem, 2004) with 17 high signal-to-noise ( Å-1) stellar templates observed with the same instrumental setup as the science data. To reduce the mismatch fitting problem, the stellar templates include stellar types from B1 to M0 and luminosity classes from supergiants to dwarfs. The radial velocity uncertainties are calculated running 1000 Monte Carlo simulations where the flux of each spectrum is perturbed within the flux uncertainty obtained during the reduction process assuming that it is Gaussian.
The final radial velocities are corrected by small offcentering effects across the slits. This affects unresolved sources and is quantified using the atmospheric B and A bands at Å and Å. The resulting radial velocity uncertainties are the quadrature sum of the uncertainty in the observed radial velocity and the A and B bands.
The membership criteria is described in Toloba et al. (2016a) and summarized in Figure 1. Those GCs that are within a box of and km s-1, approximately three times the typical velocity dispersion of dwarf galaxies, are considered GC satellites. The expected contamination for all the GC candidates combined is within this box. The contaminants would be intracluster GCs, GC satellites of other galaxies in Virgo, and Milky Way stars. Background galaxies are spectroscopically identified for their emission lines and removed from the sample. The GCs classified as satellites have median photometric probabilities of being GCs of and photometric probabilities of being stars smaller than .
3.2. Velocity Dispersion and Velocity Gradient
The dynamical properties of the three UDGs are analyzed using the Markov Chain Monte Carlo (MCMC) method (Foreman-Mackey et al., 2013). We make two implementations to avoid having more than two free parameters at a time. Assuming that the line-of-sight radial velocities () come from a Gaussian distribution, the logarithmic probability of the observed velocities for a certain systemic velocity () and velocity dispersion () is:
| (1) |
where is the number of GC satellites and are the radial velocity uncertainties which contribute to increase the width of the Gaussian distribution.
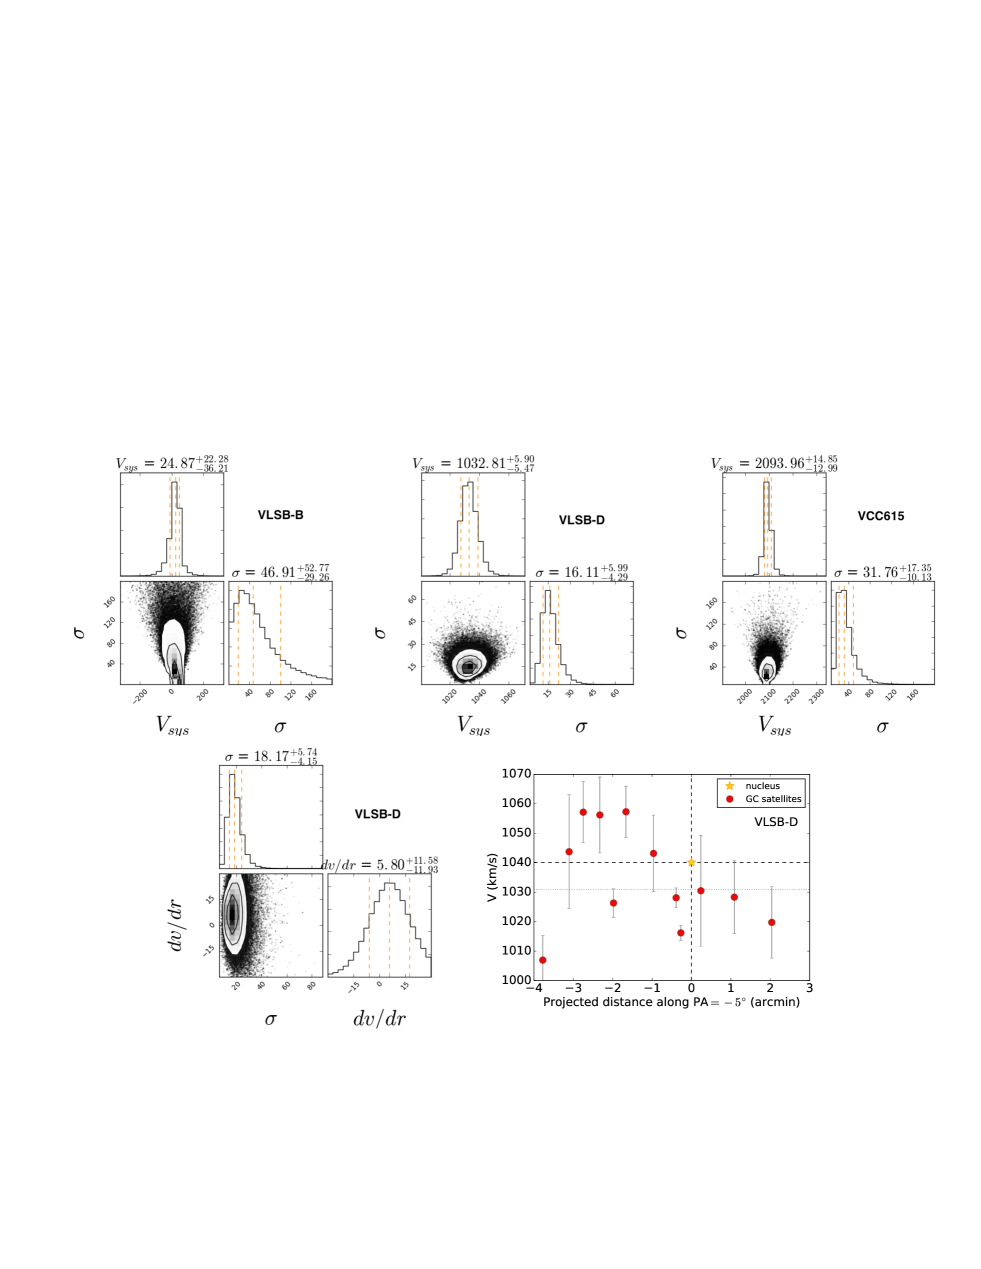
We run the implementation based on Equation 1 twice. The second time is fixed to the heliocentric velocity of the nucleus. This can only be done for VCC615 and VLSBD, the two nucleated UDGs.
Given the low numbers of GC satellites, we perform simulations to test the statistical significance and possible biases in the calculations. We simulate Gaussian distributions with input dispersions from 10 to 100 km s-1 in steps of 10 km s-1. For each one of these distributions, we randomly select 4, 7, and 12 velocities with uncertainties that are the average uncertainty of our observed radial velocities. For each randomly selected sample, we apply the same MCMC method as described above. In general, the input velocity dispersion is always recovered with possibly a small bias of km s-1 for large input velocity dispersions: km s-1 for samples of 12 GC satellites; km s-1 for samples of 7 GC satellites. For samples of 4 GC satellites and input dispersions km s-1, the overestimation can be as high as km s-1. However, this small bias is always within the measured error bars. On the contrary, if is fixed and is the only free parameter, the difference between the input and output dispersion is always km s-1 for input dispersions km s-1.
We estimate whether VLSBD, the UDG with the largest number of spectroscopically confirmed GC satellites, shows internal rotation using the MCMC implementation described in Martin & Jin (2010). The logarithmic probability in this case is:
| (2) |
where is fixed to the value obtained running the MCMC in Equation 1 and is the velocity gradient along the projected distance with P.A. :
| (3) |
and are the coordinated of the photometric galaxy center.
The first time we run the MCMC following Equation 2, we include as a free parameter. From that analysis we find the angle that maximizes (shown in Figure 3). In the final run, we fix to this suggested position angle.
In both MCMC implementations we use flat priors within plausible physical ranges: is within the typical values for Virgo cluster galaxies ( km s-1); dispersions are within km s-1; and velocity gradients are within km s-1 arcmin-1
The upper panels of Figure 3 show the MCMC results for Equation 1. All three UDGs have consistent with being galaxies in the Virgo cluster and show a wide range of low velocity dispersions ( km s-1). The and location in the sky suggest that VLSBB and VCC615 are members of the Virgo subcluster A within of its velocity distribution (see Boselli et al., 2014, for a description of the spectrophotometric parameters of Virgo substructures). The of VLSBD is smaller than the value measured for its nucleus (see Figure 1 and Table 1). This suggests that the nucleus is not at the center of the gravitational potential which is also supported by this nucleus being kpc spatially off-centered. The of VCC615 coincides with the velocity and position of its nucleus, which suggests that it is at the center of the gravitational potential. The systemic velocity of VLSBB is consistent with zero, which makes the available band photometry for these sources essential (see Figure 1 and Muñoz et al., 2014). Our four VLSBB GC satellites have probabilities of being GCs while their probabilities of being Milky Way (MW) stars are .
We perform two sets of simulations to investigate the effect that having one MW star in our sample of four GC satellites in VLSBB would have in our measured velocity dispersion. In the first set of simulations, we randomly select samples of three and four objects within a Gaussian distribution with widths from 10 to 100 km s-1 in steps of 10 km s-1. For each randomly selected sample we calculate the velocity dispersion following Equation 1. The velocity dispersions always agree within the error bars, although the uncertainties for calculations done with three objects are larger. In the second set of simulations we select three objects from a Gaussian distribution with a width of 45 km s-1, which represent GC satellites, and one object from a Gaussian distribution with width 100 km s-1, assuming that the halo of the MW has the same dispersion of that of M31 (Gilbert et al., 2014). We also include that the probability of this object being a MW star is as obtained from their photometric information. We calculate the velocity dispersion of the four objects following Equation 1. The results of these simulations suggest that we can reject with confidence the hypothesis of having a MW star in our sample. In summary, all these simulations indicate that the probability of having a MW star in our sample of GC satellites is very low but, if it is there, it does not affect the measured velocity dispersion, only increases its uncertainty.
The lower panels of Figure 3 show the measured velocity gradient for VLSBD. We use our simulations presented in Toloba et al. (2016a) to address the reliability of this velocity gradient given the low number statistics. These simulations show that for samples smaller than 10 GCs and velocity uncertainties km s-1 (or relative velocity uncertainties for low-mass galaxies with ), the velocity gradient measured for a galaxy that is not rotating and for a galaxy rotating with is undistinguishable. This means that any rotation measured under these conditions can be purely by chance. These conditions are met for VLSBB and VCC615. However, if the number of GCs is , the average velocity uncertainty is km s-1, and the galaxy is rotating with , the recovered dispersion and rotation coincide with the input values within the error bars. This suggests that VLSBD could be rotating along its major axis, however, due to our sample consisting only of 12 GC satellites, more data are needed to confirm this result.
3.3. Total Mass and Dark Matter Content
We derive the total mass of the UDGs using the estimator for dynamically hot systems in equilibrium by Wolf et al. (2010):
| (4) |
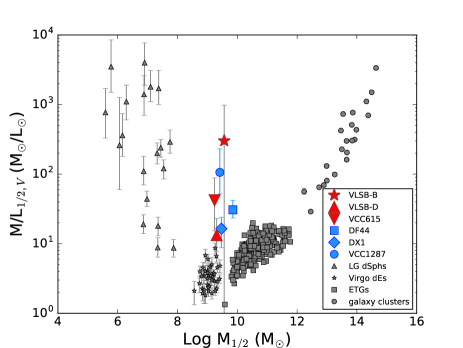
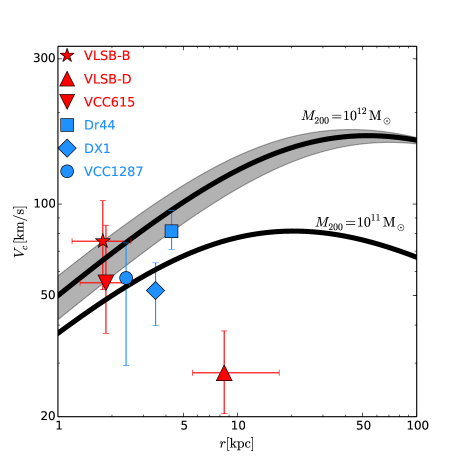
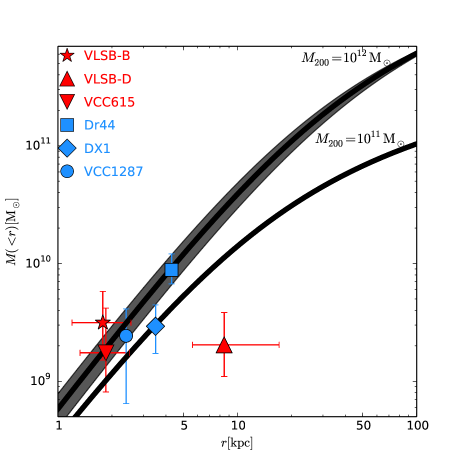
is the velocity dispersion measured from Equation 1, and is the radius that contains half the population of the dynamical tracers. In this case, it is the radius that contains half the number of the GCs (see Table 1). The diffuse nature of the UDGs makes it challenging to decide where the GC population ends, as a result is very uncertain and it is usually assumed that (e.g., Beasley et al., 2016). Using NGVS images, we use MCMC to fit the GC number density profile with a Sersic function with index assuming circular GC distribution. We obtain arcmin for VCC1287, which is (assuming ). Estimating using results in a slightly larger stellar mass and mass-to-light ratio than that obtained by Beasley et al. (2016), M⊙ and . For our UDGs, (see Table 1), although they are consistent within the uncertainties. We use in our calculations, but if we used instead, the derived would be larger.
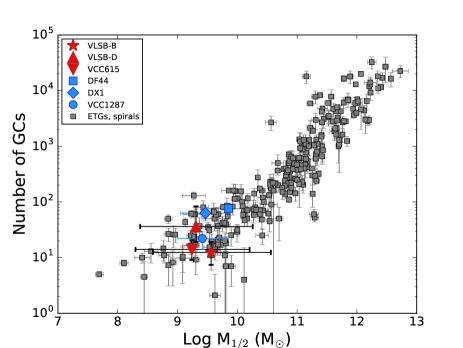
The total masses found for the three UDGs are much higher than the expected values for their stellar masses (see Figure 4). However, their are consistent with the number expected for galaxies with that , although VLSBB appears to be on the low side of the relation.
We estimate the fraction of dark matter within the assuming that these galaxies do not have gas. We use to estimate the total stellar mass (Taylor et al., 2011) and assume that within the the stellar mass is half, although , which makes the stellar mass within the less than half. The results suggest these UDGs are heavily dark matter dominated (see Table 1).
4. Discussion and Conclusions
We spectroscopically confirm 4 GC satellites in VLSBB, 12 in VLSBD, and 7 in VCC615. We use them to measure and of the three UDGs and confirm their dynamical association with the Virgo cluster. We estimate their total within the and find that these galaxies have extremely large values for their stellar mass. Assuming that they follow an NFW profile (Navarro et al., 1997) where the stellar mass is negligible as suggested by their high , we find that VLSBB and VCC615 very likely have dark matter halos of M⊙ (Figure 5). These are typical values for galaxies that have stellar masses two orders of magnitude higher than that of these UDGs.
The interpretation of the dark matter halo of VLSBD is uncertain given that it may not be in equilibrium. The tidal features, the spatially and dynamically off-center nucleus, and the velocity gradient suggest that VLSBD is being tidally stripped as it orbits through Virgo. VLSBD could have recently interacted with M84, given their similar (1017 km s-1, Cappellari et al., 2011), and the fact that VLSBD’s tidal tails align along the direction of M84.
VLSBB and VCC615 show smooth and round stellar distributions (Mihos et al., 2015). If they are in dynamical equilibrium, these could be within the most dark matter dominated galaxies known, only comparable to other UDGs and Local Group dSphs. However, more GCs should be observed to confirm the estimated . Such high (Figure 4) can only be explained with massive halos and relatively high concentrations, at least for VLSBB (Figure 5), which might suggest an early collapse and early infall into the cluster (Navarro et al., 1997). This scenario suggests that VLSBB and VCC615 could be “failed” galaxies that formed less stars than expected for their likely massive dark matter halos. This could be due to an extremely low star formation efficiency or an abrupt truncation of their star formation due to the early interaction with the hot intracluster medium.
Our data suggests a structurally and dynamically diverse population of galaxies, where round and extremely low surface brightness galaxies could be rapidly rotating. It is important to statistically quantify the significance of such rotation not only in VLSBB but also in other UDGs by increasing the number of GCs observed and the number of UDGs studied dynamically.
References
- Amorisco & Loeb (2016) Amorisco, N. C. & Loeb, A. 2016, MNRAS, 459, L51
- Amorisco et al. (2016) Amorisco, N. C., Monachesi, A., & White, S. D. M. 2016, ArXiv e-prints
- Beasley et al. (2016) Beasley, M. A., Romanowsky, A. J., Pota, V., et al. 2016, ApJ, 819, L20
- Binggeli et al. (1987) Binggeli, B., Tammann, G. A., & Sandage, A. 1987, AJ, 94, 251
- Blakeslee et al. (2009) Blakeslee, J. P., Jordán, A., Mei, S., et al. 2009, ApJ, 694, 556
- Boselli et al. (2014) Boselli, A., Voyer, E., Boissier, S., et al. 2014, A&A, 570, A69
- Caldwell (2006) Caldwell, N. 2006, ApJ, 651, 822
- Cappellari & Emsellem (2004) Cappellari, M. & Emsellem, E. 2004, PASP, 116, 138
- Cappellari et al. (2011) Cappellari, M., Emsellem, E., Krajnović, D., et al. 2011, MNRAS, 413, 813
- Cappellari et al. (2013) Cappellari, M., McDermid, R. M., Alatalo, K., et al. 2013, MNRAS, 432, 1862
- Cooper et al. (2012) Cooper, M. C., Newman, J. A., Davis, M., Finkbeiner, D. P., & Gerke, B. F. 2012, spec2d: DEEP2 DEIMOS Spectral Pipeline, astrophysics Source Code Library, ascl:1203.003
- Dalcanton et al. (1997) Dalcanton, J. J., Spergel, D. N., Gunn, J. E., Schmidt, M., & Schneider, D. P. 1997, AJ, 114, 635
- Di Cintio et al. (2017) Di Cintio, A., Brook, C. B., Dutton, A. A., et al. 2017, MNRAS, 466, L1
- Dutton & Macciò (2014) Dutton, A. A. & Macciò, A. V. 2014, MNRAS, 441, 3359
- Faber et al. (2003) Faber, S. M., Phillips, A. C., Kibrick, R. I., et al. 2003, in Proc. SPIE, Vol. 4841, Instrument Design and Performance for Optical/Infrared Ground-based Telescopes, ed. M. Iye & A. F. M. Moorwood, 1657–1669
- Ferrarese et al. (2012) Ferrarese, L., Côté, P., Cuillandre, J.-C., et al. 2012, ApJS, 200, 4
- Foreman-Mackey et al. (2013) Foreman-Mackey, D., Hogg, D. W., Lang, D., & Goodman, J. 2013, PASP, 125, 306
- Geha et al. (2003) Geha, M., Guhathakurta, P., & van der Marel, R. P. 2003, AJ, 126, 1794
- Gilbert et al. (2014) Gilbert, K. M., Kalirai, J. S., Guhathakurta, P., et al. 2014, ApJ, 796, 76
- Harris et al. (2013) Harris, W. E., Harris, G. L. H., & Alessi, M. 2013, ApJ, 772, 82
- Impey et al. (1988) Impey, C., Bothun, G., & Malin, D. 1988, ApJ, 330, 634
- Janssens et al. (2017) Janssens, S., Abraham, R., Brodie, J., et al. 2017, ApJ, 839, L17
- Jordán et al. (2009) Jordán, A., Peng, E. W., Blakeslee, J. P., et al. 2009, ApJS, 180, 54
- Kirby et al. (2015a) Kirby, E. N., Guo, M., Zhang, A. J., et al. 2015a, ApJ, 801, 125
- Kirby et al. (2015b) Kirby, E. N., Simon, J. D., & Cohen, J. G. 2015b, ApJ, 810, 56
- Koda et al. (2015) Koda, J., Yagi, M., Yamanoi, H., & Komiyama, Y. 2015, ApJ, 807, L2
- Martin & Jin (2010) Martin, N. F. & Jin, S. 2010, ApJ, 721, 1333
- Martínez-Delgado et al. (2016) Martínez-Delgado, D., Läsker, R., Sharina, M., et al. 2016, AJ, 151, 96
- Mei et al. (2007) Mei, S., Blakeslee, J. P., Côté, P., et al. 2007, ApJ, 655, 144
- Mihos et al. (2015) Mihos, J. C., Durrell, P. R., Ferrarese, L., et al. 2015, ApJ, 809, L21
- Mihos et al. (2017) Mihos, J. C., Harding, P., Feldmeier, J. J., et al. 2017, ApJ, 834, 16
- Moore et al. (1996) Moore, B., Katz, N., Lake, G., Dressler, A., & Oemler, A. 1996, Nature, 379, 613
- Muñoz et al. (2015) Muñoz, R. P., Eigenthaler, P., Puzia, T. H., et al. 2015, ApJ, 813, L15
- Muñoz et al. (2014) Muñoz, R. P., Puzia, T. H., Lançon, A., et al. 2014, ApJS, 210, 4
- Navarro et al. (1997) Navarro, J. F., Frenk, C. S., & White, S. D. M. 1997, ApJ, 490, 493
- Newman et al. (2013) Newman, J. A., Cooper, M. C., Davis, M., et al. 2013, ApJS, 208, 5
- Peng et al. (2006) Peng, E. W., Jordán, A., Côté, P., et al. 2006, ApJ, 639, 95
- Powalka et al. (2016) Powalka, M., Lançon, A., Puzia, T. H., et al. 2016, ApJS, 227, 12
- Román & Trujillo (2017) Román, J. & Trujillo, I. 2017, MNRAS, 468, 703
- Sandage & Binggeli (1984) Sandage, A. & Binggeli, B. 1984, AJ, 89, 919
- Taylor et al. (2011) Taylor, E. N., Hopkins, A. M., Baldry, I. K., et al. 2011, MNRAS, 418, 1587
- Toloba et al. (2014) Toloba, E., Guhathakurta, P., Peletier, R. F., et al. 2014, ApJS, 215, 17
- Toloba et al. (2016a) Toloba, E., Li, B., Guhathakurta, P., et al. 2016a, ApJ, 822, 51
- Toloba et al. (2016b) Toloba, E., Sand, D. J., Spekkens, K., et al. 2016b, ApJ, 816, L5
- van der Burg et al. (2016) van der Burg, R. F. J., Muzzin, A., & Hoekstra, H. 2016, A&A, 590, A20
- van Dokkum et al. (2016) van Dokkum, P., Abraham, R., Brodie, J., et al. 2016, ApJ, 828, L6
- van Dokkum et al. (2017) van Dokkum, P., Abraham, R., Romanowsky, A. J., et al. 2017, ApJ, 844, L11
- van Dokkum et al. (2015) van Dokkum, P. G., Abraham, R., Merritt, A., et al. 2015, ApJ, 798, L45
- Venhola et al. (2017) Venhola, A., Peletier, R., Laurikainen, E., et al. 2017, A&A, 608, A142
- Wolf et al. (2010) Wolf, J., Martinez, G. D., Bullock, J. S., et al. 2010, MNRAS, 406, 1220
- Zaritsky et al. (2006) Zaritsky, D., Gonzalez, A. H., & Zabludoff, A. I. 2006, ApJ, 638, 725