How Developers Iterate on Machine Learning Workflows
Abstract.
Machine learning workflow development is anecdotally regarded to be an iterative process of trial-and-error with humans-in-the-loop. However, we are not aware of statistics-based evidence corroborating this popular belief. A statistical characterization of iteration can serve as a benchmark for machine learning workflow development in practice, and can aid the development of human-in-the-loop machine learning systems. To this end, we conduct a small-scale survey of the applied machine learning literature from five distinct application domains. We use statistics collected from the papers to estimate the role of iteration within machine learning workflow development, and report preliminary trends and insights from our investigation, as a starting point towards this benchmark. Based on our findings, we finally describe desiderata for effective and versatile human-in-the-loop machine learning systems that can cater to users in diverse domains.
1. Introduction
Development of machine learning (ML) applications is governed by an iterative process: starting with an initial workflow, developers iteratively modify their workflow, based on previous results, to improve performance. They may add or modify data sources, features, hyperparameters, and training algorithms, among others. These iterations of trial-and-error are necessary due to data variability, algorithmic complexity, and overall unpredictability of ML. A detailed, statistical characterization of how developers iteratively modify ML workflows can serve as a benchmark for human-in-the-loop ML systems. At present, due to the lack of such studies, we are forced to resort to anecdotal evidence to identify usage patterns and motivate design decisions.
To this end, we conduct a statistical study of iteration by surveying the applied ML literature across five application domains. The statistics collected in this study provide the first quantitative evidence of how developers iterate on ML workflows, beyond anecdotal ones. Moreover, the insights and trends discovered from our survey provide concrete guidelines on desired human-in-the-loop ML system properties, while the models and statistics provide a starting point for the development of benchmarks for standardized and automatic evaluation of human-in-the-loop ML systems.
Statistical studies of end-to-end ML workflow development pose several challenges. First, it is difficult to gather data that captures the entire process, and not just the final snapshot. One approach, for example, may involve examining code repositories over time to determine what has changed—one downside of this approach is that developers may not commit intermediate iterations, leading to less transparency for the overall process. Moreover, this approach will require understanding code, and mapping code fragments to classes of iterative modifications, both of which are extremely challenging to do. Second, we need to ensure that our study captures a diverse set of application domains. Surveys (King and Magoulas, 2016; kag, 2017; mit, 2017; Munson, 2012) often end up focusing on industry-relevant application areas (e-commerce, recommendations), and data-types (language, vision). Since our eventual goal is to develop a benchmark for general-purpose human-in-the-loop ML systems, this limited view may hinder our ability to adequately support all application domains. Third, once the data is collected, we need to devise methods to analyze the data and collect statistics related to iteration. Finally, we need to turn the raw statistics into models that capture iteration and relate trends and insights discovered from these models to ML system design.
Our study includes an analysis of 105 applied machine learning papers sampled from multiple conferences in 2016 and across five application domains, including social sciences, natural sciences, web application, computer vision, and natural language processing. We collect statistics from each paper that capture iterative development and use these statistics to infer common practices in each application domain surveyed. We describe the statistics collected, how they are used to estimate iteration counts, and discuss the limitations of our approach in the next section. To ensure the quality of our statistics, we take consensus over results collected by multiple surveyors, and open-source the final aggregated data for further studies by interested readers, as well as development of formal benchmarks. We conduct data analysis on our survey results to highlight key insights unearthed by our survey and propose system requirements suggested by our analysis.
Related Work. To the best of our knowledge, our survey is the first effort in conducting a statistical study of machine learning model development from empirical evidence. However, the pursuit of understanding iterative ML development is not singularly ours. Several surveys have been conducted in recent years to profile industry and academic ML users (King and Magoulas, 2016; kag, 2017; mit, 2017; Munson, 2012). These surveys differ from ours in that they were self-reported responses from a select set of industry and academic users. Findings from self-reporting surveys are known to suffer from response bias (Nederhof, 1985). Many articles discuss general trends and design patterns in ML workflows (Domingos, 2012; Jordan and Mitchell, 2015; roy, 2017), while a number of articles focus on providing guidance and taxonomies for novice users to perform iteration better (Zinkevich, 2017; Qiu et al., 2016; Sapp, 2017). Other works such as (Abdul et al., 2018) and (Liu et al., 2014) study general trends and needs in data science using NLP techniques to study a large corpus en masse. Vartak et al. (Vartak et al., 2015) describe a system-building vision for iterative human-in-the-loop ML. Kery et al. (Kery et al., 2017) specifically study the versioning aspect of iterative development, whereas Koesten et al. (Koesten et al., 2017) analyze in-depth surveys to understand the typical workflow for data scientists.
The rest of paper is organized as follows: In Section 2, we describe the data, the statistics collected from the data, and the methods to study iteration using the statistics. In Section 3, we report interesting results and insights discovered from our survey and propose concrete system requirements to support human-in-the-loop ML based on the survey analysis.
2. Data & Methodology
In this section we describe the dataset and the methods used to collect the statistics that enable analyses of iteration in publications.
2.1. Corpus
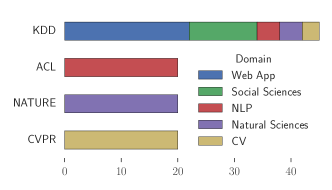
We surveyed 105 papers published in 2016 on applied data science. To ensure relevance, we selected four venues that specifically publish applied machine learning studies: KDD Applied Data Science Track, Association for Computational Linguistics (ACL), Computer Vision and Pattern Recognition (CVPR), and Nature Biotechnology (NB). We randomly sample 20 papers from ACL, CVPR, and NB each, and 45 papers from KDD. These papers span applications in social sciences (SocS), web applications (WWW), natural sciences (NS), natural language processing (NLP), and computer vision (CV). Paper topics were determined using the ACM Computing Classification System (CCS) 111https://www.acm.org/publications/class-2012. Keywords in each paper are matched with entries in the CCS tree, and each paper is assigned as its domain the most appropriate high level entry containing its keywords. Figure 1 illustrates the domain composition of the conferences surveyed. While ACL, CVPR, and Nature specialize in a single domain, KDD embraces many domains, with a focus on web applications and social science.
Limitations. Our approach is limited in its ability to accurately model iterations due to several characteristics of the corpus:
-
1)
While the corpus spans multiple domains, the number of paper in each domain is small, which can lead to spurious trends.
-
2)
Papers provide an incomplete picture of the overall iterative process. Machine learning papers are results-driven and focus more on modeling than data pre-processing by convention. Due to space constraints, authors often omit a large number of iterative steps and report only on the small subset that led to the final results.
-
3)
Papers often present results side by side instead of the order they were obtained, making it difficult to determine the exact transitions between the variants studied in the iterative process.
We attempt to overcome some of these limitations by
2.2. Brief Overview of ML Workflows
ML workflows commonly consist of three major components:
Data Pre-processing (DPR). This stage contains all the data manipulation operations, such as data cleaning and feature extraction, used to turn raw data into a format compatible with ML algorithms.
Learning/Inference (L/I). Once the data is transformed into a learnable representation, such as feature vectors, learning takes place, using the transformed data to derive an ML model via optimization. Inference refers to the processing by which the learned model is used to make predictions on unseen data, and is often performed after learning.
Post Processing (PPR). Post processing is the all-encompassing term for operations following learning and inference. Bruha et al. (Bruha and Famili, 2000) classifies PPR operations in to four categories: 1) rule-based knowledge filtering, 2) and knowledge integration, 3) interpretation and explanation, 4) evaluation. While 1) and 2) involve transformations of the L/I output, 3) and 4) are about the analysis of the L/I output. Mentions of 1) and 2) are sparse in our corpus and thus excluded from our study.
In the context of ML application development, an iteration involves creating a version of the workflow, either from scratch or by copying/modifying a previous version, and executing this version end to end to obtain some results. Program termination marks the end of an iteration, and any results that are not written to disk during execution can only be obtained by modifying the workflow to explicitly save the results and rerunning the workflow.
2.3. Statistics Collection
Our goal in this survey is to collect statistics on how users iterate on ML workflows. However, iterations are often not explicitly reported in publications. To overcome this challenge, we design a set of statistics that allow us to infer the iterative process leading to the results reported in each paper. We introduce the statistics for each individual component of the ML workflow below.
DPR. As mentioned above, DPR encompasses all operations involved in transforming raw data into learnable representations, such as feature engineering, data cleaning, and feature value normalization. We record , the set of distinct DPR operation types found in each paper and collect . Mentions of DPR operations are usually found in the data and methods sections in the paper.
L/I. Workflow modifications concerning L/I fall into one of three categories: 1) hyperparameter tuning for a model (e.g., increasing learning rate, changing the architecture of a neural net) and 2) switching between model classes (e.g., from decision tree to SVM). For each paper, we record , the set of all model classes and , the set of distinct hyperparameters tuned across all model classes, and collect and . Evidence for these statistics is usually found in the algorithms section, as well as result tables and figures.
PPR. Of the four types of PPR operations enumerated above, evaluation and interpretation/explanation are the most commonly reported in papers, often presented in tables or figures. For each paper, we record , the set of evaluation metrics used, and collect . In addition, we collect and , the number of tables and figures containing results and case studies, respectively.
We refer to collectively as entity sets in the rest of the paper 222The complete entity sets and statistics can be found at https://github.com/gestalt-ml/AppliedMLSurvey/blob/master/data/combinedCounts.tsv.
To ensure the quality of the statistics collected, we had three graduate students in data mining, henceforth referred to as surveyors, perform the survey independently on the same corpus. We reference the results collected by each surveyor with a subscript, e.g., is the set of model classes recorded by surveyor 1. To increase the likelihood of consensus, we first had the surveyors discuss and agree on a seed set for each entity set, e.g., {Accuracy, RMSE, NDCG}. Surveyors were then asked to remove from and add to this set as they see fit for each paper. Let be the aggregated value of the statistic . We aggregate the three sets of results as follows:
-
For an entity set (e.g., , the set of model classes), let . We filter to obtain such that is identified by at least two surveyors. That is, a paper is considered to contain an operation only if it is identified to be in the paper by at least two surveyors independently. We define for the corresponding statistic as .
-
For and , we define to be the average of the values obtained by the three surveyors.
2.4. Estimating Iterations using Statistics
The information collected above indicate versions of the workflow studied but not the iterative modifications themselves. To infer the number of iterations using the statistics collected above, we make the following assumptions:
-
Each iteration involves a single change. While it is possible for multiple changes to be tested in a single iteration, it is unlikely the case since the interactions can obfuscate the contribution of individual changes.
-
Each element in an entity set is tested exactly once. For the authors to report on a variant, there must have been at least one version of the workflow containing that variant. Although it is likely for a variant to be revisited in multiple iterations in the actual research process, papers, by convention, provide little information on this aspect. Due to this lack of evidence, we take the conservative approach by taking the minimum value.
Let be the number of iterations containing changes to the DPR, L/I, and PPR components of the workflow, respectively. Using the two assumptions above, we estimate , and as follows:
For , we assume that the authors start with the raw data and incrementally add more data pre-processing operations in each iteration. We subtract one from and in to account for the fact that the initial version of the workflow must contain a model, a set of hyperparameters, and an optimization algorithm. The estimator assumes that in a PPR iteration, the authors can either gather all information on a single metric or generate an entire figure/table.
3. Results and Insights
In this section we share interesting trends about ML workflow development discovered from our survey.
3.1. Iteration Count
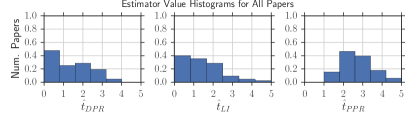
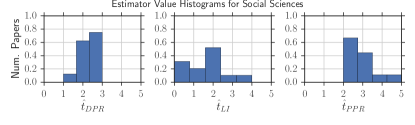
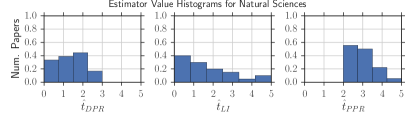
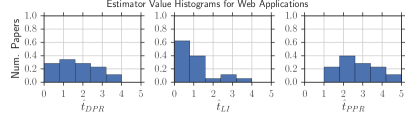
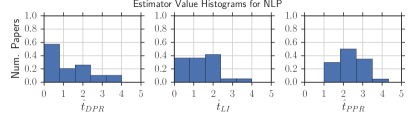
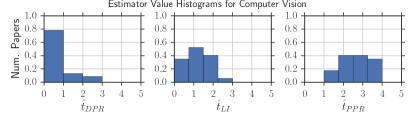
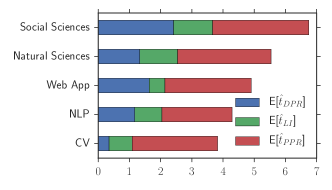
Figure 2 shows the histograms for the three iteration estimators across the entire corpus (top row) and by domain (rows 2-6). A bin in every histogram represents an integral value for the estimators, and bin heights equal the fraction of papers with the bin value as their estimates. The mean values for the estimators by domains are shown in the stacked bar chart in Figure 3, where the total bar length is equal to the average number of iterations in each domain. From these two figures, we see that 1) most papers use evaluation methods, evident from the fact that histograms in the third column in Figure 2 are skewed towards ; 2) PPR is the most common iteration type across all domains, evident from the length of the E[] bars in Figure 3; and 3) on average, more DPR iterations are reported than L/I iterations in every domain except computer vision, as illustrated by the relative lengths of the E[] and E[] bars in Figure 3.
When grouped by domains, we see that the distributions for certain domains deviate a great deal from the overall trends in Figure 2. Domains dominated by deep neural nets (DNNs), which are designed to replace manual feature engineering for higher order features, tend to skew towards fewer DPR and more L/I iterations, such as NLP and CV. Additionally, there are only a few highly processed datasets studied in all NLP and CV papers, further reducing the need for data pre-processing in these domains. On the other hand, social and natural sciences exhibit the opposite trend in the histograms in Figure 2, biasing towards more DPR iterations. This is largely due to the fact that both domains rely heavily on domain knowledge to guide ML and strongly prefer explainable models. In addition, a large amount of data is required to enable training of DNNs. The scale of data is often much smaller for SocS and NS than NLP and CV, thus preventing effective application of DNNs and requiring more manual features.
3.2. Data Pre-processing by Domain
| SocS | NS | WWW | NLP | CV |
| Join () | Feature def. () | Feature def. () | Feature def. () | Feature def. () |
| Feature def. () | Univar. FS () | Join () | BOW () | BOW () |
| Normalize () | Normalize () | Normalize () | Join () | Interaction () |
| Impute () | PCA () | Discretize () | Normalize () | Join () |
Table 1 shows the most popular DPR operations in each application domain, ordered top to bottom by popularity, with abbreviations expanded in the caption. While the table reaffirms common knowledge such as feature normalization is important, Table 1 also shows two striking results: 1) joining multiple data sources is common in four of the five domains surveyed; 2) of the papers contain fine-grained features defined using domain knowledge across all domains. Result 1) suggest that unlike classroom and data competition settings in which the input data resides conveniently in a single file, data in real-world ML applications is aggregated from multiple sources (e.g., user database and event logs). Result 2) contradicts the common belief that ML applications have collectively progressed beyond handcrafted features thanks to the advent of deep learning (DL). In addition to the incompatibilities with DL in some domains mentioned in Section 3.1, the efficacy of features designed using domain knowledge versus using DL to search for the same features without domain knowledge is possibly another contributing factor.
3.3. Learning/Inference by Domain
| SocS | NS | WWW | NLP | CV |
| GLM () | SVM () | GLM () | RNN () | CNN () |
| SVM () | GLM () | RF () | GLM () | SVM () |
| RF () | RF () | SVM () | SVM () | RNN () |
| Decision Tree () | DNN () | Matrix Factorization () | CNN () | RF () |
Table 2 lists the most popular model classes for each application domain, with abbreviations expanded in the caption. We have already discussed the disparity between the popularity of DL in CV/NLP and other domains in Section 3.1. Most traditional approaches such as GLM, SVM, and Random Forest are still in favor with most domains, since the large additional computation cost for DL often fails to justify the incremental model performance gain. Matrix factorization, which is highly amenable to parallelization, is popular in web applications for supporting recommendation engines. Interestingly, SVM is the most popular method in natural sciences by a large margin (100% more popular than the second most popular option), possibly due to its ability to support higher order functions through kernels. NS applications experimenting with DL are mostly computer vision related.
| SocS | NS | WWW | NLP | CV |
| Regularize () | CV () | Regularize () | LR () | LR () |
| CV () | LR () | LR () | Batch size () | Batch size () |
| LR () | DNN arch. () | Batch size () | DNN arch. () | DNN arch. () |
| Batch size () | Kernel () | CV () | Kernel () | Regularize () |
Table 3 shows the most popular model tuning operations by domains. The top two operations, learning rate and batch size, are both concerned with the training convergence rate, suggesting that training time is an important factor in all domains. Cross validation and regularization are both mechanisms to control model complexity and overfitting to observed data. Lower complexity models usually result in faster inference time and better ability to generalize to more unseen data.
3.4. Post Processing by Domain
| SocS | NS | WWW | NLP | CV |
| P/R () | Acc. () | Acc. () | P/R () | Vis. () |
| Acc. () | P/R () | P/R () | Acc. () | Acc. () |
| Feat. Contrib. () | Vis. () | Case () | Case () | P/R () |
| Vis. () | Correlation () | DCG () | Human Eval. () | Case () |
Of the evaluation methods listed in Table 4, P/R, accuracy, correlation, and DCG are summary evaluations of model performance while case study, feature contribution, human evaluation, and visualization are fine-grained methods towards insights to improve upon the current model. While the former group can be used automatically such as in grid search, the latter group is aimed purely for human understanding.
3.5. System Desiderata
The results in Section 3 suggest a number of properties that a versatile and effective human-in-the-loop ML system should possess:
-
Iteration. Developers iterate on their workflows in every application domain and test out changes to all components of the workflow. Understanding the most frequent changes helps us develop systems that anticipate and respond rapidly to iterative changes.
-
Fine-grained feature engineering. Handcrafted features designed using domain knowledge is still an indispensable part of the workflow development systems in all domains and should therefore be adequately supported instead of dismissed as an outdated practice.
-
Efficient joins. Data is often pooled from multiple sources, thus requiring systems to support efficient joins in the data pre-processing component.
-
Explainable models. Many domains have yet to embrace deep learning due to their needs for explainable models. The system should provide ample support to help developer interpret model behaviors.
-
Fast model training. The fact that the most tuned model parameters are related to training time suggests that developers are in need of systems that have fast model training, but also low latency for the end-to-end workflow execution in general.
-
Fine-grained results analysis. Fine-grained and summary evaluation methods are equally popular across all domains. Thus, model management systems should provide support for not only summary metrics but also more detailed model characteristics.
We are in the process of developing a system, titled Helix (Xin et al., 2018), that is aimed at accelerating iterations in human-in-the-loop ML workflow development, using many of the properties listed above as guiding principles.
4. Conclusion and Future Work
We conduct a statistical study on the iterative development process for ML applications in multiple domains. Our approach involves collecting carefully designed statistics from applied machine learning literature in order to reconstruct the iterative process that led to the results reported. We present our survey findings across domains and discuss desired ML system properties as suggested by the trends discovered from our survey data. The statistics and estimators described in our work can be further developed into a benchmark for systems specifically designed to address human-in-the-loop ML needs.
References
- (1)
- mit (2017) 2017. Machine Learning: The New Proving Ground for Competitive Advantage. (2017). https://s3.amazonaws.com/files.technologyreview.com/whitepapers/MITTR_GoogleforWork_Survey.pdf
- roy (2017) 2017. Machine learning: the power and promise of computers that learn by example. (2017). https://royalsociety.org/~/media/policy/projects/machine-learning/publications/machine-learning-report.pdf
- kag (2017) 2017. The State of Data Science and Machine Learning. (2017). https://www.kaggle.com/surveys/2017
- Abdul et al. (2018) Ashraf Abdul, Jo Vermeulen, Danding Wang, Brian Y Lim, and Mohan Kankanhalli. 2018. Trends and Trajectories for Explainable, Accountable and Intelligible Systems: An HCI Research Agenda. In Proceedings of the 2018 CHI Conference on Human Factors in Computing Systems. ACM, 582.
- Bruha and Famili (2000) Ivan Bruha and A Famili. 2000. Postprocessing in machine learning and data mining. ACM SIGKDD Explorations Newsletter 2, 2, 110–114.
- Domingos (2012) Pedro Domingos. 2012. A few useful things to know about machine learning. Commun. ACM 55, 10 (2012), 78–87.
- Jordan and Mitchell (2015) M. I. Jordan and T. M. Mitchell. 2015. Machine learning: Trends, perspectives, and prospects. Science 349 (2015), 255–260. http://science.sciencemag.org/content/349/6245/255
- Kery et al. (2017) Mary Beth Kery, Amber Horvath, and Brad Myers. 2017. Variolite: Supporting Exploratory Programming by Data Scientists. In Proceedings of the 2017 CHI Conference on Human Factors in Computing Systems. ACM, 1265–1276.
- King and Magoulas (2016) John King and Roger Magoulas. 2016. Data science salary survey: tools, trends, what pays (and what doesn’t) for data professionals. (2016).
- Koesten et al. (2017) Laura M Koesten, Emilia Kacprzak, Jenifer FA Tennison, and Elena Simperl. 2017. The Trials and Tribulations of Working with Structured Data:-a Study on Information Seeking Behaviour. In Proceedings of the 2017 CHI Conference on Human Factors in Computing Systems. ACM, 1277–1289.
- Liu et al. (2014) Yong Liu, Jorge Goncalves, Denzil Ferreira, Bei Xiao, Simo Hosio, and Vassilis Kostakos. 2014. CHI 1994-2013: mapping two decades of intellectual progress through co-word analysis. In proceedings of the SIGCHI conference on human factors in computing systems. ACM, 3553–3562.
- Munson (2012) M Arthur Munson. 2012. A study on the importance of and time spent on different modeling steps. ACM SIGKDD Explorations Newsletter 13, 2 (2012), 65–71.
- Nederhof (1985) Anton J Nederhof. 1985. Methods of coping with social desirability bias: A review. European journal of social psychology 15, 3 (1985), 263–280.
- Qiu et al. (2016) Junfei Qiu, Qihui Wu, Guoru Ding, Yuhua Xu, and Shuo Feng. 2016. A survey of machine learning for big data processing. EURASIP Journal on Advances in Signal Processing 2016, 1 (2016), 67.
- Sapp (2017) Carlton E. Sapp. 2017. Preparing and Architecting for Machine Learning. (2017).
- Vartak et al. (2015) Manasi Vartak, Pablo Ortiz, Kathryn Siegel, Harihar Subramanyam, Samuel Madden, and Matei Zaharia. 2015. Supporting fast iteration in model building. In NIPS Workshop LearningSys.
- Xin et al. (2018) Doris Xin et al. 2018. Helix: Holistic Optimization for Accelerating Iterative Machine Learning. Technical Report http://data-people.cs.illinois.edu/helix-tr.pdf (2018).
- Zinkevich (2017) Martin Zinkevich. 2017. Rules of Machine Learning: Best Practices for ML Engineering. (2017).