Where are the most ancient stars in the Milky Way?
Abstract
The oldest stars in the Milky Way (MW) bear imprints of the Galaxy’s early assembly history. We use FIRE cosmological zoom-in simulations of three MW-mass disk galaxies to study the spatial distribution, chemistry, and kinematics of the oldest surviving stars () in MW-like galaxies. We predict the oldest stars to be less centrally concentrated at than stars formed at later times as a result of two processes. First, the majority of the oldest stars are not formed in situ but are accreted during hierarchical assembly. These ex situ stars are deposited on dispersion-supported, halo-like orbits but dominate over old stars formed in situ in the solar neighborhood, and in some simulations, even in the galactic center. Secondly, old stars formed in situ are driven outwards by bursty star formation and energetic feedback processes that create a time-varying gravitational potential at , similar to the process that creates dark matter cores and expands stellar orbits in bursty dwarf galaxies. The total fraction of stars that are ancient is more than an order of magnitude higher for sight lines away from the bulge and inner halo than for inward-looking sight lines. Although the task of identifying specific stars as ancient remains challenging, we anticipate that million-star spectral surveys and photometric surveys targeting metal-poor stars already include hundreds of stars formed before . We predict most of these targets to have higher metallicity () than the most extreme metal-poor stars.
keywords:
Galaxy: formation – Galaxy: evolution – Galaxy: stellar content1 Introduction
The oldest stars in the Milky Way are relics of star formation in the early Universe, providing a probe of physical processes that can otherwise be studied only at high redshift (e.g. Freeman & Bland-Hawthorn, 2002; Beers & Christlieb, 2005; Frebel & Norris, 2015). Determining the properties, phase-space distribution, and stellar yields of first- and second-generation stars is therefore a primary goal of near-field cosmology (e.g. Abel et al., 2000; Bromm & Larson, 2004; Karlsson et al., 2013; Frebel & Norris, 2015). Ongoing spectroscopic and photometric surveys of the Galaxy have already begun to identify large numbers of metal-poor stars suspected to be ancient (e.g. Beers et al., 1985; Christlieb, 2003; Helmi et al., 2003; Yong et al., 2013; García Pérez et al., 2013; Schlaufman & Casey, 2014; Casey & Schlaufman, 2015; Howes et al., 2015, 2016; Li et al., 2015; Minniti et al., 2016; Starkenburg et al., 2017b; Cescutti et al., 2017), and parallel efforts to measure precise atmospheric parameters, masses, ages, and detailed abundance patterns for large samples of these stars are underway (e.g. Rauer et al., 2014; Ricker et al., 2015; Li et al., 2015; Feltzing et al., 2017; Fernández-Alvar et al., 2017; Sharma et al., 2018).
Given the archaeological interest in identifying very old stars, there arise the questions of (a) where, in terms of both physical location and metallicity, ancient stars can most efficiently be found, and (b) how metallicity and age are correlated for old stars. Numerous studies have shown that the MW’s stellar halo and satellite galaxies retain a wealth of information about the Galaxy’s assembly history and earliest stellar populations (e.g. Bullock et al., 2001; Bullock & Johnston, 2005; Salvadori et al., 2007; Helmi, 2008; Kirby et al., 2008; Bovill & Ricotti, 2011; Brown et al., 2014; Magg et al., 2018; Beniamini et al., 2018). The observational fact that the stellar halo consists primarily of metal-poor stars broadly supports this notion. On the other hand, cold dark matter (CDM) simulations predict that the number density of old stars should be highest near the Galactic center, in the bulge and innermost stellar halo ( kpc; e.g. White & Springel 2000; Brook et al. 2007; Tumlinson 2010; Gao et al. 2010; Salvadori et al. 2010; Starkenburg et al. 2017a; Griffen et al. 2018. Due to efficient enrichment in regions of high SFR density at early times, ancient stars found in the inner Galaxy are predicted to be more metal-rich than those in the outer halo ( kpc).
The search for ancient and metal-poor stars has a long observational history.111For a full history, see Sandage (1986), and references therein. Metal-poor RR Lyrae stars were identified in the bulge and inner stellar halo nearly a century ago (Baade, 1946, 1951) and were subsequently associated with first- and/or second-generation stars (Walker & Terndrup, 1991; Soszyński et al., 2011; Minniti et al., 2016). The kinematics of metal-poor halo stars were used by Eggen et al. (1962) in an early attempt to constrain the Milky Way’s formation history. Wallerstein et al. (1963) proposed to use the abundance patterns of metal-poor halo giants to constraint Galactic chemical enrichment models.
More recently, the search for ancient stars has targeted ultra metal-poor (UMP) stars (; e.g., Keller et al. 2014; Aguado et al. 2018) and somewhat higher-metallicity stars () with -process enhancement. UMP stars are of particular interest because they are diagnostic of the yields of first-generation stars (Beers & Christlieb, 2005; Karlsson et al., 2013; Norris et al., 2013; Bessell et al., 2015); in some cases, their abundance patterns appear consistent with enrichment by a single supernova. However, they are quite rare: only a few dozen stars have been identified with (Frebel & Norris, 2015; Starkenburg et al., 2017a), making a statistical study of the population challenging. It also remains unclear whether UMP stars are unambiguously ancient, as many theoretical models predict them to continue forming in low-density environments until relatively late times (until ; White & Springel 2000; Brook et al. 2007; Tornatore et al. 2007; Trenti et al. 2009).
Metal-poor stars with enhanced -process elements and no detectable or weak -process enrichment are thought to have formed at an early time before the onset of the AGB phase (likely Myr after the formation of the first stars; Hill et al. 2002; Frebel & Norris 2015; Ji et al. 2016; Hansen et al. 2017; Ji & Frebel 2018). A few such stars have measured radioactive lifetimes that indicate that they are very old (Sneden et al., 1996; Cayrel et al., 2001; Frebel et al., 2007; Hill et al., 2017), albeit with systematic uncertainties. -process enhanced metal-poor stars have been identified in the bulge, in the stellar halo, and in Local Group dwarf galaxies.
| Name | |||||||
|---|---|---|---|---|---|---|---|
| m12i | 10.8 | 12.1 | 0.0009 | 0.0063 | 0.12 | 7070 | 35200 |
| m12f | 10.9 | 12.2 | 0.0029 | 0.0031 | 0.49 | 7070 | 35200 |
| m12m | 11.1 | 12.2 | 0.0011 | 0.0031 | 0.26 | 7070 | 35200 |
is the stellar mass within , where is the 3D stellar half-mass radius. is the total mass within , where is the radius within which the matter density is the mean matter density. and ar reported at . and are the fraction of stars within 10 kpc at that formed before and have , respectively. is the fraction of stars with that formed before . The last two columns show and , the average baryon and dark matter particle masses.
In this work, we study the oldest stars in simulated galaxies with the goals of making predictions for MW surveys and better understanding the origin of the oldest stars already being observed. We focus on three disk galaxies from the FIRE project222See the FIRE project website at http://fire.northwestern.edu with observable properties that are broadly consistent with the MW. We first present the properties of the oldest stars at and then trace the stars back to their formation sites, quantifying the effects of accretion stars formed ex situ and outward migration of stars formed in situ on the distribution of all old stars at .
Many previous theoretical works (e.g. Scannapieco et al., 2006; Salvadori et al., 2007, 2010; Tumlinson, 2010; Gao et al., 2010; Komiya et al., 2010; Ishiyama et al., 2016; Griffen et al., 2018) have predicted the spatial distribution of old stars in MW-like galaxies using simple analytic prescriptions for the formation sites of ancient stars combined with dark-matter-only simulations or Monte-Carlo merger trees based on Press-Schechter theory. These works have all predicted old stars to be centrally concentrated at because the earliest stellar generations are predicted to form in the highest density peaks, and these preferentially end up near the center of the primary halo by ; i.e, in the bulge. Some studies (Brook et al., 2007; Starkenburg et al., 2017a; Sharma et al., 2017) have also arrived at similar conclusions using cosmological hydrodynamics simulations including star formation and cooling.
In this work, we study the formation and subsequent evolution of ancient stars in cosmological zoom-in simulations that (a) self-consistently include the effects of baryonic feedback, (b) explicitly model a multiphase ISM, leading to bursty star formation at high redshift and in low-mass halos, and (c) produce realistic MW-like galaxies at . As we will show, baryonic feedback processes arising from bursty star formation have non-negligible effects on the late-time distribution of old stars. In particular, we find that feedback-driven fluctuations in the gravitational potential at high redshift drive old stars that are formed near the galactic center outward, into the outer bulge and inner stellar halo. This effect has not been captured by previous studies of ancient stars, which have either ignored the effects of baryons altogether or have adopted a simplified model of the ISM that suppresses the burstiness of star formation (see further discussion in Section 5).
The remainder of this paper is organized as follows. In Section 2, we introduce the FIRE simulations. In Section 3, we show the predicted spatial, chemical, and kinematic distributions of the oldest stars at . In Section 4, we wind back the clock and identify the formation sites for the oldest stars. In Section 5, we compare our results to earlier work. We summarize our findings in Section 6 and discuss prospects for identifying the surviving population of ancient stars in ongoing MW surveys. In Appendix A, we examine how sensitive our results are to changes in mass resolution and in the turbulent diffusion coefficient.
2 FIRE simulations
We study cosmological zoom-in simulations of three MW-mass galaxies from the FIRE project (Hopkins et al., 2014). The simulations were run with the GIZMO333A public version of the GIZMO code is available at http://www.tapir.caltech.edu/~phopkins/Site/GIZMO.html. hydrodynamics code (Hopkins, 2015) in the Lagrangian “meshless finite mass” (MFM) mode, using the FIRE-2 model for galaxy formation and feedback (Hopkins et al., 2017a). For details regarding the physical processes modeled in these simulations and their numerical implementation, we refer to Hopkins et al. (2017a) and Hopkins et al. (2017b).
The three halos we study were first presented by Wetzel et al. (2016) and Hopkins et al. (2017a). Their properties are summarized in Table 1. At , they host galaxies with structural parameters broadly similar to the MW. They have realistic stellar disks and bulge-to-disk ratios (El-Badry et al., 2018b; Garrison-Kimmel et al., 2017a), HI rotation curves and velocity dispersions (El-Badry et al., 2018a), satellite populations (Wetzel et al. 2016; Garrison-Kimmel et al., in prep.), and stellar halos (Bonaca et al., 2017; Sanderson et al., 2017).
Although the three simulated galaxies have similar gross structural properties at , we will show in Section 4 that their early assembly histories differ from one another substantially, as is common in CDM (Cooper et al., 2010). Given that we do not currently identify a clear reason to prefer one simulated MW-analog over another we view the three simulations as realizations of plausible assembly histories that could produce a MW-like galaxy at . Without firmer priors on the formation history of the MW, the scatter between the simulations sets a lower limit on the uncertainty of our predictions as applied to the real MW.
Due to significant uncertainties in the properties and formation process of zero-metallicity stars (see e.g. Bromm & Larson, 2004; McKee & Tan, 2008; Wise et al., 2012; Bromm, 2013), the FIRE model does not attempt to explicitly model Pop III stars. Instead, the abundances of all baryon particles in the simulation are set to a metallicity floor of in the initial conditions, where denotes the logarithmic abundance of individual metal species compared to their Solar value. The specific value of the metallicity floor is somewhat arbitrary; a floor is required to prevent numerical problems in cooling, and is similar to the typical value expected after enrichment by Pop III stars (Bromm & Yoshida, 2011; Bland-Hawthorn et al., 2015). Different metallicity floors have been used elsewhere in the literature (e.g. Starkenburg et al., 2017a), but systematic studies of the effects of varying the metallicity floor on the formation sites of ancient stars have yet to be carried out and represent a promising avenue for future work. The first generation of stars formed in the simulation quickly enrich the surrounding gas, so that most stars formed after are enriched to , a factor of 10 enhancement over the metallicity floor. The metallicity floor is therefore not expected to significantly bias the abundances of these stars; nevertheless, we caution against over-interpreting the abundances of the most metal-poor stars in the simulation .
The realizations of the simulations studied in this work, unlike the first realization presented in Wetzel et al. (2016), were run with the subgrid model for turbulent diffusion of metals described in Hopkins et al. (2017a), using a diffusion coefficient . Although the inclusion of turbulent metal diffusion has a negligible effect on galaxies’ overall structural properties, including total metallicity (Su et al., 2017; Hopkins et al., 2017a), it has been shown to improve metal mixing in the ISM and produce more realistic metallicity distribution functions, particularly preventing the unphysical formation of very low-metallicity stars at late times (Escala et al. 2018; Wetzel et al., in prep). We explore the model’s sensitivity to the choice of diffusion coefficient in Appendix A. There we show that our results are relatively insensitive to the choice of diffusion coefficient, though the properties of the most ancient stars () do vary somewhat with simulation resolution.
Each star particle in the simulation represents a simple stellar population with fixed abundances, uniform age, and a typical initial mass of 7070 M⊙. For a metal-poor, 13 Gyr-old stellar population with a Kroupa (2001) IMF, every 1000 M⊙ of stellar mass in old star particles represents roughly 15 giant and subgiant stars (each with ), which are the primary targets of spectroscopic surveys of the MW.444Because their ages are easier to constrain, the number of RR Lyrae stars is also potentially of interest. The frequency of RR Lyrae stars and its dependence on metallicity is poorly constrained, but a rough estimate based on measurements of globular clusters and nearby dwarf galaxies (Sherwood & Plaut, 1975; Harris, 1996; Baker & Willman, 2015) is 1 RR Lyrae star per in old ( Gyr) stellar mass; i.e., 1 ancient RR Lyrae for every 150 ancient giants and subgiants.
3 Old stars at late times
3.1 Spatial distribution
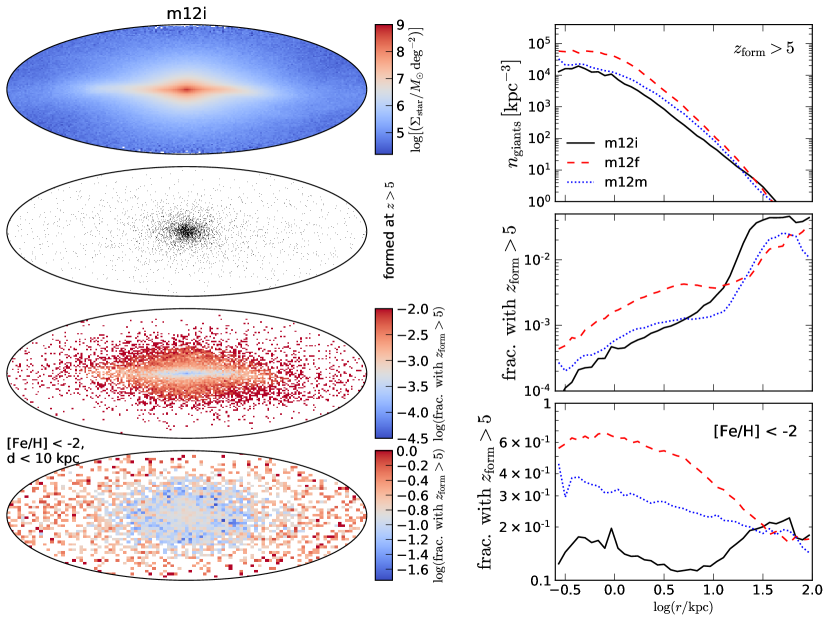
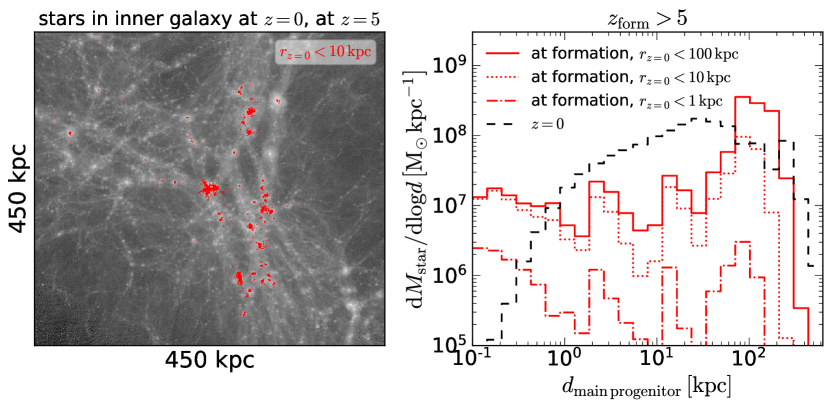
Figure 1 shows the spatial distribution and fractional contribution to the total stellar mass of old stars in our simulations. The left panels show projections of a single galaxy, m12i, as viewed by an observer in the solar circle; i.e, in the disk midplane, 8.2 kpc from the galaxy’s center. In the top three panels, we include all stars within a distance kpc of the galaxy’s center; in the bottom panel, we consider a survey centered on the solar neighborhood and extending to a distance of 10 kpc.
In the second left panel of Figure 1, we show the projected sky distribution for stars that were born before (1.2 Gyr after the Big Bang in our adopted cosmology), which we refer to as “old” or “ancient” stars.555We note that the cut of primarily yields stars younger than the oldest “population 2.9” stars sought by UMP star surveys, some of which may have formed as early as (Frebel & Norris, 2015); however, we find no significant differences between the spatial distribution and kinematics of the first stars formed in the simulation at and those forming at . Here we simply plot each old star particle as a single pixel, but we remind the reader that each particle represents an entire stellar population with initial mass 7000 M⊙, containing of order giant and subgiant stars. Consistent with expectations from previous work (e.g. White & Springel, 2000; Brook et al., 2007; Bland-Hawthorn & Peebles, 2006), this panel shows that the absolute number of old stars found in a particular line-of-sight is largest toward the dense inner regions of the galaxy. However, the total surface density of all stars – most of which formed at later times – is also highest toward the inner galaxy. The third panel on the left side of Figure 1 shows that as a result, the fraction of ancient stars increases substantially as a function of radius, particularly for sight lines out of the galactic plane.
In the bottom-left panel of Figure 1, we predict the returns of a bright magnitude-limited survey targeting metal-poor stars. We consider only star particles within 10 kpc of the solar neighborhood, which we place at an arbitrary azimuth on a circle of radius kpc in the disk midplane. 10 kpc corresponds roughly to the maximum distance at which an old, metal-poor giant can be detected by current MW spectroscopic surveys (e.g., GALAH or APOGEE, with magnitude limits of V14; De Silva et al. 2015; Majewski et al. 2017).666Our result are not sensitive to the distance limit of 10 kpc; increasing it slightly lowers the fraction of metal-poor stars that are ancient, as the outer halo contains more metal-poor stars formed at later times. We then show the fraction of all stars with along a given sight line that are old (). Considering only metal-poor777Unless otherwise stated, we use “metallicity” to refer specifically to [Fe/H]. For the Solar abundances, we adopt and (later in the text) from Asplund et al. (2009), where denote number densities. stars removes most of the substructure due to the bulge and disk seen in the upper panels, as most bulge and disk stars in the simulated galaxies formed later () and have higher metallicities (Ma et al., 2017). The bottom left panel shows that in m12i, the total fraction of stars that are ancient is lower toward the galactic center even when metal-rich stars are discarded. However, the opposite is true in m12f and m12m (bottom right panel).
In the right panels of Figure 1, we show the 3D absolute number density and fractional mass contribution of ancient stars for all three simulated galaxies. In the top panel, we approximate the number of red giant stars contributed by every old star particle; here we assume a Kroupa (2001) IMF and use the MIST isochrones (Choi et al., 2016) for old, metal poor stars that were used by El-Badry et al. (2017a). In the middle and bottom panels, we plot the fraction of all stellar mass (middle) and of star particles with (bottom) that are ancient. Two qualitative trends in the distribution of old stars are similar for the three simulations: their absolute number density is highest near the galactic center, while the fraction of all stars that are old is highest in the outer halo. In detail, there are nontrivial differences between the simulations. The total number of old stars is higher by a factor of 5 in m12f than in m12i; despite this, the fraction of stars in the outer halo that are old is higher in m12i. When only iron-poor star particles are considered, the fraction of stars that are ancient increases with radius in m12i and decreases in m12m and m12f. We explore these differences further in Section 4.
The absolute number of giants with predicted within 10 kpc of the solar neighborhood in the three simulations is (0.6, 2.3, and 1.2) for m12i, m12f, and m12m, respectively. For , the corresponding numbers are (1.8, 7.0, and 6.3) . We note that we have made no attempt to account for extinction, source confusion, or survey selection functions. Forthcoming mock catalogs for the three simulated galaxies studied here (Sanderson et al., in prep) will make it possible to do so.
3.2 Metallicity
Many ongoing searches for the oldest stars in the MW operate under the implicit assumption that the oldest stars are also the most metal-poor. We now investigate the relation between metallicity and age predicted by our simulations.
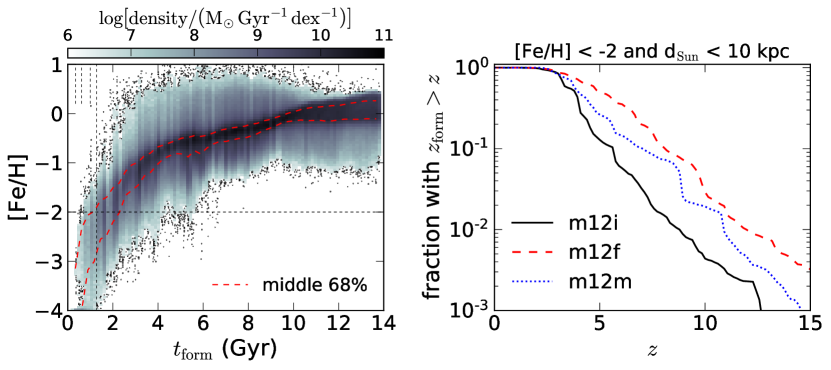
Figure 2 shows the age-[Fe/H] relation of stars that occupy the central 10 kpc of the m12i simulation at (see Lamberts et al. 2018 for the age-metallicity relation for all metals). Qualitatively, most ancient stars are metal-poor, and most metal-poor stars are old. However, it is also clear that particularly for old stars, the relationship between age and is not monotonic. For example, selecting stars with yields stars formed between and , and stars with have .
In the right panel of Figure 2, we show for all three simulations the fraction of metal-poor stars within 10 kpc of the solar neighborhood that formed before a given redshift. For all three simulated galaxies, the majority of stars with formed before ; the redshift at which half of nearby metal-poor stars had formed is , while the redshift at which 10% had formed is . Thus, we predict that selecting stars with in a survey of the inner Galaxy will yield stars with median formation redshifts of 5, with of order 10% forming before reionization.
The right panel of Figure 2 also highlights the nontrivial effects of the details of MW-like galaxies’ different early assembly histories on the age distributions of their oldest stars at : the fraction of metal-poor stars that formed before a particular redshift varies by a factor of 6 between the earliest (m12f) and latest (m12i) forming galaxies.
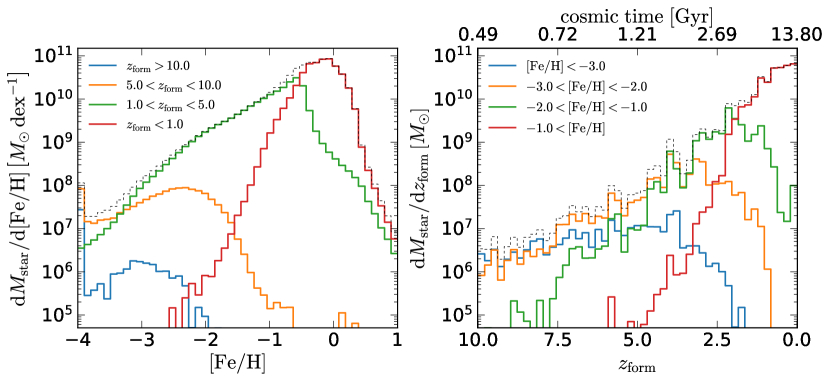
In Figure 3, we investigate the metallicity distributions of stars of different ages in more detail. The left panel shows the metallicity distribution for four different formation redshift intervals. Most stars formed before have , while most stars with have . The most common metallicity for stars in the latter interval is , but the distribution is quite broad. of stars with have . The vast majority of stars formed at late time are enriched to higher metallicities: essentially all stars formed after have .
Figure 3 also shows that nearly 70% of stars with (and 4% of those with ) have ; i.e., they formed from gas that had not been enriched above the metallicity floor at all. These metallicities clearly cannot be interpreted literally; fortunately, the majority of stars formed after are enriched above this level. The latest-forming star particles that are in the central 10 kpc at and have pristine abundances form at (m12i), (m12f) and (m12m).
The right panel shows the distribution of formation redshifts in bins of metallicity. Very low-metallicity stars with form over a broad range of redshifts, peaking at . There are roughly equal numbers of stars with metallicities above and below at . The more enriched population begins to dominate at later redshifts, outnumbering the extremely metal-poor population by a factor of 10 at and 100 at . Conversely, metal-rich stars are almost never ancient: only 0.1% of stars formed before have .
We do not show abundance distributions for elements other than iron, but we also find that all old stars that have been enriched above the metallicity floor exhibit enhanced abundance of elements (e.g., Mg and Si) relative to solar values. Star particles formed before typically have , while those forming after typically have . Enhancement in elements is a necessary but not sufficient condition for a star particle to be ancient in our simulations: typical values do not begin to drop until in all three simulations. Detailed abundance tracks for the simulated galaxies studied here will be presented in Wetzel et al., in prep.
3.3 Kinematics
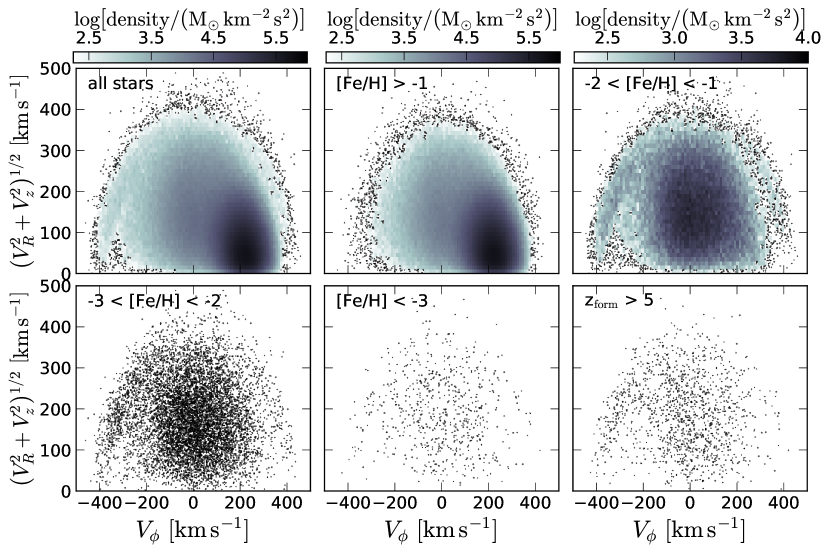
We now examine the kinematics of old stars in our simulated galaxies and compare to the kinematics of the populations formed at later times. Figure 4 shows Toomre diagrams for stars in m12i, separating all stars, stars in a range of decreasing metallicity bins, and the oldest stars. For consistency with work on the kinematics of stars in the MW solar neighborhood, we select stars in a cylindrical shell centered on kpc; however, our results do not depend sensitively on the region in which stars are selected. The Toomre diagram compares the azimuthal rotation velocity of stars () with the speed along axes perpendicular to the main rotational motion. We define the cylindrical coordinate system such that the axis is aligned with the net stellar angular momentum vector.
The upper left panel of Figure 4 shows all stars. Most stars are in the disk, rotating coherently with mean rotation velocity km s-1. There is also a non-rotating, dispersion-supported population centered on that contains percent of the total stellar mass for stars near the solar circle. Stars in this region of the Toomre diagram are typically referred to as having “halo-like” orbits. We refer to Bonaca et al. (2017) for further discussion of stellar kinematics in the solar neighborhood of this simulation and comparison to observations of the MW.
The upper middle panel shows only metal-rich stars, and the following three panels show stars in increasingly lower- bins. Most stars with are in the rotation-supported disk population, while most stars that are more metal-poor are found on dispersion-supported orbits. This occurs because the disk in our simulated galaxies forms at (Ma et al., 2017)888We note that the onset of disk formation is gradual, and its timing varies somewhat across our simulated galaxies (Garrison-Kimmel et al., 2017a). We remain agnostic of the precise age of the MW’s disk., when the mean iron abundance was (see Figure 2). Some substructure due to disrupted satellites can be seen in the Toomre diagrams for metal-poor stars, but there is little systematic difference between the kinematics of stars with and those with or . Similarly, selecting only old stars (; bottom right panel) yields dispersion-supported orbits indistinguishable from those of metal-poor stars formed at later times (before , after which most stars form in the disk). Having dispersion-supported kinematics is thus a necessary but not sufficient condition for a star in the simulated galaxies being ancient.
We find qualitatively similar results for the m12f and m12m simulations: the vast majority of the oldest stars are found on dispersion-supported orbits, but at fixed galactocentric radius, there is little difference between the kinematics of the oldest stars and stars formed at intermediate redshifts.
4 Where did the oldest stars form?
We have shown that the FIRE simulations predict the oldest stars in MW-like galaxies to be less centrally-concentrated than later-forming stars, extending from the galactic center into the outer halo (Figure 1, middle right panel). Previous works (e.g. El-Badry et al., 2016; Anglés-Alcázar et al., 2017; Bonaca et al., 2017; Sanderson et al., 2017) have shown that mergers and secular dynamical processes, particularly outflow-driven fluctuations in the gravitational potential, can cause stars to migrate substantially after they form. We now investigate where the oldest stars formed, and how they arrived at their present-day spatial and kinematic distribution.
4.1 Defining formation sites
To determine where the oldest stars in the simulated galaxies at formed, we tag star particles that formed before and are in the primary galaxy at (unless otherwise stated, within 10 kpc of the galactic center) and then trace them back to the time of their formation. For each old star particle, we calculate the distance (always in physical units) from the main progenitor galaxy at the time of the star particle’s formation, which we approximate as the first simulation output in which it appears.999Simulation outputs are saved every 20 Myr, so star particles are expected to migrate kpc on average (with respect to their host galaxy at formation) between their formation and the first snapshot in which their positions are saved. We determine the main progenitor in each snapshot as follows.
At , the main galaxy in the zoom-in region is identified as the galaxy with the highest stellar mass that is uncontaminated by lower-resolution dark matter particles. Its center is located using an iterative “shrinking spheres” method (Power et al., 2003), wherein we recursively compute the center of mass of star particles in a spherical region, reducing the sphere’s radius by 50% and re-centering on the new stellar center-of-mass at each iteration.
We then trace the main galaxy back through all simulation outputs. We define the main progenitor in terms of stellar mass, not halo mass. In each output, we first calculate the “expected” location of the galaxy at that time by extrapolating backwards from its position and velocity in the next snapshot. We then repeat the shrinking-spheres centering algorithm, beginning with a sphere of radius 20 kpc centered on the expected location. We define the galaxy identified in this way as the “main progenitor” in each output.
This procedure ensures that the same galaxy is followed consistently through all snapshots. At high redshift, it is often the case that the main progenitor is not the most massive galaxy in the zoom-in region, since different galaxies grow at different rates. To ensure that the method produces the desired behaviour, we also verify that for every simulation output, more than 50% of the star particles in the main progenitor were also in the main progenitor in the previous output. We note that due to scatter in the relation, the main progenitor identified in this way is not necessarily the same as the main progenitor identified from the dark matter merger tree (e.g. Fitts et al., 2018).101010We find that defining the main progenitor using star particles generally yields the same results as when dark matter particles are used at low redshift, but not at . At very high redshifts (), it can even occur that the main progenitor defined from the dark matter merger tree does not contain any stars.
4.2 In situ vs. ex situ formation
In Figure 5, we trace the oldest stars in the m12i simulation back to their locations at high redshift. The left panel shows the spatial distribution at of star particles that inhabit the central 10 kpc of the galaxy at . It is clear that at , these stars were not part of a single coherent population, but were distributed throughout of order 100 distinct lower-mass galaxies that subsequently merged. In m12i, the main progenitor (shown in the center of the left panel of Figure 5) was already the most massive galaxy in the zoom-in region, but it still contained less than half of the old stars that would make their way into the central galaxy by . We note that many of the dark matter halos in the left panel of Figure 5 that do not contain red points do host stars; they simply never merge with the main progenitor, and are swept up in the Hubble flow by .
The right panel of Figure 5 shows the distance from the main progenitor of stars that formed before at the time of their formation (i.e., some time before ; red) and at (black). We plot distributions of formation distance for stars within different concentric shells at . The dotted red histogram shows that, even considering only stars in the central 10 kpc at , a majority of old stars formed at distances of order 100 kpc from the main progenitor. When stars in the outer halo at are included (solid red line), only a few percent of the oldest stars formed in the main progenitor. The most distant-forming stars in the central 10 kpc at formed at distances of 250 kpc, while some stars in the outer halo formed at distances in excess of 400 kpc from the main progenitor.
Comparing the black and red histograms in the right panel of Figure 5, it is also evident that old stars that formed in the central regions of the main progenitor have on average moved to larger distance by . We investigate this in more detail in Section 4.3.
, but there is significant variation in the detailed formation histories of the three simulations.
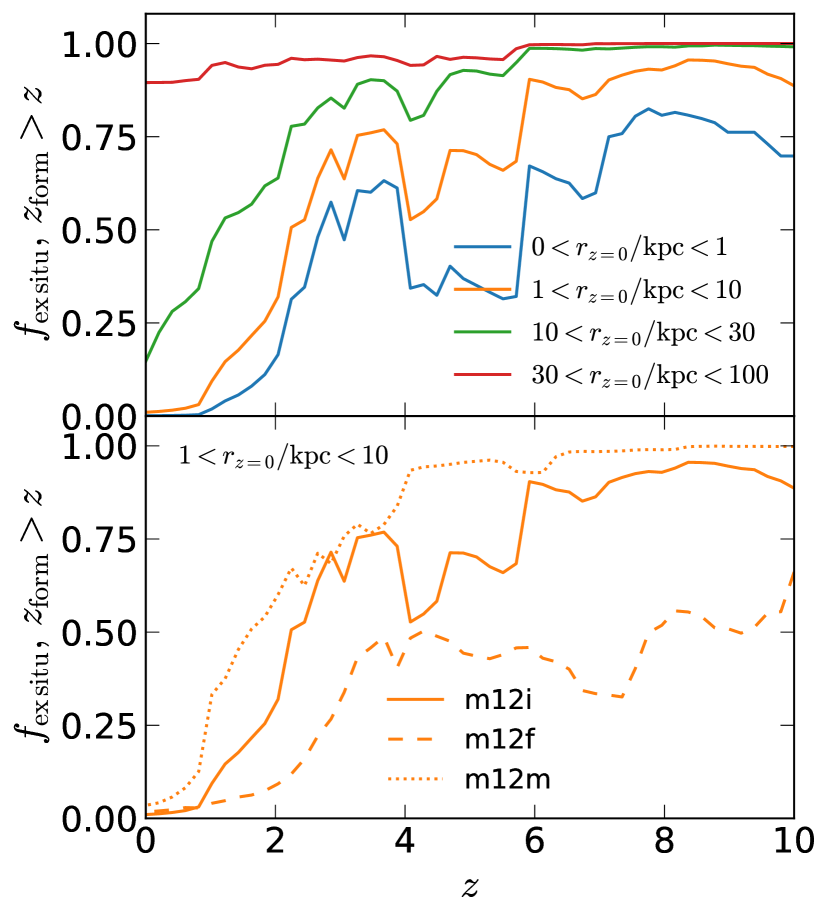
Figure 6 shows explicitly how the fraction of stars formed ex situ (which we define as forming more than 20 kpc from the main progenitor) varies with formation time. In the top panel, for m12i only, we show the ex situ fraction in different radial bins. At all formation redshifts, the ex situ fraction increases monotonically with radius: more centrally-concentrated stars were preferentially formed in situ. However, even for the central bin ( kpc), in m12i it is only after that stars formed in situ begin to dominate over those accreted at later times. Intriguingly, this panel also shows that a nonzero fraction of stars in the outer halo (), including some formed at late times, formed in situ. We find that these stars primarily form from already-outflowing, feedback-driven gas clouds, similar to results found in other simulations (Purcell et al., 2010; Cooper et al., 2015; Elias et al., 2018). The origin and fate of these stars will be explored in more detail by Yu et al. (in prep).
The bottom panel of Figure 6 compares the fraction of stars within 10 kpc at that formed ex situ in all simulations. For all three simulated galaxies, at least half of the stars born before were formed ex situ and subsequently accreted. However, the fraction of stars of a given age formed ex situ varies substantially across the three simulations: in m12m, ex situ stars dominate at , while in m12f, of order half of all stars formed in situ up to .
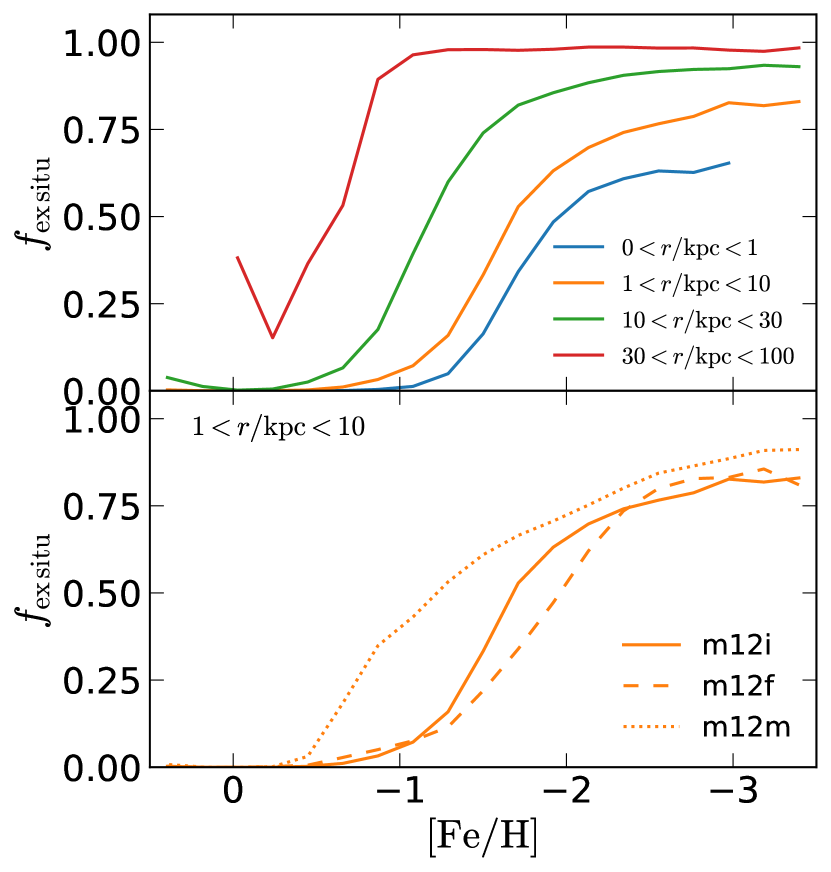
Figure 7 shows the fraction of stars formed ex situ as a function of metallicity rather than formation redshift. Even within the solar circle, most metal-poor stars formed ex situ and were subsequently accreted. The metallicity below which the majority of stars in the inner galaxy formed ex situ varies between -1.9 in m12f and -1.2 in m12m. This suggests that simply selecting metal-poor stars – at any radius – will predominantly yield stars that formed ex situ.
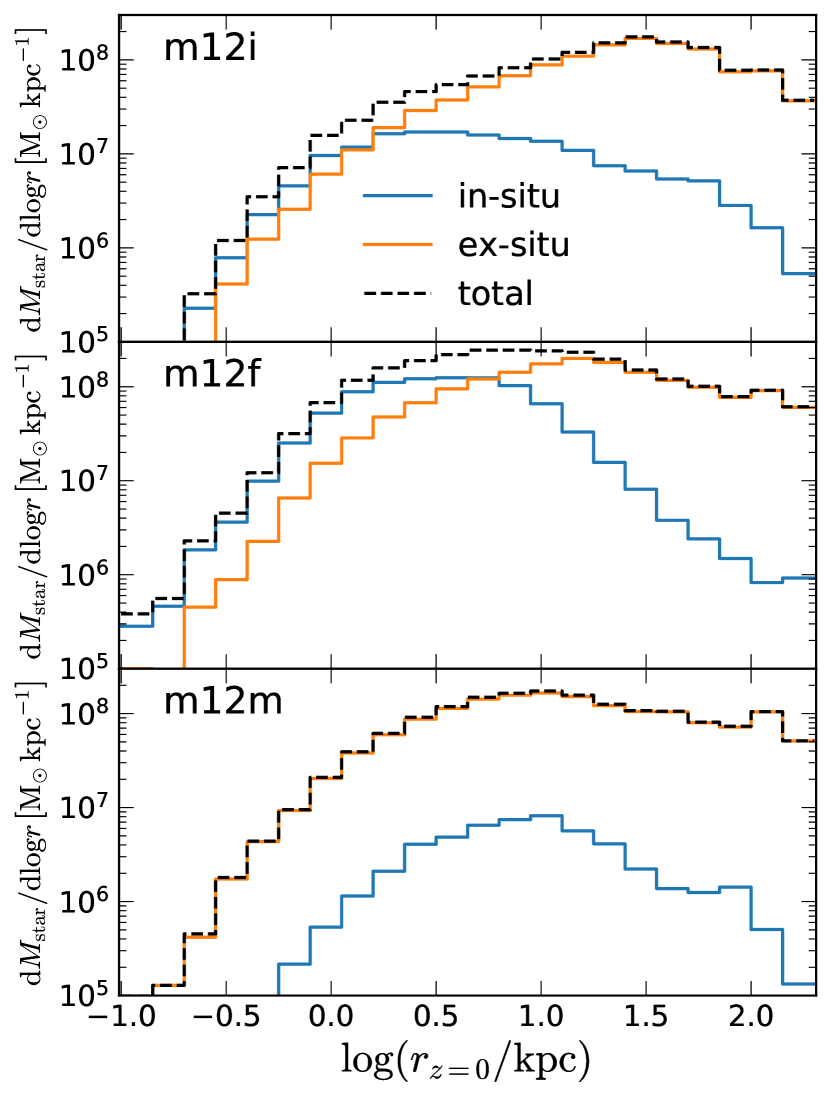
In Figure 8, we show the spatial distribution at of the oldest stars in all three simulations, separating stars that formed in situ and those that formed ex situ. Old stars formed in situ are generally more centrally concentrated: in m12i, they outnumber the ex situ stars in the central 1 kpc, but ex situ stars become dominant at kpc. The situation is qualitatively similar in m12f, which formed earlier, but in situ stars make up a larger fraction of the old population and thus dominate out to 5 kpc. Finally, in m12m, the ex situ population is completely dominant at all radii.
In m12m, the main progenitor does not contribute the oldest coherent population of old stars in the galaxy, as several other halos host galaxies more massive than the main progenitor at that eventually merge with the main progenitor. In this sense, “main progenitor” is not an especially meaningful title at high redshift: although the main progenitor can always be uniquely defined, there is no guarantee that it is the dominant progenitor. Similarly, the distinction between in situ and ex situ stars ceases to be physically meaningful before a main progenitor is established.
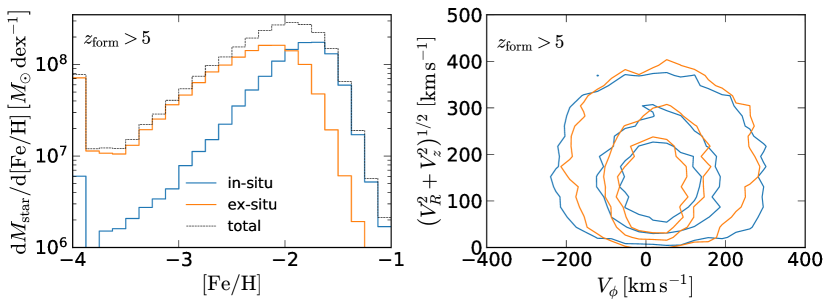
In Figure 9, we consider the possibility of distinguishing between the in situ and ex situ populations based on observables. Here we show the simulation m12f, which has a coherent main progenitor up to the highest redshifts and thus offers the best chance of exhibiting a coherent in situ population at late times. Consistent with previous work (Johnston et al., 2008; Corlies et al., 2013), we find that the mean metallicity of old stars is higher for the old in situ population, reflecting the fact that the galaxy mass-metallicity relation remains steep at high redshift (Ma et al., 2016). It is thus in principle possible to assign a known old star a probability of having formed in situ based on its metallicity; for example, an old star in m12f with has a % probability of having formed in situ. In practice, separating the in situ and ex situ populations based on alone is entirely infeasible, both due to the difficulty of reliably age-dating such moderately low-metallicty stars and because the metallicity distributions of the MW’s old in situ and ex situ stars are not known a priori. We discuss possible avenues for distinguishing these populations based on abundances of other elements in Section 6.
In the right panel of Figure 9, we compare Toomre diagrams of the old in situ and ex situ populations in m12f. Contours are separated by factors of two and show the velocity-space surface density of old stars, normalized by the total mass of each population. This figure shows that the in situ and ex situ populations have essentially indistinguishable kinematics: both are dispersion supported and retain no obvious memory of their formation. This is perhaps unsurprising, since violent relaxation during hierarchical merging at later times generously redistributes energy between stellar orbits. Bonaca et al. (2017) found similar results for stars in the solar neighborhood of m12i, including those formed and accreted at later times. Similarly, Sanderson et al. (2017) found ex situ and in situ stars in these simulated galaxies to be spatially co-located and well-mixed at , such that standard attempts to separate the populations using photometric profiles perform poorly.
Our simulations predict that a large fraction of the oldest stars in the Milky Way – including those near the center today – did not form locally, but were accreted at later times after forming in external subhalos. This in part explains why our model predicts a reduced fraction of old stars towards the Galactic center (Figure 1) and overwhelming dispersion-supported kinematics for old stars (Figure 4): while stars that form at later times are born from low-orbital energy gas near the center of the primary halo’s gravitational potential, stars deposited in mergers have higher energies and are spread over a large range of radii (e.g. Bullock & Johnston, 2005; Sharma et al., 2017).
But as we discuss below, this is only part of the story.
4.3 Outward migration of old stars
It is evident from the right panel of Figure 5 that stars move both inward and outward between their formation and . As we discuss in the previous section, inward motion is a necessary result of hierarchical assembly through mergers. We now investigate in more detail what drives stars to move outward after they form; to this end, we focus on stars formed in situ near the galactic center.
To assess how old stars migrate as a function of redshift, we tag star particles that are near the galactic center ( kpc) at some high redshift , follow them to , and measure (so outward migration corresponds to positive ). Because stellar orbits are not necessarily circular, some nonzero is expected simply due to random changes in orbital phase from one snapshot to the next. To minimize the scatter due to this effect, we always calculate both and in five simulations snapshots spread over 100 Myr; for each particle, we use the median radius over these 5 snapshots.
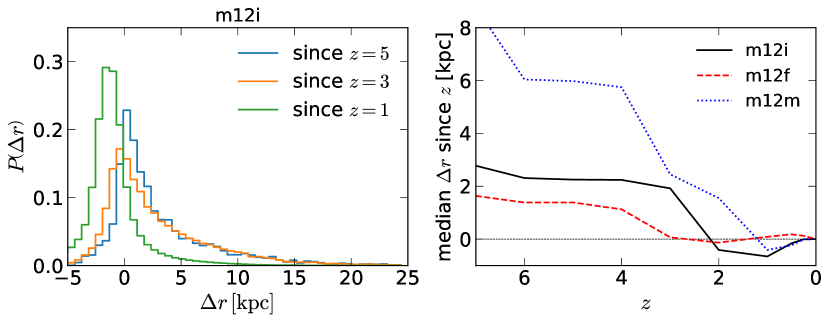
We show values of for and 1 in Figure 10. The left panel shows distributions of for star particles in m12i. Most stars have moved outward since , with a median kpc and 25% of stars migrating outward more than 6 kpc. Since , most stars have migrated outward, but typical values are slightly lower than since . Finally, most stars within kpc migrate inward between and . The right panel of Figure 10 shows the median since redshift for all three simulations. In all cases stars formed in situ before migrate outward on average by , but the details differ nontrivially across different simulations.
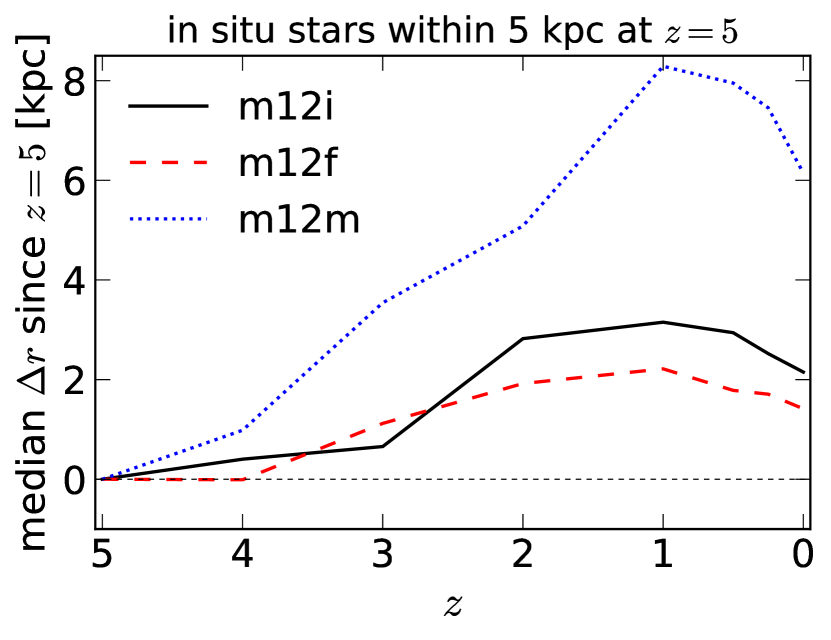
Whereas Figure 10 shows how much stars that were near the galactic center at a given redshift have migrated by , Figure 11 follows the migration of one particular set of star particles – those that formed in situ and are near the galactic center at – as a function of time. For all three simulations, old in situ stars (on average) migrate outward continually between and , and then migrate inward between and .
Previous works (e.g. Read & Gilmore, 2005; Stinson et al., 2009; Maxwell et al., 2012; El-Badry et al., 2016, 2017b) have shown that in low-mass galaxies, a time-varying gravitational potential, generated primarily by stellar-feedback driven gas outflows, can drive stars formed in situ into the stellar halo. This process has also been shown to create cores in low-mass galaxies’ dark matter density profiles (Di Cintio et al., 2014; Oñorbe et al., 2015; Chan et al., 2015). It is not generally thought to operate in galaxies, as it relies on rapid outflows launched by bursty star formation to drive impulsive changes in the depth of the gravitational potential (Pontzen & Governato, 2012, 2014). Star formation is typically not bursty at late times in MW-mass galaxies, but it is at higher redshift (e.g. Sparre et al., 2017; Faucher-Giguère, 2018). Indeed, the shallow potentials of MW-progenitors at early times render them susceptible to the same type of feedback-driven net outward stellar migration found by El-Badry et al. (2016) to operate in low-mass galaxies at late times.
Stars cease migrating outward after (right panel of Figure 10 and Figure 11) because fluctuations in the gravitational potential have largely died down by this time: mass accumulation in the galactic center due to continued gas inflow deepens the potential until feedback-driven outflows can no longer impulsively evacuate dynamically significant quantities of gas from the galactic center. The stronger (weaker) outward migration of old stars in m12m (m12f) can also be understood as a consequence of the simulation’s less (more) dominant main progenitor at high redshift: it is easier to drive large-scale potential fluctuations, due both to outflows and to mergers, in a shallow potential.
After , contraction of the potential due to continued accumulation of baryons at high density (e.g. Blumenthal et al., 1986) actually drives stars to migrate inward, partially undoing outward migration at earlier times. This inward migration is somewhat weaker in m12f, perhaps because this galaxy forms a weaker bulge than the other two simulations, so that the central potential contracts less at later times (see Garrison-Kimmel et al., 2017a).
Chan et al. (2015) studied the evolution of the central dark matter density profile in FIRE simulation of MW-like galaxies and found similar redshift evolution to what we find for the oldest stars (e.g. compare Figure 11 to their Figure 5): stellar feedback-driven potential fluctuations remove dark matter from a galaxy’s inner regions until , but contraction of the halo at later times due to continued accretion of baryons in the absence of bursty star formation partially undoes this effect by .
5 Comparison to previous work
A number of previous studies (Scannapieco et al., 2006; Salvadori et al., 2007, 2010; Tumlinson, 2010; Ishiyama et al., 2016; Griffen et al., 2018) have used dark matter only simulations combined with semi-analytic prescriptions for the formation sites of the first stars to model the distribution of old stars in MW-like galaxies at . In qualitative agreement with this work, these studies have predicted old stars to be concentrated near the Galactic Center. We emphasize, however, that because the population of old stars in the inner galaxy is diluted at by later-forming stars (by a factor of 10,000 to 1; see Figure 1) it may be more efficient to search for old stars at higher galactic latitudes. We also note that most studies based on dark matter only simulations do not account for destruction of substructure due to the strong tidal field of the baryon overdensity in the inner halo (e.g. Garrison-Kimmel et al., 2017b) and also cannot model baryon-driven fluctuations in the potential that drive stars outward, so we expect the oldest stars to be somewhat more dispersed than predicted by these works.
Our study most closely resembles the recent work of Starkenburg et al. (2017a), who studied the distribution of the oldest stars in the APOSTLE simulations (Sawala et al., 2016) of paired halos selected to resemble the Local Group. These authors found that 50 percent of the most metal-poor stars, which they defined as , form before . We find similar results: for our three halos, 50 percent stars with form before (m12i), (m12f) and (m12m). They find that 90 percent of the most metal-poor stars form before ; we find corresponding redshifts (m12i), (m12f) and (m12m).
We also find reasonable agreement with Starkenburg et al. when we reproduce their Figure 2, which shows the fraction of the oldest and most metal-poor stars compared to the total population as a function of galactic radius (see our Figure 1 for a rough comparison); our three halos all fall within the range of ancient fractions spanned by their simulations. Both APOSTLE and FIRE find that the fraction of the most metal-poor stars that are old declines with radius.
However, the fraction of all stars that are old in the central few kpc is lower than the median value found by Starkenburg et al. (2017a) for all three of our simulated galaxies, by a factor of 3-4 on average. We also find the fraction of all stars that are ancient to increase by roughly an order of magnitude between the galactic center and the solar neighborhood, while they find it to be nearly flat. In other words, old stars in our simulations are less centrally concentrated than in APOSTLE, at least within kpc. Similarly, we find that the fraction of metal-poor stars in the inner galaxy is lower by a factor of 2 in our simulations; this disagreement is somewhat weaker than that for ancient stars, likely because a significant fraction of the metal-poor stars are formed ex situ.
We suspect that old stars in our simulations are less centrally concentrated due to energetic feedback processes that drive outward the stars formed near the center of the high-redshift MW progenitor’s shallow potential. The APOSTLE simulations do not attempt to model cold ( K) gas and allow star formation to occur at relatively low densities (), a factor of 10,000 lower than the star formation density threshold of adopted in the FIRE model. This causes star formation in their simulations to be less spatially and temporally clustered than in models that attempt to resolve the cold ISM, preventing the formation of cores in the dark matter density profiles of their low-mass galaxies (Oman et al., 2015). Because the mechanism we propose for driving old stars formed in situ to larger radii relies in part on the same feedback-driven potential fluctuations that lead to the creation of these cores, we expect it to be less efficient in simulations that do not form cores.
6 Summary and Discussion
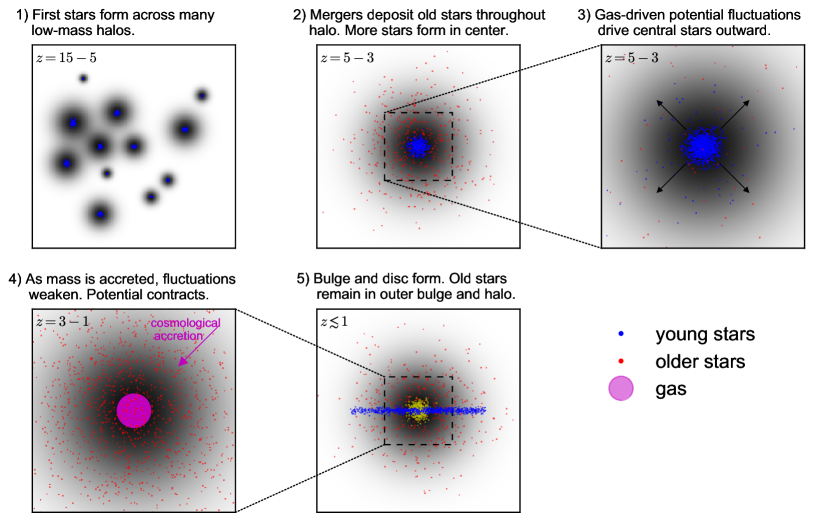
We have studied the spatial distribution, kinematics, metallicity, and formation history of the oldest stars in FIRE cosmological baryonic zoom-in simulations of three MW-mass disk galaxies. Figure 12 provides a schematic picture of the processes that lead to the observed distribution of the oldest stars at . Our main results are as follows:
-
1.
Spatial distribution of old stars at : The absolute number density of ancient stars () is highest near the galactic center, in the bulge and inner stellar halo. However, because stars that form at later times () are more centrally concentrated at , the fraction of all stars along a given line of sight that are ancient is in fact lowest for sight lines towards the inner galaxy (Figure 1). The fraction of metal-poor stars that are ancient generally decreases with galactocentric radius, but with significant scatter between different simulations.
-
2.
Kinematics of old stars: The oldest stars in our simulated galaxies are all on dispersion-supported, halo-like orbits, exhibiting no rotational support (Figure 4). The same is true for most metal-poor stars and most stars formed before , so dispersion-supported kinematics are a necessary but insufficient condition for a star to be ancient. Among old stars, stars formed in situ (i.e., within the main progenitor) and stars formed ex situ (in an external galaxy that was subsequently accreted) have indistinguishable kinematics (Figure 9).
-
3.
Rapid enrichment: The first generation of stars formed in the simulations rapidly enrich the gas surrounding their formation sites to , so that a majority of ancient stars have metallicities of (Figures 2 and 3) and enhanced [Fe]. Because these moderately low metallicty stars are more abundant than stars with extremely low metallicity (), they represent promising targets for surveys attempting to identify the oldest stars in the Galaxy, if their ages can be reliably measured. Conversely, the most metal-poor stars are not uniformly old: stars with continue to form until .
-
4.
In situ vs. ex situ formation: Our simulations predict that a dominant fraction of the ancient stars in the MW at – even those near the Galactic center – did not form in situ, but formed in external galaxies, often more than 100 kpc from the main progenitor, and were deposited in the halo through hierarchical mergers at (Figure 5). Even in the central 10 kpc, these ex situ stars dominate the old, metal-poor population: most stars with formed ex situ. The same is true for most stars with (Figure 6 and 7). Accreted stars do not penetrate as deep into the potential as stars formed in situ at late times (Figures 5 and 8). This is one of the two primary reasons old stars are less centrally concentrated at than stars formed at later times.
-
5.
Outward migration after formation: Even old stars that form in situ and are initially centrally concentrated migrate outward by . This outward migration is qualitatively similar to the processes proposed to create dark matter cores and drive stars in low-mass galaxies outward even at later times (El-Badry et al., 2016): fluctuations in the gravitational potential, driven by large-scale gas inflows/outflows as well as mergers, add energy to stellar orbits. These fluctuations die out by , so that stars formed at later times do not migrate outward much, and in fact migrate inward as the potential contracts at later times (Figures 10 and 11).
6.1 Prospects for identifying the oldest stars
Our simulations predict that a substantial fraction of stars with formed before and are now spread throughout the Galaxy. Magnitude-limited surveys like RAVE, GALAH, APOGEE, LAMOST, and SEGUE find metal-poor stars in abundance. For example, RAVE detected 480,000 stars with SNR 20 at intermediate spectral resolution (; Kunder et al. 2017), about 6000 of which have . We expect LAMOST to deliver an even larger set of very metal poor stars, albeit at lower spectroscopic resolution (; Li et al. 2015). GALAH has observed 550,000 stars to date at high resolution (; De Silva et al. 2015) for which 500 stars with [Fe/H] -2 have SNR 50 required for useful measurements of heavy metal abundances. Comparable numbers of metal-poor stars have been observed at high resolution and SNR by APOGEE (Majewski et al., 2017; Fernández-Alvar et al., 2017). Gaia-RVS is expected to increase the known population of very metal-poor stars by more than an order of magnitude (Robin et al., 2012).
Photometric surveys have also proved effective for identifying metal-poor stars. Although spectroscopic follow-up is required to measure detailed abundances and kinematics, photometric surveys can reliably identify metal-poor stars more efficiently and at larger distances than spectroscopic surveys, and they are sensitive to dwarfs as well as giants. The fact that metal-poor stars are bluer has long been used to photometrically identify candidate ancient stars (e.g. Wallerstein, 1962), and even broadband photometry, (e.g., from SDSS; Ivezić et al. 2008) can yield metallicities accurate at the 0.1 dex level for metal-rich stars (). For moderately metal-poor stars (), intermediate-band Stromgren photometry can reliably measure metallicities with a precision of a few tenth of a dex (Strömgren, 1963; Árnadóttir et al., 2010). Stars with still lower metallicities can be efficiently identified both with narrow-band photometry targeting the Calcium H & K lines (Beers et al., 1985; Christlieb et al., 2002; Hill et al., 2017; Starkenburg et al., 2017b; Youakim et al., 2017) or mid-infrared photometry targeting broad absorption bands (e.g. Schlaufman & Casey, 2014; Casey & Schlaufman, 2015). State-of-the-art surveys searching for extremely metal-poor stars can photometrically identify stars with with a success rate of up to 25%; the majority of their higher-metallicity contaminants still have (Youakim et al., 2017). Finally, LSST is predicted to find tens of thousands of RR Lyrae stars throughout the Local Group (Oluseyi et al., 2012); these span a wide range of metallicities but are all relatively old ( Gyr).
Compared to the search for ancient stars at the low metallicity limit, less effort has been expended to find and study those at . This owes primarily to the difficulty of identifying the oldest members of this population. If higher-metallicity ancient stars can be reliably identified, targeting them offers some advantages over UMP stars. As we have demonstrated (e.g. Figure 3), ancient stars with are predicted to be much more numerous than UMP stars of the same age. At fixed apparent magnitude, more elemental abundances can be measured for stars with higher metallicity, providing a more complete probe of the yields of their progenitor stars and, in exceptional cases, enabling age-dating with more precise chemical clocks. On the other hand, the gas clouds from which more metal-rich ancient stars formed were likely enriched by a larger number of supernovae, so the interpretation of these stars’ abundance patterns in terms of first-star yields is more challenging.
The most significant challenge facing efforts to use ancient stars for Galactic archaelogy stems from the difficulty of measuring accurate stellar ages; i.e, identifying which stars are actually ancient. At present, there is no reliable method for age-dating individual old stars with better than 10% accuracy (see Soderblom 2010, for a review); this means, for example, that stars formed at cannot be reliably distinguished from stars formed at , at least not without appealing to galactic chemical enrichment models. Even for globular clusters, where information in many parts of the HR diagram can be leveraged to simultaneously constrain the age of the stellar population, state-of-the-art uncertainties on absolute stellar ages are of order Gyr (Chaboyer et al. 2017, or see Choksi et al. 2018, for a compilation).
Investments in 3D stellar atmospheric models and measurement of many heavy element abundances (e.g. Nissen et al., 2017; Chiavassa et al., 2018) may somewhat improve age constraints on stars for which exceptionally high-resolution and high-SNR data are available. Measuring accurate stellar ages will nevertheless present a significant challenge for the foreseeable future. This is due in large part to persistent and fundamental uncertainties in stellar interior models, such as shortcomings in mixing-length theory (Joyce & Chaboyer, 2017) and non-negligible uncertainties in the experimentally-measured opacities used for stellar interior calculations (e.g. Bailey et al., 2015).
Ongoing and planned asteroseismic missions are predicted to deliver mass measurements of some RGB stars (Chaplin et al., 2014; Rauer et al., 2014; Ricker et al., 2015) accurate enough to, in principle, yield ages that are accurate at the % level. However, uncertainties in mass loss rates on the RGB (e.g. Miglio et al., 2012) are currently large enough to prevent measurement of initial stellar masses with better than 10% accuracy, and asteroseismic mass estimates for most RGB stars carry similar uncertainties (Stello et al., 2015). Typical uncertainties on asteroseismic ages thus remain of order 15% (Silva Aguirre et al., 2015), comparable to the uncertainties in age estimates of giants from the spectroscopic [C/N] ratio (e.g. Ness et al., 2016) and age estimates for main-sequence stars with white dwarf companions (Fouesneau et al., 2018). The precision of such ages is likely to improve with the influx of better data, but the uncertainties in stellar models discussed above currently set a more uncompromising limit on the accuracy of absolute ages, at the 7-10% level. We also note that asteroseismic mass determinations for low-metallicity stars may be subject to some biases (e.g. Epstein et al., 2014), and precise [C/N]-based ages cannot be obtained at low metallicity.
In lieu of direct age estimates from stellar physics, a possible alternate route for identifying ancient stars at intermediate metallicity is to appeal to specific metal-producing populations (e.g. -process in core collapse SNe) that are likely to have occurred before other high-yield populations (e.g. -process in AGBs, Fe peak elements in SNe Ia). While the precise origin of the -process continues to be controversial (Winteler et al., 2012; Arcones & Thielemann, 2013), with recent work suggesting a prompt channel in neutron star mergers (Belczynski et al., 2017), most models suggest that -process enhancement with respect to Fe peak and -process elements provides strong evidence a star is ancient (Frebel & Norris, 2015).
Are there stars at that have enhanced -process elements compared to -process elements? The literature is sparse, but some candidates do exist. A newly revealed example is the retrograde halo star RAVE J153830.9-180424 with , enhanced , enhanced and suppressed (Sakari et al., 2018). Detailed modeling of the actinide elements (Th, U) with respect to the other heavy elements supports the idea of this star being ancient, albeit with systematic uncertainties of several Gyr. Similar abundance patterns have also been found for some stars in metal-poor globular clusters (GCs; Sneden et al., 1997; Worley et al., 2013; Roederer & Thompson, 2015).
Indeed, although their formation remains poorly understood theoretically, GC age constraints purely from stellar models are consistent with a large fraction of metal-poor GCs forming before (Chaboyer, 1995; Krauss & Chaboyer, 2003; Bastian & Lardo, 2017). Because GCs are too small to be properly resolved in the simulations we study here, we cannot yet predict their ages and spatial distribution a priori. Dynamical friction arguments (e.g. Capuzzo-Dolcetta, 1993; Carlberg, 2017) suggest that since-disrupted GCs should be found in the inner bulge, and recent observation appear to support this idea (Minniti et al., 2016; Schiavon et al., 2017). Modeling the self-consistent formation and evolution of GCs in a cosmological context is a promising avenue for future work.
Given the nature and extent of existing stellar surveys and the difficulty of reliably age-dating old stars, it is unsurprising that metal-enriched ancient stars have yet to be identified in significant numbers. If such stars can be reliably identified in the future, then their spatial distribution will serve as a constraint on feedback models: because these stars were formed when the MW’s progenitor’s shallow potential was more susceptible to feedback-driven outflows than at late times, the dynamical imprint of baryon-driven potential fluctuations in our simulations is much larger for ancient stars than for stars formed at late times.
7 Acknowledgements
We have benefited from fruitful discussions with K.C. Freeman, A. Karakas, S. Loebman, C.F. McKee, and S. Tabin. KE acknowledges support from a Berkeley graduate fellowship, a Hellman award for graduate study, and an NSF Graduate Research Fellowship. JBH acknowledges a Miller Professorship from the Miller Institute, UC Berkeley. JBH is also supported by an ARC Laureate Fellowship from the Australian Government. AW was supported by NASA through grants HST-GO-14734 and HST-AR-15057 from STScI. EQ and KE are supported by a Simons Investigator Award from the Simons Foundation and by NSF grant AST-1715070. DRW is supported by a fellowship provided by the Alfred P. Sloan Foundation. MBK acknowledges support from NSF grant AST-1517226 and CAREER grant AST-1752913 and from NASA grants NNX17AG29G and HST-AR-13888, HST-AR-13896, HST-AR-14282, HST-AR-14554, HST-AR-15006, HST-GO-12914, and HST-GO-14191 from STScI. Support for PFH was provided by an Alfred P. Sloan Research Fellowship, NASA ATP Grant NNX14AH35G, and NSF Collaborative Research Grant #1411920 and CAREER grant #1455342. CAFG was supported by NSF through grants AST-1412836, AST-1517491,AST-1715216, and CAREER award AST-1652522, by NASA through grant NNX15AB22G, and by a Cottrell Scholar Award from the Research Corporation for Science Advancement. DK was supported by NSF grants AST-1412153 and AST-1715101 and the Cottrell Scholar Award from the Research Corporation for Science Advancement. Support for SGK was provided by NASA through Einstein Postdoctoral Fellowship grant number PF5-160136 awarded by the Chandra X-ray Center, which is operated by the Smithsonian Astrophysical Observatory for NASA under contract NAS8-03060. We ran numerical calculations on the Caltech compute cluster “Wheeler,” allocations TG-AST130039 & TG-AST150080 granted by the Extreme Science and Engineering Discovery Environment (XSEDE) supported by the NSF, and the NASA HEC Program through the NAS Division at Ames Research Center and the NCCS at Goddard Space Flight Center. The analysis in this paper relied on the python packages NumPy (Van Der Walt et al., 2011), Matplotlib (Hunter, 2007), and AstroPy (Astropy Collaboration et al., 2013).
References
- Abel et al. (2000) Abel T., Bryan G. L., Norman M. L., 2000, ApJ, 540, 39
- Aguado et al. (2018) Aguado D. S., Allende Prieto C., González Hernández J. I., Rebolo R., 2018, ApJ, 854, L34
- Anglés-Alcázar et al. (2017) Anglés-Alcázar D., Faucher-Giguère C.-A., Kereš D., Hopkins P. F., Quataert E., Murray N., 2017, MNRAS, 470, 4698
- Arcones & Thielemann (2013) Arcones A., Thielemann F.-K., 2013, Journal of Physics G Nuclear Physics, 40, 013201
- Árnadóttir et al. (2010) Árnadóttir A. S., Feltzing S., Lundström I., 2010, A&A, 521, A40
- Asplund et al. (2009) Asplund M., Grevesse N., Sauval A. J., Scott P., 2009, ARA&A, 47, 481
- Astropy Collaboration et al. (2013) Astropy Collaboration et al., 2013, A&A, 558, A33
- Baade (1946) Baade W., 1946, PASP, 58, 249
- Baade (1951) Baade W., 1951, Publications of Michigan Observatory, 10, 7
- Bailey et al. (2015) Bailey J. E., et al., 2015, Nature, 517, 56
- Baker & Willman (2015) Baker M., Willman B., 2015, AJ, 150, 160
- Bastian & Lardo (2017) Bastian N., Lardo C., 2017, preprint, (arXiv:1712.01286)
- Beers & Christlieb (2005) Beers T. C., Christlieb N., 2005, ARA&A, 43, 531
- Beers et al. (1985) Beers T. C., Preston G. W., Shectman S. A., 1985, AJ, 90, 2089
- Belczynski et al. (2017) Belczynski K., et al., 2017, preprint, (arXiv:1712.00632)
- Beniamini et al. (2018) Beniamini P., Dvorkin I., Silk J., 2018, MNRAS,
- Bessell et al. (2015) Bessell M. S., et al., 2015, ApJ, 806, L16
- Bland-Hawthorn & Peebles (2006) Bland-Hawthorn J., Peebles P. J. E., 2006, Science, 313, 311
- Bland-Hawthorn et al. (2015) Bland-Hawthorn J., Sutherland R., Webster D., 2015, ApJ, 807, 154
- Blumenthal et al. (1986) Blumenthal G. R., Faber S. M., Flores R., Primack J. R., 1986, ApJ, 301, 27
- Bonaca et al. (2017) Bonaca A., Conroy C., Wetzel A., Hopkins P. F., Kereš D., 2017, ApJ, 845, 101
- Bovill & Ricotti (2011) Bovill M. S., Ricotti M., 2011, ApJ, 741, 17
- Bromm (2013) Bromm V., 2013, Reports on Progress in Physics, 76, 112901
- Bromm & Larson (2004) Bromm V., Larson R. B., 2004, ARA&A, 42, 79
- Bromm & Yoshida (2011) Bromm V., Yoshida N., 2011, ARA&A, 49, 373
- Brook et al. (2007) Brook C. B., Kawata D., Scannapieco E., Martel H., Gibson B. K., 2007, ApJ, 661, 10
- Brown et al. (2014) Brown T. M., et al., 2014, ApJ, 796, 91
- Bullock & Johnston (2005) Bullock J. S., Johnston K. V., 2005, ApJ, 635, 931
- Bullock et al. (2001) Bullock J. S., Kravtsov A. V., Weinberg D. H., 2001, ApJ, 548, 33
- Capuzzo-Dolcetta (1993) Capuzzo-Dolcetta R., 1993, ApJ, 415, 616
- Carlberg (2017) Carlberg R. G., 2017, preprint, (arXiv:1706.01938)
- Casey & Schlaufman (2015) Casey A. R., Schlaufman K. C., 2015, ApJ, 809, 110
- Cayrel et al. (2001) Cayrel R., et al., 2001, Nature, 409, 691
- Cescutti et al. (2017) Cescutti G., Chiappini C., Hirschi R., 2017, preprint, (arXiv:1710.11014)
- Chaboyer (1995) Chaboyer B., 1995, ApJ, 444, L9
- Chaboyer et al. (2017) Chaboyer B., et al., 2017, ApJ, 835, 152
- Chan et al. (2015) Chan T. K., Kereš D., Oñorbe J., Hopkins P. F., Muratov A. L., Faucher-Giguère C.-A., Quataert E., 2015, MNRAS, 454, 2981
- Chaplin et al. (2014) Chaplin W. J., et al., 2014, ApJS, 210, 1
- Chiavassa et al. (2018) Chiavassa A., Casagrande L., Collet R., Magic Z., Bigot L., Thevenin F., Asplund M., 2018, preprint, (arXiv:1801.01895)
- Choi et al. (2016) Choi J., Dotter A., Conroy C., Cantiello M., Paxton B., Johnson B. D., 2016, ApJ, 823, 102
- Choksi et al. (2018) Choksi N., Gnedin O., Li H., 2018, preprint, (arXiv:1801.03515)
- Christlieb (2003) Christlieb N., 2003, in Schielicke R. E., ed., Reviews in Modern Astronomy Vol. 16, Reviews in Modern Astronomy. p. 191 (arXiv:astro-ph/0308016), doi:10.1002/9783527617647.ch8
- Christlieb et al. (2002) Christlieb N., et al., 2002, Nature, 419, 904
- Cooper et al. (2010) Cooper A. P., et al., 2010, MNRAS, 406, 744
- Cooper et al. (2015) Cooper A. P., Parry O. H., Lowing B., Cole S., Frenk C., 2015, MNRAS, 454, 3185
- Corlies et al. (2013) Corlies L., Johnston K. V., Tumlinson J., Bryan G., 2013, ApJ, 773, 105
- De Silva et al. (2015) De Silva G. M., et al., 2015, MNRAS, 449, 2604
- Di Cintio et al. (2014) Di Cintio A., Brook C. B., Macciò A. V., Stinson G. S., Knebe A., Dutton A. A., Wadsley J., 2014, MNRAS, 437, 415
- Eggen et al. (1962) Eggen O. J., Lynden-Bell D., Sandage A. R., 1962, ApJ, 136, 748
- El-Badry et al. (2016) El-Badry K., Wetzel A., Geha M., Hopkins P. F., Kereš D., Chan T. K., Faucher-Giguère C.-A., 2016, ApJ, 820, 131
- El-Badry et al. (2017a) El-Badry K., Weisz D. R., Quataert E., 2017a, MNRAS, 468, 319
- El-Badry et al. (2017b) El-Badry K., Wetzel A. R., Geha M., Quataert E., Hopkins P. F., Kereš D., Chan T. K., Faucher-Giguère C.-A., 2017b, ApJ, 835, 193
- El-Badry et al. (2018a) El-Badry K., et al., 2018a, preprint, (arXiv:1801.03933)
- El-Badry et al. (2018b) El-Badry K., et al., 2018b, MNRAS, 473, 1930
- Elias et al. (2018) Elias L. M., Sales L. V., Creasey P., Cooper M. C., Bullock J. S., Rich M. R., Hernquist L., 2018, preprint, (arXiv:1801.07273)
- Epstein et al. (2014) Epstein C. R., et al., 2014, ApJ, 785, L28
- Escala et al. (2018) Escala I., et al., 2018, MNRAS, 474, 2194
- Faucher-Giguère (2018) Faucher-Giguère C.-A., 2018, MNRAS, 473, 3717
- Feltzing et al. (2017) Feltzing S., et al., 2017, preprint, (arXiv:1708.08884)
- Fernández-Alvar et al. (2017) Fernández-Alvar E., et al., 2017, MNRAS, 465, 1586
- Fitts et al. (2018) Fitts A., et al., 2018, preprint, (arXiv:1801.06187)
- Fouesneau et al. (2018) Fouesneau M., Rix H.-W., von Hippel T., Hogg D. W., Tian H., 2018, preprint, (arXiv:1802.06663)
- Frebel & Norris (2015) Frebel A., Norris J. E., 2015, ARA&A, 53, 631
- Frebel et al. (2007) Frebel A., Christlieb N., Norris J. E., Thom C., Beers T. C., Rhee J., 2007, ApJ, 660, L117
- Freeman & Bland-Hawthorn (2002) Freeman K., Bland-Hawthorn J., 2002, ARA&A, 40, 487
- Gao et al. (2010) Gao L., Theuns T., Frenk C. S., Jenkins A., Helly J. C., Navarro J., Springel V., White S. D. M., 2010, MNRAS, 403, 1283
- García Pérez et al. (2013) García Pérez A. E., et al., 2013, ApJ, 767, L9
- Garrison-Kimmel et al. (2017a) Garrison-Kimmel S., et al., 2017a, preprint, (arXiv:1712.03966)
- Garrison-Kimmel et al. (2017b) Garrison-Kimmel S., et al., 2017b, MNRAS, 471, 1709
- Griffen et al. (2018) Griffen B. F., Dooley G. A., Ji A. P., O’Shea B. W., Gómez F. A., Frebel A., 2018, MNRAS, 474, 443
- Hansen et al. (2017) Hansen T. T., et al., 2017, ApJ, 838, 44
- Harris (1996) Harris W. E., 1996, AJ, 112, 1487
- Helmi (2008) Helmi A., 2008, A&ARv, 15, 145
- Helmi et al. (2003) Helmi A., et al., 2003, ApJ, 586, 195
- Hill et al. (2002) Hill V., et al., 2002, A&A, 387, 560
- Hill et al. (2017) Hill V., Christlieb N., Beers T. C., Barklem P. S., Kratz K.-L., Nordström B., Pfeiffer B., Farouqi K., 2017, A&A, 607, A91
- Hopkins (2015) Hopkins P. F., 2015, MNRAS, 450, 53
- Hopkins et al. (2014) Hopkins P. F., Kereš D., Oñorbe J., Faucher-Giguère C.-A., Quataert E., Murray N., Bullock J. S., 2014, MNRAS, 445, 581
- Hopkins et al. (2017a) Hopkins P. F., et al., 2017a, preprint, (arXiv:1702.06148)
- Hopkins et al. (2017b) Hopkins P. F., et al., 2017b, preprint, (arXiv:1707.07010)
- Howes et al. (2015) Howes L. M., et al., 2015, Nature, 527, 484
- Howes et al. (2016) Howes L. M., et al., 2016, MNRAS, 460, 884
- Hunter (2007) Hunter J. D., 2007, Computing In Science & Engineering, 9, 90
- Ishiyama et al. (2016) Ishiyama T., Sudo K., Yokoi S., Hasegawa K., Tominaga N., Susa H., 2016, ApJ, 826, 9
- Ivezić et al. (2008) Ivezić Ž., et al., 2008, ApJ, 684, 287
- Ji & Frebel (2018) Ji A. P., Frebel A., 2018, preprint, (arXiv:1802.07272)
- Ji et al. (2016) Ji A. P., Frebel A., Chiti A., Simon J. D., 2016, Nature, 531, 610
- Johnston et al. (2008) Johnston K. V., Bullock J. S., Sharma S., Font A., Robertson B. E., Leitner S. N., 2008, ApJ, 689, 936
- Joyce & Chaboyer (2017) Joyce M., Chaboyer B., 2017, preprint, (arXiv:1712.05082)
- Karlsson et al. (2013) Karlsson T., Bromm V., Bland-Hawthorn J., 2013, Reviews of Modern Physics, 85, 809
- Keller et al. (2014) Keller S. C., et al., 2014, Nature, 506, 463
- Kirby et al. (2008) Kirby E. N., Simon J. D., Geha M., Guhathakurta P., Frebel A., 2008, ApJ, 685, L43
- Komiya et al. (2010) Komiya Y., Habe A., Suda T., Fujimoto M. Y., 2010, ApJ, 717, 542
- Krauss & Chaboyer (2003) Krauss L. M., Chaboyer B., 2003, Science, 299, 65
- Kroupa (2001) Kroupa P., 2001, MNRAS, 322, 231
- Kunder et al. (2017) Kunder A., et al., 2017, AJ, 153, 75
- Lamberts et al. (2018) Lamberts A., et al., 2018, preprint, (arXiv:1801.03099)
- Li et al. (2015) Li H.-N., Zhao G., Christlieb N., Wang L., Wang W., Zhang Y., Hou Y., Yuan H., 2015, ApJ, 798, 110
- Ma et al. (2016) Ma X., Hopkins P. F., Faucher-Giguère C.-A., Zolman N., Muratov A. L., Kereš D., Quataert E., 2016, MNRAS, 456, 2140
- Ma et al. (2017) Ma X., Hopkins P. F., Wetzel A. R., Kirby E. N., Anglés-Alcázar D., Faucher-Giguère C.-A., Kereš D., Quataert E., 2017, MNRAS, 467, 2430
- Magg et al. (2018) Magg M., Hartwig T., Agarwal B., Frebel A., Glover S. C. O., Griffen B. F., Klessen R. S., 2018, MNRAS, 473, 5308
- Majewski et al. (2017) Majewski S. R., et al., 2017, AJ, 154, 94
- Maxwell et al. (2012) Maxwell A. J., Wadsley J., Couchman H. M. P., Mashchenko S., 2012, ApJ, 755, L35
- McKee & Tan (2008) McKee C. F., Tan J. C., 2008, ApJ, 681, 771
- Miglio et al. (2012) Miglio A., et al., 2012, MNRAS, 419, 2077
- Minniti et al. (2016) Minniti D., Contreras Ramos R., Zoccali M., Rejkuba M., Gonzalez O. A., Valenti E., Gran F., 2016, ApJ, 830, L14
- Ness et al. (2016) Ness M., Hogg D. W., Rix H.-W., Martig M., Pinsonneault M. H., Ho A. Y. Q., 2016, ApJ, 823, 114
- Nissen et al. (2017) Nissen P. E., Silva Aguirre V., Christensen-Dalsgaard J., Collet R., Grundahl F., Slumstrup D., 2017, A&A, 608, A112
- Norris et al. (2013) Norris J. E., et al., 2013, ApJ, 762, 28
- Oñorbe et al. (2015) Oñorbe J., Boylan-Kolchin M., Bullock J. S., Hopkins P. F., Kereš D., Faucher-Giguère C.-A., Quataert E., Murray N., 2015, MNRAS, 454, 2092
- Oluseyi et al. (2012) Oluseyi H. M., et al., 2012, AJ, 144, 9
- Oman et al. (2015) Oman K. A., et al., 2015, MNRAS, 452, 3650
- Pontzen & Governato (2012) Pontzen A., Governato F., 2012, MNRAS, 421, 3464
- Pontzen & Governato (2014) Pontzen A., Governato F., 2014, Nature, 506, 171
- Power et al. (2003) Power C., Navarro J. F., Jenkins A., Frenk C. S., White S. D. M., Springel V., Stadel J., Quinn T., 2003, MNRAS, 338, 14
- Purcell et al. (2010) Purcell C. W., Bullock J. S., Kazantzidis S., 2010, MNRAS, 404, 1711
- Rauer et al. (2014) Rauer H., et al., 2014, Experimental Astronomy, 38, 249
- Read & Gilmore (2005) Read J. I., Gilmore G., 2005, MNRAS, 356, 107
- Ricker et al. (2015) Ricker G. R., et al., 2015, Journal of Astronomical Telescopes, Instruments, and Systems, 1, 014003
- Robin et al. (2012) Robin A. C., et al., 2012, A&A, 543, A100
- Roederer & Thompson (2015) Roederer I. U., Thompson I. B., 2015, MNRAS, 449, 3889
- Sakari et al. (2018) Sakari C. M., et al., 2018, ApJ, 854, L20
- Salvadori et al. (2007) Salvadori S., Schneider R., Ferrara A., 2007, MNRAS, 381, 647
- Salvadori et al. (2010) Salvadori S., Ferrara A., Schneider R., Scannapieco E., Kawata D., 2010, MNRAS, 401, L5
- Sandage (1986) Sandage A., 1986, ARA&A, 24, 421
- Sanderson et al. (2017) Sanderson R. E., et al., 2017, preprint, (arXiv:1712.05808)
- Sawala et al. (2016) Sawala T., et al., 2016, MNRAS, 457, 1931
- Scannapieco et al. (2006) Scannapieco E., Kawata D., Brook C. B., Schneider R., Ferrara A., Gibson B. K., 2006, ApJ, 653, 285
- Schiavon et al. (2017) Schiavon R. P., et al., 2017, MNRAS, 465, 501
- Schlaufman & Casey (2014) Schlaufman K. C., Casey A. R., 2014, ApJ, 797, 13
- Sharma et al. (2017) Sharma M., Theuns T., Frenk C., 2017, preprint, (arXiv:1712.05811)
- Sharma et al. (2018) Sharma S., et al., 2018, MNRAS, 473, 2004
- Sherwood & Plaut (1975) Sherwood V. E., Plaut L., 1975, Variable Stars and Stellar Evolution. Vol. 67, Springer Science & Business Media
- Silva Aguirre et al. (2015) Silva Aguirre V., et al., 2015, MNRAS, 452, 2127
- Sneden et al. (1996) Sneden C., McWilliam A., Preston G. W., Cowan J. J., Burris D. L., Armosky B. J., 1996, ApJ, 467, 819
- Sneden et al. (1997) Sneden C., Kraft R. P., Shetrone M. D., Smith G. H., Langer G. E., Prosser C. F., 1997, AJ, 114, 1964
- Soderblom (2010) Soderblom D. R., 2010, ARA&A, 48, 581
- Soszyński et al. (2011) Soszyński I., et al., 2011, Acta Astron., 61, 1
- Sparre et al. (2017) Sparre M., Hayward C. C., Feldmann R., Faucher-Giguère C.-A., Muratov A. L., Kereš D., Hopkins P. F., 2017, MNRAS, 466, 88
- Starkenburg et al. (2017a) Starkenburg E., Oman K. A., Navarro J. F., Crain R. A., Fattahi A., Frenk C. S., Sawala T., Schaye J., 2017a, MNRAS, 465, 2212
- Starkenburg et al. (2017b) Starkenburg E., et al., 2017b, MNRAS, 471, 2587
- Stello et al. (2015) Stello D., et al., 2015, ApJ, 809, L3
- Stinson et al. (2009) Stinson G. S., Dalcanton J. J., Quinn T., Gogarten S. M., Kaufmann T., Wadsley J., 2009, MNRAS, 395, 1455
- Strömgren (1963) Strömgren B., 1963, QJRAS, 4, 8
- Su et al. (2017) Su K.-Y., Hopkins P. F., Hayward C. C., Faucher-Giguère C.-A., Kereš D., Ma X., Robles V. H., 2017, MNRAS, 471, 144
- Tornatore et al. (2007) Tornatore L., Ferrara A., Schneider R., 2007, MNRAS, 382, 945
- Trenti et al. (2009) Trenti M., Stiavelli M., Michael Shull J., 2009, ApJ, 700, 1672
- Tumlinson (2010) Tumlinson J., 2010, ApJ, 708, 1398
- Van Der Walt et al. (2011) Van Der Walt S., Colbert S. C., Varoquaux G., 2011, preprint, (arXiv:1102.1523)
- Walker & Terndrup (1991) Walker A. R., Terndrup D. M., 1991, ApJ, 378, 119
- Wallerstein (1962) Wallerstein G., 1962, ApJS, 6, 407
- Wallerstein et al. (1963) Wallerstein G., Greenstein J. L., Parker R., Helfer H. L., Aller L. H., 1963, ApJ, 137, 280
- Wetzel et al. (2016) Wetzel A. R., Hopkins P. F., Kim J.-h., Faucher-Giguère C.-A., Kereš D., Quataert E., 2016, ApJ, 827, L23
- White & Springel (2000) White S. D. M., Springel V., 2000, in Weiss A., Abel T. G., Hill V., eds, The First Stars. p. 327 (arXiv:astro-ph/9911378), doi:10.1007/10719504_62
- Winteler et al. (2012) Winteler C., Käppeli R., Perego A., Arcones A., Vasset N., Nishimura N., Liebendörfer M., Thielemann F.-K., 2012, ApJ, 750, L22
- Wise et al. (2012) Wise J. H., Turk M. J., Norman M. L., Abel T., 2012, ApJ, 745, 50
- Worley et al. (2013) Worley C. C., Hill V., Sobeck J., Carretta E., 2013, A&A, 553, A47
- Yong et al. (2013) Yong D., et al., 2013, ApJ, 762, 26
- Youakim et al. (2017) Youakim K., et al., 2017, MNRAS, 472, 2963
Appendix A Effect of diffusion coefficient and resolution
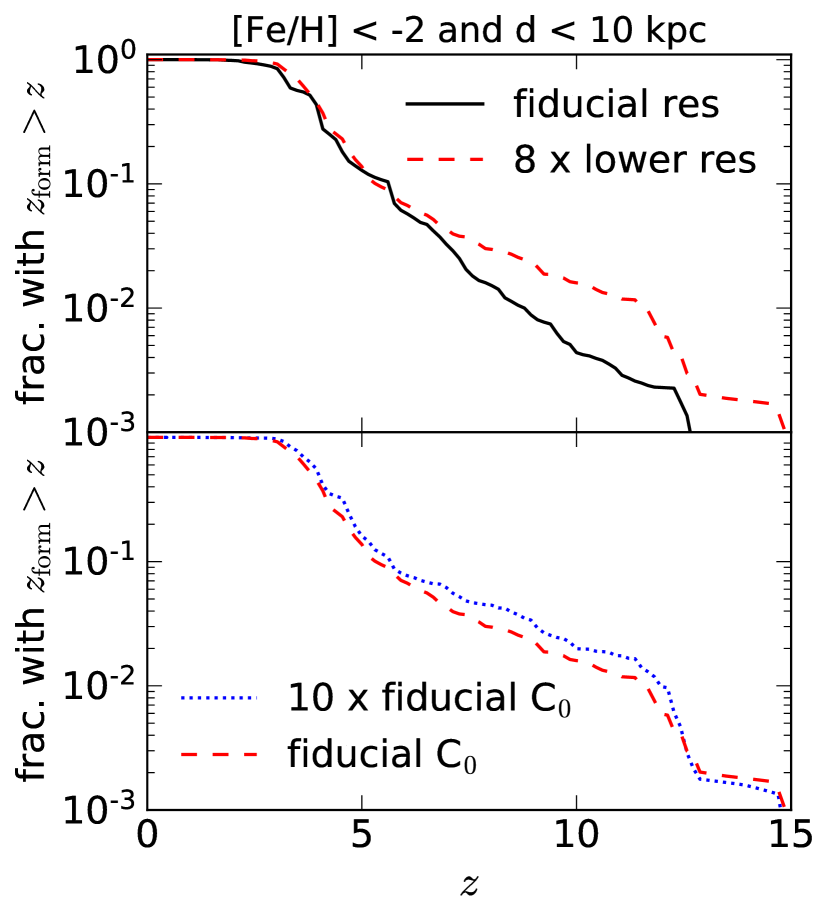
Figure 13 shows the effect of varying the simulation mass resolution (top panel) and the turbulent diffusion coefficient (bottom panel). The quantity plotted is the fraction of stars within 10 kpc of the solar neighborhood with that formed before a given redshift, identical to the right panel of Figure 2. We compare three different versions of the m12i simulation. The fiducial version analyzed throughout the text (black line) has a baryon mass resolution of and uses a diffusion coefficient C (see Hopkins et al. 2017a for details).
In the top panel, we compare this run to one with 8 times lower mass resolution () and the same diffusion coefficient and critical density for star formation as the fiducial run. For stars formed after , the fraction of metal-poor stars that formed before a given redshift agrees between the two resolution levels within 20%. At higher , the predictions of the two resolution levels disagree more significantly, with a maximum discrepancy of a factor of 5. The fraction of metal-poor stars that are very old is higher in the lower-resolution run. We find that the total age distribution of ancient stars is similar in the high- and low-resolution runs. Typical metallicities of the most ancient stars are higher in the high-resolution run, indicating that gas is enriched somewhat more rapidly at high resolution.
The bottom panel compares two runs with the same mass resolution () and different diffusion coefficients. The red dashed line is the same as in the top panel, while the blue line has a diffusion coefficient that is 10 times larger. Consistent with Escala et al. (2018), we find that the simulation predictions are not very sensitive to the choice of diffusion coefficient: the fraction of metal-poor stars that formed before a given always agrees within % across the two simulations. We also find that the two simulations’ stellar metallicity distributions (Figure 3) are in good agreement at all redshifts.