Dissolved Massive Metal-Rich Globular Clusters can cause the Range of UV Upturn Strengths found among Early-Type Galaxies
Abstract
I discuss a scenario in which the ultraviolet (UV) upturn of giant early-type galaxies (ETGs) is primarily due to helium-rich stellar populations that formed in massive metal-rich globular clusters (GCs) which subsequently dissolved in the strong tidal field in the central regions of the massive host galaxy. These massive GCs are assumed to show UV upturns similar to those observed recently in M87, the central giant elliptical galaxy in the Virgo cluster of galaxies. Data taken from the literature reveals a strong correlation between the strength of the UV upturn and the specific frequency of metal-rich GCs in ETGs. Adopting a Schechter function parametrization of GC mass functions, simulations of long-term dynamical evolution of GC systems show that the observed correlation between UV upturn strength and GC specific frequency can be explained by variations in the characteristic truncation mass such that increases with ETG luminosity in a way that is consistent with observed GC luminosity functions in ETGs. These findings suggest that the nature of the UV upturn in ETGs and the variation of its strength among ETGs are causally related to that of helium-rich populations in massive GCs, rather than intrinsic properties of field stars in massive galactic spheroids. With this in mind, I predict that future studies will find that [N/Fe] decreases with increasing galactocentric radius in massive ETGs, and that such gradients have the largest amplitudes in ETGs with the strongest UV upturns.
Subject headings:
galaxies: stellar content — galaxies: bulges – galaxies: star clusters: general — globular clusters: general1. Introduction
Starting in the 1970’s, various ultraviolet (UV) space observatory missions have firmly established that luminous early-type galaxies (hereafter ETGs) and bulges of spiral galaxies feature far-UV (FUV) emission whose strength rises shortwards of 2000 Å (e.g., Code & Welch, 1979; Bertola, 1980; Burstein et al., 1988; O’Connell et al., 1992; Dorman et al., 1995; Brown et al., 1997). This phenomenon is widely known as the “UV upturn,” which was originally unexpected because ETGs were generally believed to be old “red and dead” stellar populations.
Studies of the UV-to-optical spectral energy distribution of ETGs showed that the UV upturn is well-fit by a narrow range of effective temperatures between 20,000 and 25,000 K (e.g., Brown et al., 1997). It is commonly believed that the UV upturn in ETGs is mainly produced by extreme horizontal branch (EHB) stars, also known as hot subdwarfs, and their progeny (see, e.g., the reviews by O’Connell 1999 and Yi 2008). These are helium-core-burning stars with extremely thin hydrogen envelopes. Various scenarios for their formation have been proposed: strong mass loss on the red giant branch (RGB; this likely mainly occurs at high metallicity, see Greggio & Renzini 1990), high helium abundance (e.g., Dorman et al., 1995; Yi et al., 1997), and/or mass transfer of RGB envelopes in binary systems (Han et al., 2007).
Important constraints to the nature of the UV upturn in nearby ETGs were introduced by Burstein et al. (1988) who showed that the color (hereafter ) anticorrelates strongly with both velocity dispersion () and the Lick Mg2 absorption-line index. Since the latter was thought to be mainly a metallicity indicator and because also correlates strongly with Mg2, Burstein et al. argued that stellar metallicity is the fundamental parameter underlying these relations.
Another key feature of the UV upturn in ETGs is that its spatial distribution is more centrally concentrated than the optical light (Ohl et al., 1998; Carter et al., 2011). As such, matching of measurement apertures between the FUV and other wavelengths is important in the interpretation of correlation studies. This point proved to be relevant in understanding apparent inconsistencies between different studies of the versus Mg2 relation using the GAlaxy Evolution eXplorer (GALEX; Martin et al., 2005): Rich et al. (2005) used a sample of ETGs covering a significant range of distances () along with fixed measurement apertures and did not recover the Burstein et al. (1988) relation. However, several other studies used samples of ETGs for which UV and optical measurement apertures were matched on a galaxy-by-galaxy basis (Bureau et al., 2011; Jeong et al., 2012) or samples of cluster galaxies to eliminate the distance effect (Boselli et al., 2005; Smith et al., 2012a). The latter studies all do recover the Burstein et al. (1988) relation (some using the Mg index rather than Mg2). Other relations between UV upturn and ETG parameters that were established by these studies were anticorrelations of with , age, total metallicity [/H] and -element abundance enhancement [/Fe]. These anticorrelations are not expected in the scenario where hot subdwarfs are produced by strong mass transfer of RGB envelopes in binaries, in which the dependence of on age and metallicity is insignificant (Han et al., 2007). Consequently, many recent studies of the UV upturn have concentrated on the single-star mechanisms (but see Section 5.1.1).
A pivotal discovery in the context of the nature of the UV upturn was that of massive FUV-bright globular clusters (GCs) in M87, the central galaxy of the Virgo cluster111To date, M87 is the only ETG with a UV upturn for which FUV photometry of GCs has been published. (Sohn et al. 2006; see also Peacock et al. 2017). Many of those GCs in M87 were found to feature colors similar to, or even bluer than, ETGs with the strongest UV upturns. Interestingly, several massive metal-rich GCs in M87 have both and colors consistent with those of massive ETGs222In contrast, the metal-poor GCs in M87 generally feature bluer UV – optical colors than those of ETGs with UV upturns, especially in , which is likely due to metallicity-dependent line blanketing in the NUV (e.g., Dorman et al., 1995).. Among metal-rich GCs in our Galaxy, this behavior is only seen in NGC 6388 and NGC 6441, two massive GCs with very hot EHBs (see Rich et al., 1997), which are thought to be due to a high He abundance in a significant fraction of their constituent stars (Caloi & D’Antona, 2007; Tailo et al., 2017).
In fact, a myriad of recent studies of multiple stellar populations in GCs in the Local Group revealed that light-element abundance variations within massive GCs are the norm rather than the exception (see, e.g., the review by Gratton et al., 2012). The strongest abundance patterns emerging from spectroscopic studies of GCs are that [Na/Fe] correlates with [N/Fe] and generally anticorrelates with [O/Fe] and [C/Fe] (e.g., Sneden et al., 1992; Roediger et al., 2014). These patterns are thought to be the result of proton-capture reactions at K such as the CNO and NeNa cycles (e.g., Gratton et al., 2012). The material responsible for these abundance variations is generally thought to originate in winds of stars massive enough to host such high temperatures in their interiors (“polluters”). Subsequent episodes of star formation in GCs with masses and escape velocities high enough to retain these winds may have caused the abundance variations seen today within such GCs (see, e.g., D’Ercole et al., 2008; Goudfrooij et al., 2011; Conroy, 2012; Renzini et al., 2015).
Recent studies have shown that GC mass is indeed an important parameter in the context of light-element abundance variations in GCs. Its relevance was first suggested by the results of Carretta et al. (2010), who showed that the extent of the Na–O anticorrelation within GCs scales with GC mass. More recently, Milone et al. (2017) studied high-precision Hubble Space Telescope (HST) photometry of RGB stars in 57 Galactic GCs using a selection of filters that emphasizes abundance spreads in N and O. They found a strong correlation between the fraction of stars enhanced in [N/Fe] and the GC mass. Furthermore, studies using integrated-light spectroscopy of GCs in M31 and our Galaxy show a similarly strong correlation between overall [N/Fe] and GC mass (Schiavon et al. 2013; T. H. Puzia & P. Goudfrooij 2018, in preparation).
Importantly with regard to the UV upturn, the proton-capture processes at high temperatures that produce enhancements in [N/Fe] and [Na/Fe] also produce He enhancement, one of the main contenders for producing the hot EHB stars in GCs, including those in M87 (see Kaviraj et al., 2007). While direct measurements of the He abundance (hereafter ) are generally difficult to obtain for stellar populations, it is well known that increases in cause hotter and bluer main sequences in color-magnitude diagrams (e.g., Dotter et al., 2007; Piotto et al., 2007; Cassisi et al., 2017). This effect was used by Milone (2015) to show that the spread in found within Galactic GCs is strongly correlated with GC mass, similar to the case of [N/Fe] spread mentioned above. This correlation is consistent with recent photometric studies of HB stars in GCs using HST, which clearly indicate a need for significant He enhancement to fit the multi-color photometry of the HBs in the most massive GCs and to explain the finding that the hottest types of HB stars (“blue-hook stars”) exist only in the most massive GCs (Brown et al., 2010, 2016).
In this paper, we investigate the idea that there is a physical connection between the UV upturn in ETGs and the He-enhanced populations in massive GCs. This connection was suggested earlier: Chung et al. (2011) constructed simple stellar population (SSP) models including effects of He enhancement and showed that the UV upturns of ETGs are well fit by their models, while Bekki (2012) studied this connection using numerical simulations. Here, we explore the possibility that the range of UV upturn strengths found among ETGs is caused by He-rich stars formed in massive GCs that subsequently disrupted in the strong tidal field of the inner regions of their host galaxies.
2. GC Systems in Early-Type Galaxies
While GCs typically constitute a very small fraction of the stellar mass in “normal” galaxies, their properties contain important clues to the assembly histories of their host galaxies. Infrared studies of star formation within molecular clouds have shown that stars typically form in a clustered fashion (bound clusters or unbound associations; Lada & Lada, 2003; Portegies Zwart et al., 2010). Most star clusters with initial masses are thought to evaporate into the field population of galaxies within a few Gyr, but the currently surviving massive GCs represent important probes of the chemical evolution occurring during the main epochs of star formation within a galaxy’s assembly history.
One of the most studied observational parameters in the context of the GC–galaxy connection is the specific frequency of GCs (hereafter ). This parameter was introduced by Harris & van den Bergh (1981), who defined it as the number of GCs per unit galaxy luminosity in units of . essentially measures the number of GCs that survived dynamical evolution over the galaxy’s lifespan relative to the total luminosity of stars that evaporated out of star clusters or associations during that period. As such, its value is determined by the shape of the initial cluster mass function (ICMF) and the time-dependent effects of dynamical evolution of GCs.333This is discussed further in Sections 4.1 and 5.1.
Several studies have established that varies greatly among galaxies. The general trend among massive galaxies is that increases significantly with increasing galaxy luminosity: for the most luminous ETGs (with ) is a factor of 5 higher on average than that for ETGs with (Peng et al., 2008). Conversely, the trend is opposite among galaxies fainter than , for which increases with decreasing galaxy luminosity, with several faint dwarf galaxies with showing values larger than those of the most luminous ETGs (e.g., Forbes, 2005; Miller & Lotz, 2007; Peng et al., 2008; Georgiev et al., 2010; Harris et al., 2013).
Deep imaging studies with the HST and large ground-based telescopes have shown that “normal” luminous ETGs typically contain rich GC systems featuring wide, bimodal optical color distributions (e.g., Brodie & Strader, 2006; Peng et al., 2006). Spectroscopy showed that such GCs are nearly universally old ( Gyr), independent of their color (e.g., Puzia et al., 2005; Brodie et al., 2012), implying that their colors mainly indicate differences in metallicity. The “red” GCs feature colors and spatial distributions that generally follow those of the underlying spheroid light (i.e., the “bulge”), while the “blue” GC subsystems typically show much more extended (“halo-like”) spatial distributions, consistent with those of metal-poor GCs in our Galaxy and M31 (e.g., Geisler et al., 1996; Rhode & Zepf, 2004; Brodie & Strader, 2006; Harris et al., 2010; Puzia et al., 2014). The overall number ratio (red)/(blue) changes with ETG mass or luminosity. Low-mass ETGs with host virtually only blue GCs. For more massive ETGs, the fraction of red GCs increases with galaxy luminosity up to , beyond which it decreases again due to large numbers of blue GCs, mainly located in the outer regions of the most massive ETGs (Peng et al., 2008).
The general picture that has emerged from these studies is that the blue GCs are likely to represent remnants of the earliest stages of hierarchical merging of gas-rich, metal-poor protogalactic dwarfs, which caused high GC formation rates in regions with high star formation rate surface density (e.g., Burgarella et al., 2001; Moore et al., 2006; Peng et al., 2008), while the red GCs were formed during mergers of more massive gas-rich galaxies at high redshift (e.g., Peng et al., 2008; Kruijssen, 2015), perhaps situated within more massive halos that were able to retain the chemically enriched gas outflows from earlier star formation episodes. The large numbers of blue GCs found in the outskirts of the most massive ETGs likely reflect relatively large numbers of accreted dwarf galaxies, while the increase in of red GCs with increasing ETG luminosity is thought to indicate an increasing mass fraction of higher-mass protogalaxies that underwent starbursts at high SFR surface density (Ashman & Zepf, 1992; Peng et al., 2008; Kruijssen, 2015).
3. Relations between UV Upturn Strength and Population and GC System Properties
To explore the relevance of the specific frequency of GCs in the production of the UV upturn in ETGs, we select two samples of nearby ETGs based on their source of UV data (IUE vs. GALEX) and the availability of dynamical and stellar population properties as well as GC specific frequency data for both metal-poor and metal-rich GC subpopulations in the literature.
The first sample is a subset of that studied by Dorman et al. (1995), using the aperture-matched IUE, -band, and Mg2 data from Burstein et al. (1988). We remove galaxies with strong dust extinction in their inner regions, since this renders a significant uncertainty to their intrinsic colors. This eliminates the galaxies NGC 1052, NGC 2768, NGC 4111, NGC 4125, NGC 4278, NGC 4374, and NGC 5846 (Hansen et al., 1985; Goudfrooij et al., 1994b; van Dokkum & Franx, 1995; Goudfrooij & Trinchieri, 1998; Martel et al., 2004; Lauer et al., 2005; Masegosa et al., 2011). The resulting sample is henceforth referred to as the “IUE sample.” Stellar population parameters for eight galaxies in the IUE sample are taken from Thomas et al. (2005), using spectroscopic measurements of indices H, Mg, Fe5270, and Fe5335 in the Lick system within an aperture of , where is the effective radius of the galaxy. The ages, metallicities ([/H]) and [/Fe] ratios are determined using the SSP models of Thomas et al. (2003). For the nine other galaxies in the IUE sample, we use Lick-system line index measurements from other studies (see Table 1) and use the Thomas et al. (2003) SSP models to place their SSP-equivalent ages, [/H], and [/Fe] measurements in the same system as that of Thomas et al. (2005), using linear interpolation between the model grid points. In this context we use the diagram of (= ) versus Mg to provide a first estimate of the [/Fe] ratio, and the [MgFe]′ versus H diagram to estimate the ages and [/H] values.444The [MgFe]′ index was chosen because of its independence of variations in [/Fe] ratio and IMF slope (Thomas et al., 2003; Vazdekis et al., 2010). The three population parameters are then modified using a small grid around the first estimates, and the best error-weighted fit to H, Mg, and is selected.
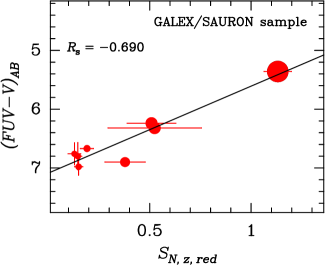
The second sample of galaxies is taken from the SAURON project (e.g., de Zeeuw et al., 2002), for which GALEX images and optical spectroscopy were analyzed by Bureau et al. (2011) and Jeong et al. (2012), using measurements in an aperture of for each galaxy.
For both galaxy samples, specific frequencies of metal-rich (red) GCs are taken from recent papers in the literature that used high-quality GC colors from data taken with the Advanced Camera for Surveys (ACS) aboard HST. References are given in Tables 1 and 2 for the IUE and SAURON samples, respectively. For the Fornax ellipticals NGC 1399 and NGC 1404 in the IUE sample, we determine metal-rich GC fractions from the GC photometry tables of the ACS Fornax Cluster Survey (see Jordán et al., 2015). To stay consistent with the results for Virgo galaxies by the ACS Virgo Cluster Survey, we adopt the procedures and GC selection criteria of Peng et al. (2006) in this context. Briefly, to establish red GC fractions (designated in Tables 1 and 2), we apply the Kaye’s Mixture Model (KMM, McLachlan & Basford, 1988; Ashman et al., 1994) to fit two Gaussians to the GC color distribution using the homoscedastic case, where is the same for both Gaussians. Specific frequencies of red GCs were determined following Peng et al. (2008), normalizing the derived number of such GCs in the galaxy by the galaxy luminosity in the SDSS (Sloan Digital Sky Survey) passband (similar to the F850LP passband of HST/ACS):
| (1) |
For galaxies in the ACS Virgo Cluster Survey, we adopt the total -band magnitudes in the AB system from Peng et al. (2008). For other galaxies with data that were derived from total -band luminosities in the literature, integrated colors are determined in two different ways. For NGC 4889, we simply use the observed integrated color from Eisenhardt et al. (2007), assuming . For the other galaxies, -band photometry is not available and we use high-quality integrated colors in other passbands along with the SSP models of Bruzual & Charlot (2003, hereafter BC03) to estimate as follows. We use NED to obtain the integrated colors from Persson et al. (1979) for the southern galaxies, and for NGC 5982. We then determine , , and from a large set of spectral energy distributions from the BC03 SSP models555This grid of models constituted ages Gyr and . using the synphot package within IRAF/STSDAS. Finally, we derive second-order polynomial relations between those colors to derive from or . The RMS errors of these relations are 0.008 mag between and and 0.005 mag between and .
| NGC | Mg2 | [/H] | [/Fe] | Age | Ref. | Ref. | ||||||
|---|---|---|---|---|---|---|---|---|---|---|---|---|
| (1) | (2) | (3) | (4) | (5) | (6) | (7) | (8) | (9) | (10) | (11) | (12) | (13) |
| 221 | 4.500.17 | 0.1980.002 | 0.1520.030 | 0.0250.013 | 2.40.2 | 1 | 652 | 4312 | — | — | — | — |
| 224 | 3.460.17 | 0.3240.002 | 0.4410.048 | 0.2190.017 | 7.00.8 | 1 | 1544 | 7440 | — | — | — | — |
| 584 | 3.930.17 | 0.2980.004 | 0.4780.046 | 0.2230.014 | 2.80.3 | 1 | 1994 | 72 5 | — | — | — | — |
| 1399 | 2.040.17 | 0.3570.008 | 0.560.12 | 0.350.04 | 10.01.4 | 2 | 3325 | 3722 | 11.51.0 | 4.000.35 | 0.63 | 1 |
| 1404 | 3.260.17 | 0.3440.007 | 0.430.09 | 0.180.03 | 8.91.3 | 2 | 2274 | 9619 | 2.00.5 | 0.770.20 | 0.56 | 1 |
| 1407 | 2.400.17 | 0.3410.010 | 0.290.13 | 0.380.08 | 17.03.4 | 3 | 2665 | 3526 | 4.01.3 | 1.790.58 | 0.62 | 2 |
| 2784 | 3.650.25 | 0.3340.007 | 0.670.07 | 0.230.07 | 4.50.8 | 4 | 2226 | 17319 | — | — | — | — |
| 3115 | 3.400.17 | 0.3090.006 | 0.200.06 | 0.080.05 | 17.04.7 | 4 | 2593 | 106 5 | 2.30.5 | 0.980.21 | 0.35 | 3 |
| 3379 | 3.820.17 | 0.3290.006 | 0.2990.036 | 0.2590.012 | 10.01.1 | 1 | 2032 | 5211 | — | — | — | — |
| 4472 | 3.390.17 | 0.3310.005 | 0.3420.046 | 0.2580.021 | 9.61.4 | 1 | 2823 | 5020 | 5.400.57 | 2.200.23 | 0.29 | 4 |
| 4494 | 3.770.17 | 0.2930.009 | 0.120.03 | 0.140.02 | 14.02.9 | 4 | 1483 | 6914 | — | — | — | — |
| 4552 | 2.320.17 | 0.3460.006 | 0.3560.034 | 0.2770.011 | 12.41.5 | 1 | 2503 | 610 | 2.820.57 | 1.150.23 | 0.53 | 4 |
| 4621 | 3.140.17 | 0.3550.009 | 0.650.09 | 0.300.08 | 5.61.2 | 4 | 2284 | 10922 | 2.701.19 | 1.070.47 | 0.49 | 4 |
| 4649 | 2.200.17 | 0.3600.006 | 0.3620.029 | 0.2960.012 | 14.11.5 | 1 | 3315 | 5522 | 5.161.20 | 2.030.47 | 0.57 | 4 |
| 4697 | 3.410.17 | 0.3200.006 | 0.1480.043 | 0.1550.018 | 8.31.4 | 1 | 1652 | 10529 | — | — | — | — |
| 4762 | 3.680.17 | 0.2800.006 | 0.230.05 | 0.120.05 | 8.82.5 | 4 | 1414 | 11019 | — | — | — | — |
| 4889 | 2.710.17 | 0.3560.008 | 0.290.03 | 0.280.01 | 15.52.9 | 5 | 3935 | 717 | 5.50.1 | 1.970.10 | 0.60 | 5 |
| NGC | Age | Ref. | ||||||
|---|---|---|---|---|---|---|---|---|
| (1) | (2) | (3) | (4) | (5) | (6) | (7) | (8) | (9) |
| 474 | 6.760.19 | 8.891.54 | 1543 | 30 6 | 2.100.50 | 0.990.24 | 0.13 | 1 |
| 4387 | 6.980.14 | 10.341.79 | 1003 | 58 6 | 1.520.21 | 0.650.09 | 0.23 | 2 |
| 4473 | 6.900.06 | 11.762.03 | 1793 | 57 6 | 1.980.51 | 0.880.23 | 0.43 | 2 |
| 4486 | 5.360.07 | 17.702.04 | 3234 | 2021 | 12.590.77 | 4.190.25 | 0.27 | 2 |
| 4570 | 6.670.05 | 12.822.22 | 1875 | — | 1.090.18 | 0.530.09 | 0.36 | 2 |
| 4621 | 6.320.06 | 13.672.36 | 2284 | 10922 | 2.701.19 | 1.070.47 | 0.49 | 2 |
| 4660 | 6.800.23 | 12.552.05 | 1923 | 14514 | 2.970.41 | 1.120.15 | 0.13 | 2 |
| 5982 | 6.240.07 | 8.900.90 | 2424 | 4626 | 2.600.60 | 1.060.25 | 0.48 | 1 |
Figure 1 shows versus the various stellar population parameters, the central velocity dispersion from HyperLeda, and for the IUE sample. Note that the magnitudes from Dorman et al. (1995) were transformed to in the AB magnitude system using . The Spearman rank correlation coefficient is mentioned for each relation in the various panels. is measured and shown twice for each relation: once for all galaxies in the sample, and once for the galaxies with SSP-equivalent ages of Gyr. This was done because the latter is thought to be the approximate age at which single EHB stars start producing the UV upturn feature as observed (e.g., Chung et al., 2017), and EHB stars are generally recognized to dominate the FUV luminosity of giant ETGs.
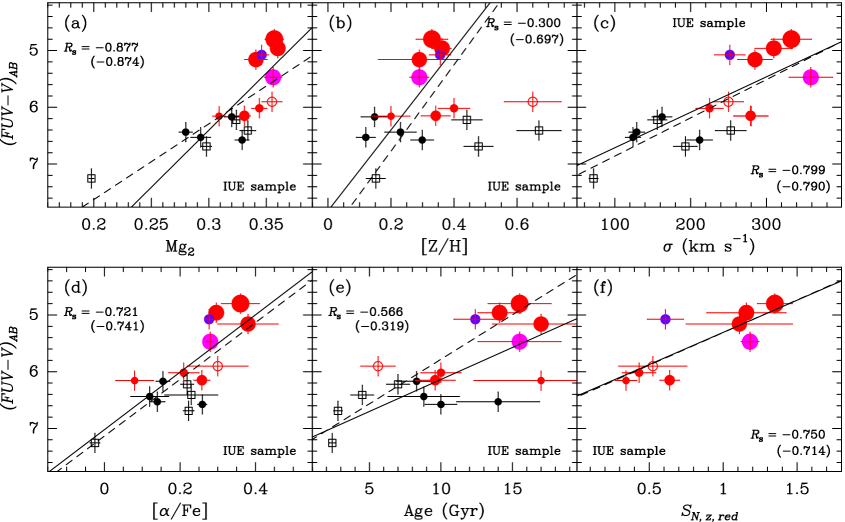
Focusing on panels (a), (b), (d), and (e) of Figure 1 (i.e., the stellar population parameters for the IUE sample), it can be seen that the well-known anticorrelation between and Mg2 does not translate to a significant anticorrelation between and [/H] when taking all galaxies into account. However, the main outliers in this relation all have SSP-equivalent ages Gyr and high [/H], and does anticorrelate with [/H] when considering only the galaxies with Gyr. Panel (e) reveals a significant anticorrelation between and SSP-equivalent age when considering all galaxies; however, this relation seems to be largely driven by the galaxies with ages Gyr, since the correlation weakens quite significantly when only considering the older galaxies. In this context, we remind the reader that the determinations of SSP-equivalent age of galaxies employed here are based on luminosity-weighted measurements of line indices in the blue and visual parts of the spectrum. Such age measurements are quite sensitive to the presence of young populations with small mass fractions (e.g., Thomas et al., 2003). As such, SSP-equivalent ages of galaxies formally measure lower limits to the average age. Finally, the anticorrelation between and [/Fe] shown in panel (d) is stronger than those between and either [/H] or SSP age. This suggests that, among the stellar population parameters, [/Fe] seems to be the strongest driver of the vs. Mg2 anticorrelation, even though it seems probable that [/H] and age also have some influence. Panel (c) of Figure 1 shows the well-known strong anticorrelation of with central velocity dispersion, and hence with the depth of the potential well of the galaxy (and the surrounding galaxy group or cluster if present).
The trends and anticorrelations mentioned above are generally consistent with those found by other recent studies of the UV upturn among ETGs (e.g., Bureau et al., 2011; Carter et al., 2011; Jeong et al., 2012; Smith et al., 2012a), except that the anticorrelations found in the current paper are typically stronger than those in the other studies. We suggest that this may be due to the FUV emission in ETGs being more centrally concentrated than the -band light (Ohl et al., 1998; Carter et al., 2011). Thus, smaller measurement apertures in conjunction with aperture matching between measurements of the various population properties are likely to reveal stronger correlations between and other parameters. The IUE measurements were made through an aperture of which corresponds to a (circularized) radius in the approximate range to for most galaxies in the IUE sample666NGC 4889 is an exception due to its distance being times larger than that of all other galaxies in the IUE sample. Hence it is assigned a different symbol in Figure 1. (see, e.g., Caon et al., 1993; Goudfrooij et al., 1994a). In contrast, the studies of the UV upturn in the SAURON sample (Bureau et al., 2011; Jeong et al., 2012) used measurements of within an aperture of for their correlation analysis, so that the influence of the FUV-emitting population can be expected to be somewhat diluted relative to the measurements of galaxies in the IUE sample.
4. GCs as a Source of far-UV flux in Galactic Spheroids
The anticorrelation of with reported here could in principle simply reflect the already known anticorrelation between and in conjunction with the correlation between and reported by Peng et al. (2008) for galaxies in the Virgo cluster with . However, the correlation between and is stronger than that between and . Furthermore, panels (a) – (e) of Figure 1 show that galaxies with the highest values of systematically have bluer colors than that indicated by the linear fits to the relations shown by the lines in each panel. At face value, this seems to suggest that has a causal anticorrelation with . With this in mind, we consider the hypothesis that the He-enhanced populations that are likely responsible for the UV upturn are produced in massive star clusters and subsequently disperse slowly into the field population of galaxies by means of dissolution of metal-rich GCs in the strong tidal field within the inner regions of luminous ETGs. This hypothesis is explored below.
4.1. Long-term Dissolution of Metal-Rich GCs
4.1.1 Empirical Evidence
First, we describe empirical evidence for significant amounts of mass loss from metal-rich GCs in the central regions of massive ETGs. Several studies of GC systems around ETGs have shown that surface number density profiles of metal-rich GCs outside 1 typically follow the surface brightness profile of the host galaxy, while the metal-poor GCs have a much shallower profile (e.g., Geisler et al., 1996; Forbes et al., 1998; Rhode & Zepf, 2004; Dirsch et al., 2005; Bassino et al., 2006; Harris et al., 2010; Strader et al., 2011). As such, metal-rich GCs are thought to be physically associated with the luminous component of the galaxies (“bulge”), while the metal-poor GCs are more of a “halo”-like population. Recent studies of nearby ETGs have shown that this difference in radial distribution between metal-rich and metal-poor populations is shared by the field stars (Harris et al., 2007; Rejkuba et al., 2014; Peacock et al., 2015). In fact, these studies found the fraction of metal-poor field stars in the inner regions of ETGs to be even lower than one would predict based on the difference in radial number density profiles between metal-rich and metal-poor GCs mentioned above.
However, HST studies of “normal,” old ETGs have shown that the surface number densities of metal-rich GCs are significantly depleted in the central regions relative to the galaxy light profile (e.g., Forbes et al., 2006; Peng et al., 2006; Harris et al., 2017). Interestingly, this depletion is much weaker for early-type merger remnant galaxies such as NGC 1316 (Goudfrooij et al., 2001) and NGC 3610 (Goudfrooij et al., 2007), which are only a few Gyr old, so that dynamical evolution of GCs has had much less time to disperse their stars into the field. It thus seems fair to suggest that these depletions of the surface number densities of metal-rich GCs toward the galaxy centers are due to dynamical evolution (two-body relaxation (or “evaporation”) and tidal shocking) in the central regions.
4.1.2 Quantitative Estimates
To estimate the amount of GC mass loss occurring in the inner regions of ETGs, we proceed as follows. We assume that GCs are tidally limited, meaning that their average mass densities are determined by the galaxy density inside their orbits (e.g., King, 1962). For simplicity, we assume circular orbits, and we follow Fall & Zhang (2001) by relating the mass densities of GCs to their galactocentric radius in a steady-state isothermal potential with a fixed maximum velocity where is the galaxy’s maximum rotational velocity and is its central velocity dispersion. In this case, the mean evaporative mass loss rate of a cluster is given by
| (2) |
(see Equations (4) and (15) in Fall & Zhang, 2001). It should be emphasized that in Equation (2) likely represents a lower limit to the actual average mass loss rate of surviving metal-rich GCs since their birth. Under the assumption that metal-rich GCs were formed in situ during the star-forming era of massive building blocks of present-time giant ETGs, it is likely that disruption rates of GCs in such dense environments at high redshift were significantly higher than they are currently, due to the stronger tidal perturbations (this may especially be the case for the metal-rich GCs, see Kruijssen, 2015). Furthermore, application of Equation (2) neglects early mass loss by processes such as residual gas expulsion (Baumgardt et al., 2008) and ejection of stars from the cluster as it expands adiabatically after the death of the massive stars in the cluster (Hills, 1980). The rate of the latter type of mass loss is strongly dependent on the level of primordial mass segregation of the cluster (e.g., Vesperini et al., 2009).
4.2. Comparison with Radial Number Density Distributions
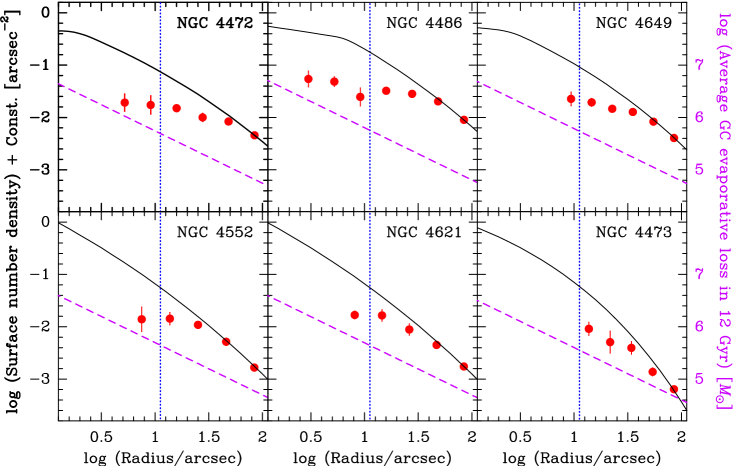
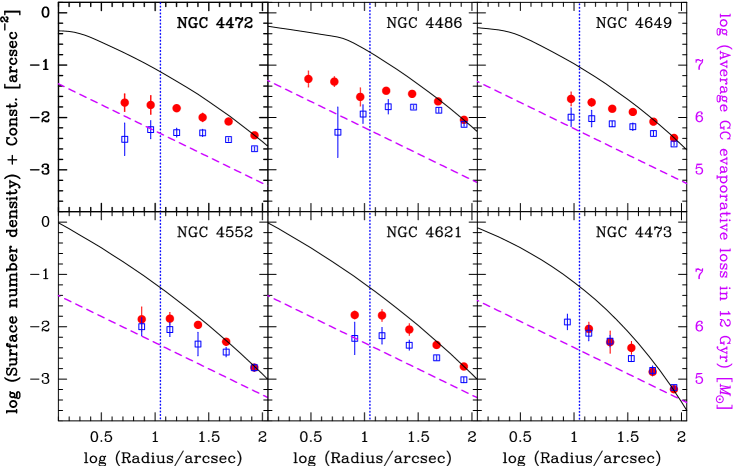
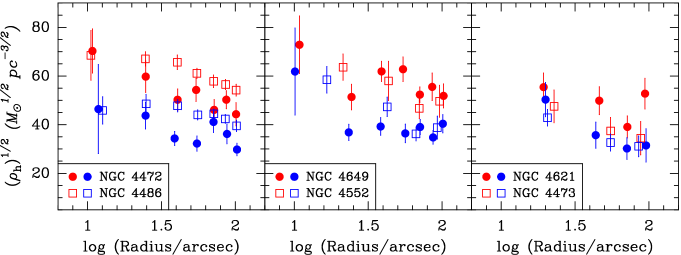
We compare the mass lost from GCs as a function of galactocentric radius as described above with the radial number density distributions of metal-rich GCs for six giant ETGs from the ACS Virgo Cluster Survey (ACSVCS; Côté et al., 2004; Jordán et al., 2009). These galaxies were selected for hosting GCs whose color distribution clearly shows two distinct peaks, facilitating a simple distinction between metal-poor and metal-rich GCs (see Goudfrooij & Kruijssen 2013 for the exact selection criteria). Four of these galaxies are in the IUE sample described in Section 3, while the other two (NGC 4473 and NGC 4486 = M87) are in the SAURON sample. Radial distributions of surface number densities of metal-rich GCs in these galaxies were derived from the tables in Jordán et al. (2009) as follows. GCs were first defined as sources to which Jordán et al. (2009) assigned a probability of being a GC of . To avoid incompleteness-related issues, we considered only GCs with , corresponding to the 90% completeness limit in the inner regions of the host galaxy with the highest central surface brightness. Completeness-corrected numbers of metal-rich GCs, , were determined in annuli with logarithmic spacing in galactocentric radius. These values were then divided by the area of the annuli, taking into account the limited azimuthal coverage of the outermost annuli. Figure 3 shows the surface number density distributions of the metal-rich GCs in these galaxies, along with the surface brightness profiles of the parent galaxy and the average amount of mass lost from GCs as a function of galactocentric radius during a time span of 12 Gyr according to Equation (2) for comparison purposes. Note that the surface number density profiles of metal-rich GCs flatten out significantly (relative to the surface brightness profile of the parent galaxy) inside of these galaxies, corresponding to kpc at the distance of the Virgo cluster (16.5 Mpc, see Jordán et al. 2009), where the typical evaporative mass lost from GCs over 12 Gyr according to Equation (2) (hereafter referred to as ) is of order . Furthermore, the level of depletion of the surface number densities of metal-rich GCs relative to the galaxy light increases toward smaller . This is consistent with the fact that increases to or beyond in those innermost regions: only the GCs with the highest initial masses have been able to survive dissolution by the strong tidal forces in those regions until the present time.
5. Feasibility of Proposed Scenario
5.1. Energetics
In this section we evaluate the feasibility of the hypothesis that He-rich EHB stars associated with (now mostly dissolved) massive metal-rich GCs can indeed produce the observed range of among giant ETGs. To do so, we use the observational results of the FUV emission of massive GCs in M87 from Sohn et al. (2006).
5.1.1 Required Numbers of GCs
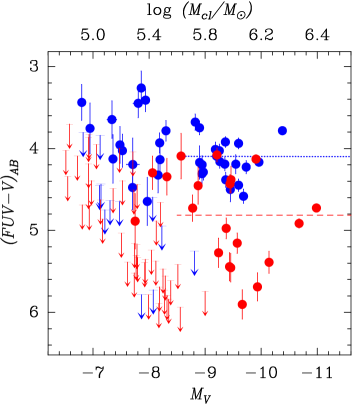
We first make the assumption that the FUV properties of the surviving metal-rich GCs constitute a suitable proxy for the GCs that dissolved over the last several Gyr. Since it is likely that the initial masses of the dissolved GCs were on average lower than those of the surviving GCs (at a given tidal field strength and evaporation rate, that is), the implicit assumption is that the dependence of on GC mass is small within the applicable range of GC masses. To assess the validity of this assumption, we plot versus for the M87 GCs from Sohn et al. (2006) in Figure 4.777Following Sohn et al. (2006), we use . To discriminate between metal-poor and metal-rich GCs in this context, we adopt the color threshold = 1.09 as determined by Kundu et al. (1999) whose HST/WFPC2 photometry was used by Sohn et al. (2006) as well. Current GC mass estimates are indicated in Figure 4, assuming a typical (Goudfrooij & Fall, 2016; Harris et al., 2017). Note that there is no significant mass dependence of for GCs with , corresponding to . This is the case for both the metal-poor and the metal-rich GCs. As such, the following calculations pertain to GCs with current masses . Among these massive metal-rich GCs in M87, we find a mean , corresponding to a mean mass . Their mean = 4.82 in AB mag, corresponding to in AB mag at the distance of the Virgo cluster.
A second assumption we make is that single He-rich EHB stars created in massive GCs are unlikely to be the only source of FUV luminosity in ETGs. For instance, the model of Han et al. (2007), i.e., hot helium-burning stars that have lost their hydrogen-rich envelopes in binary interactions (be it in GCs or in the field), may well provide a minimum strength of the UV upturn (or maximum , hereafter ) in ETGs. The model of Han et al. predicts in the range (with the precise value depending on the parameter values of the model), with a negligible dependence on age for ages Gyr. Interestingly, this range of is roughly consistent with the maximum value of seen in samples of ETGs (see Figure 1; Bureau et al., 2011; Jeong et al., 2012). With this in mind, we explore to what extent the range in seen among ETGs can be understood in terms of GC formation efficiencies and dynamical evolution of massive GCs.
The range of UV upturn strengths among ETGs in is 1.5 mag (see Figure 1; Bureau et al., 2011). Relevant ETGs representing the bottom and top of this range are NGC 4473 and NGC 4649, respectively.888We exclude the strong UV upturns in NGC 1399 and M87 from this exercise, since their FUV emission is due in part to unresolved nuclear emission (Carter et al., 2011). These two galaxies have the same SSP age to within the uncertainties as determined from their Lick indices (see Tables 1 and 2), suggesting that their production rates of EHB stars by stellar evolution are consistent with each other as well. Since NGC 4473 has = within (Bureau et al., 2011), it constitutes a relevant example of an ETG for which a significant fraction of the FUV luminosity may be due to hot subdwarf stars produced in binary systems. To derive within for NGC 4649, we download GALEX dataset GI3_041008_NGC4621 from the STScI/MAST GR6 archive, with an exposure time of 1658 s in the NUV and FUV passbands. This GALEX dataset is available at the MAST archive at doi.org/10.17909/T9V68G (catalog 10.17909/T9V68G). Following Bureau et al. (2011), we carry out surface photometry of NGC 4649 using the ellipse task in IRAF/STSDAS, using the NUV image to perform ellipse fitting followed by imposing those ellipses on the FUV image. For the sky background level we use the mean of unclipped mean values in 15 square apertures located around the galaxy, in regions free from stars or other galaxies. We adopt a photometric zero point of 18.82 mag (Morrissey et al., 2005), and correct the photometry for Galactic extinction using the value from Schlegel et al. (1998) as mentioned in NED in conjunction with the extinction law of Cardelli et al. (1989). To obtain -band photometry for NGC 4649, we use the -band surface photometry tables of Peletier et al. (1990) in conjunction with the colors from Burstein et al. (1987), interpolating in galactocentric radius. Adopting = 743 for NGC 4649 (Burstein et al., 1987), we obtain , , and = 5.51 within , i.e., 1.39 mag bluer in than NGC 4473.
To determine how many “average” FUV-bright massive metal-rich GCs as seen in M87 are needed to produce the “extra” FUV luminosity in NGC 4649 relative to NGC 4473, we iteratively add such GCs (for which and , see above) to NGC 4473 and re-evaluate its integrated and until we produce a galaxy with = 5.51. We find that this would require 7789 such GCs. These would produce , which is 1.60 mag fainter than the actual light within in NGC 4649, equivalent to a -band luminosity fraction .
In conclusion, the range in seen among ETGs can be produced by (currently largely dissolved) FUV-bright GCs similar to those seen in M87 with numbers of such GCs that produce -band luminosity fractions up to .
5.1.2 Consistency with GC Mass Loss Scenario
One might wonder whether this range of is consistent with that expected from GC mass loss over a time span similar to the age of such galaxies (for which we adopt 12 Gyr as before). To address this question, we use the semi-analytical dynamical evolution model of Goudfrooij & Fall (2016). As commonly done in star cluster evolution modeling, we adopt a Schechter (1976) function for the initial cluster mass function (ICMF):
| (3) |
where is the initial cluster mass, and the adjustable parameters are , , and . The ICMF has a power-law shape with exponent below to mimic the observed mass functions (MFs) of young cluster systems (e.g., Zhang & Fall, 1999; Chandar et al., 2010; Portegies Zwart et al., 2010; Whitmore et al., 2014), and it has an exponential decline above the “characteristic truncation mass” as suggested by the observed tail of the GC mass function (GCMF) at for GC systems in ancient galaxies. Following Goudfrooij & Fall (2016), we incorporate mass loss by stellar evolution based on the BC03 models and we make the common assumption that the long-term dynamical mass loss of GCs is dominated by two-body relaxation (see also, e.g., Gnedin & Ostriker, 1997; Dinescu et al., 1999; Kruijssen, 2015). In that case, the evolving GCMF at time is
| (4) | |||||
(Goudfrooij & Fall, 2016) where is the evaporative mass loss rate (cf. Equation 2) and denotes the exponential dependence of the dissolution time on GC mass (i.e., ). for classical two-body relaxation as defined by Spitzer (1987) and others. While the actual value of is currently not well constrained for GCs with after a Hubble time of dynamical evolution (see discussion in Goudfrooij & Fall, 2016), the main effect of in the context of this study is that it yields slightly lower mass loss rates for low-mass clusters (i.e., GCs with ) relative to the case of 999This effect is not detectable in observations because the lower mass loss rates for those low-mass GCs result in higher ratios, and the two effects cancel out in luminosity functions (Goudfrooij & Fall, 2016). To maximize the mass loss rate for low-mass GCs relative to high-mass GCs, we choose . As such, the values for calculated below formally represent lower limits.
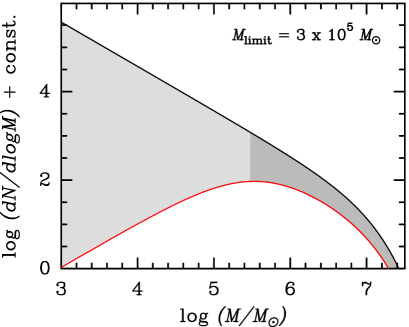
To convert to a mass fraction at = 12 Gyr, we assume a GC mass-independent , which is a good approximation to dynamical values determined by various studies of stellar kinematics in GCs (see Goudfrooij & Fall 2016, Harris et al. 2017, and references therein). We then determine for GCs above a given initial mass by integrating the ICMF (i.e., Equation 3) as well as Equation (4) for = 12 Gyr and evaluating the difference. This procedure is illustrated in Figure 5. This evaluation is done for several values of while varying and within ranges typically found among GCMF studies of massive galaxies ( and , see Jordán et al., 2007; McLaughlin & Fall, 2008; Chandar et al., 2010; Bastian et al., 2012; Goudfrooij & Fall, 2016; Johnson et al., 2017).
For the low-mass truncation of the power-law tail of the ICMF, many studies use which corresponds to the approximate minimum mass of a cluster for which the evaporation time scale is yr, the typical lifetime of open clusters in the solar neighborhood (Adams & Myers, 2001; Lada & Lada, 2003). However, metal-rich GCs in giant ETGs are generally thought to have formed in high-pressure environments similar to those seen in vigorously star-forming galaxies at high redshift (e.g., Ashman & Zepf, 1992; Kruijssen, 2015) where SFRs exceed and turbulent velocities are of order km s-1 (Law et al., 2009, 2012; Genzel et al., 2010; Tacconi et al., 2013). In such harsh environments, the crossing time of a (proto)cluster with a typical half-mass radius pc is only of order yr, which is 1 – 2 orders of magnitude shorter than in the solar neighborhood. Fokker–Planck modeling of GCs suggests that the evaporation time of a multi-mass cluster is of order where is the half-mass relaxation time of the cluster (e.g., Lee & Goodman, 1995). Since where is the number of stars in the cluster (Binney & Tremaine, 1987), it follows that for a cluster to survive evaporation over a star formation time scale of yr in such high-pressure environments, the requirement is , corresponding to cluster stars. With this in mind, we perform calculations of with . Results are shown in Figure 6. Panels (a) – (c) plot versus , while panels (d) – (f) plot versus , where , i.e., the value of relative to that for and .
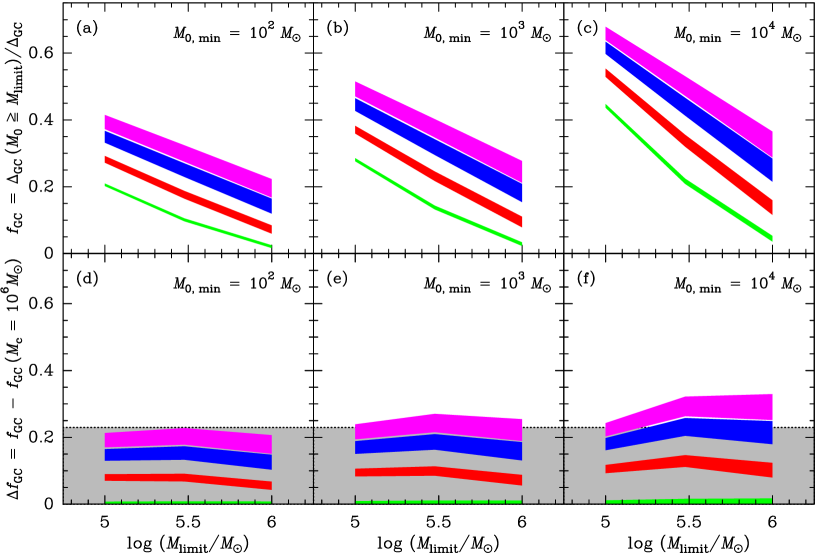
Note that the range of implied by the hypothesis that the range of seen among ETGs is produced by (now largely dissolved) massive metal-rich GCs in the inner regions can indeed be reproduced by dynamical evolution of such GCs under quite reasonable conditions. Specifically, we find that the range (cf. Section 5.1.1) is covered if is in the range . Encouragingly, this range of implied by our hypothesis is entirely consistent with results of fits of Equation (4) (for ) to observed GC luminosity functions (GCLFs) of giant ETGs, for which is found to increase with ETG luminosity and hence presumably also ETG mass (Jordán et al., 2007; Johnson et al., 2017)101010Note that the values for in Jordán et al. (2007) do not account for mass loss due to stellar evolution; the ones in Johnson et al. (2017) do.. Generally, Figure 6 shows that for ETGs with the weakest UV upturns is reached for low values for and/or , while values for strong UV upturns require higher values for and/or .
Summarizing this section, we find that the range of observed colors in the inner regions of nearby ETGs is consistent with our hypothesis that the range in seen among ETGs is produced by He-rich EHB stars associated with massive () metal-rich GCs, most of which have dissolved after 12 Gyr of dynamical evolution. The colors of ETGs with the weakest UV upturns and low values of are consistent with GCs that were formed in environments featuring relatively low SFRs, associated with relatively low characteristic truncation masses (), whereas the GCs in ETGs with the strongest UV upturns and high values were likely formed in vigorously star-forming environments where . This result is supported by the recent numerical simulations of GC formation at high redshift by Li et al. (2017), who found a correlation between and SFRs such that .
5.1.3 The Connection between and
While the previous section clarified that the range of implied by the observed range of among ETGs in the context of our hypothesis can be explained by a range in among ETGs similar to that observed, it does not directly explain how the observed anticorrelation between and seen in Figures 1 and 2 fits in with this scenario. This is addressed in this section.
Following the original definition of the specific frequency of GCs by Harris & van den Bergh (1981), values are determined by parameterizing the observed completeness-corrected GCLF as a Gaussian in magnitude units. After fitting the turnover magnitude of the Gaussian, the total number of GCs is determined by counting the number of GCs brighter than and doubling that value. (The reason behind this methodology is to avoid incompleteness-related issues at faint magnitudes.)
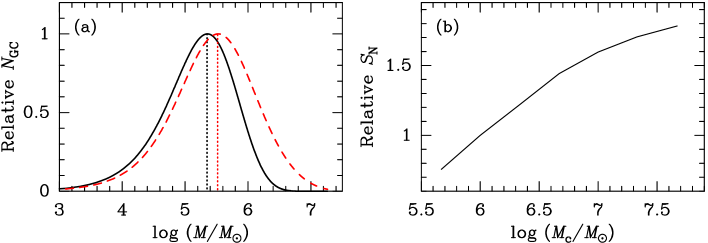
In the presence of a range of among GCMFs of ETGs where increases with galaxy luminosity and mass, it is instructive to test the sensitivity of to , because the latter affects the width of the GCLF at old age. This is illustrated in panel (a) of Figure 7, while we plot as a function of at an age of 12 Gyr in panel (b) of Figure 7. These values of were derived by evaluating Equation (4) for = 1, , = 12 Gyr, and a range of . Note that the aforementioned estimated range for ETGs with UV upturns implies a range in of a factor 1.7, which is similar to the range in actually found among the galaxies in our sample (see Figures 1(f) and 2).
We thus arrive at a picture where the observed ranges of both and can be largely explained by the observed range in , which in turn can be explained by a range of SFR (or SFR surface density, see also Johnson et al., 2017) occurring in the progenitors of the present-day ETGs, with the more massive ETGs containing higher mass fractions from more massive protogalaxies, which formed their stars earlier and with higher SFRs than the less massive ones.
5.2. Metallicities of Metal-rich GCs and the Underlying Field Population
As to the actual metallicities of the metal-rich GCs in the FUV-emitting (inner) regions of ETGs, it has been suggested that they are typically lower than that indicated by the underlying diffuse light of the parent galaxy (e.g., Peng et al., 2006; Sohn et al., 2006), thus casting some apparent doubt on whether these GCs might be able to explain the UV upturns in ETGs through the scenario advocated here. However, we emphasize that metallicity data on GCs in the inner regions of ETGs (including M87) are virtually always based on optical photometry rather than spectroscopy.111111This is due to signal-to-noise constraints imposed by the high background level in the central regions of ETGs. As shown by Goudfrooij & Kruijssen (2013), the differences in optical colors between giant ETGs and their metal-rich GCs can be explained by differences in the stellar MFs. Specifically, several recent spectroscopic studies of giant ETGs have established evidence for bottom-heavy stellar MFs, with power-law slopes in the sub-solar mass range that are at least as steep as that of the initial mass function (IMF) of Salpeter (1955), i.e., in (e.g., van Dokkum & Conroy, 2010; Conroy & van Dokkum, 2012; Smith et al., 2012b; La Barbera et al., 2013; McDermid et al., 2014; Spiniello et al., 2014; van Dokkum et al., 2017; Sarzi et al., 2018). For GCs that were born with such bottom-heavy IMFs, Goudfrooij & Kruijssen (2013) showed that 12 Gyr of dynamical evolution causes the stellar MF of the average surviving (massive) GC to be similar to the canonical Kroupa (2001) IMF, thereby causing their optical colors to become bluer than the underlying field population by amounts similar to those observed (see also Goudfrooij & Kruijssen, 2014). As such, the bluer colors of metal-rich GCs relative to their parent galaxies do not necessarily indicate differences in metallicity, which would indeed be unexpected under the common assumption that surviving GCs represent the high-mass end of the star formation processes that also created the field population (Elmegreen & Efremov, 1997). Furthermore, in the few cases where high-quality spectroscopic Lick index data are available for both ETGs and their constituent GCs at comparable galactocentric distances, the metal-rich GCs have the same ages and metallicities as their parent ETGs to within small uncertainties (see Goudfrooij & Kruijssen 2013 and references therein). This is also the case for M87, as detailed in the Appendix.
6. Implications of the Proposed Scenario
6.1. UV Upturn: Metal-poor and/or Metal-rich Populations?
Traditionally, the correlation of UV upturn strength with the Mg2 index among ETGs has always been recognized as somewhat surprising, in the sense that the Galactic GCs with the strongest FUV fluxes are typically metal-poor (see, e.g., Dorman et al., 1995; O’Connell, 1999). One early scenario that was proposed to resolve this paradox postulated that the UV upturn was mainly produced by a minority ( 20%) population of metal-poor stars (Park & Lee, 1997), although this scenario required ages of Gyr for the metal-poor component. More recently, the fact that the metal-poor GCs in M87 are on average brighter in the FUV than the metal-rich GCs (see Sohn et al. 2006) may have prompted Chung et al. (2011) to construct a model in which the fraction of helium-enhanced stars decreases with increasing metallicity, leading them to conclude that the bulk of the FUV flux in ETGs is produced by metal-poor (and He-rich) stars. While the model of Chung et al. (2011) produces a very good fit to the observed FUV upturn and optical SEDs of ETGs, it overproduces flux in the NUV (2000 – 3000 Å) region (see their Figure 3), which is consistent with a lack of metallicity-dependent line blanketing in the NUV in their model (Dorman et al., 1995; Tantalo et al., 1996). Furthermore, the metallicity distribution of the FUV-bright population in the model of Chung et al. (2011) seems inconsistent with the observed anticorrelations between radial gradients of and metallicity within ETGs (both in Mg and [/H], Jeong et al., 2012), which are in the sense that UV upturn strength and metallicity both decrease with increasing galactocentric radius, while age does not. This suggests a physical association between UV upturn strength and metallicity.
In the context of the scenario described here, this physical association is implied by the differences in radial distribution and structural parameters between the metal-rich and the metal-poor GCs. The radial distributions of the two GC subpopulations in the central 8 kpc of giant ETGs in the ACSVCS are shown in Figure 8, which is a copy of Figure 3 to which we added data points for the metal-poor GCs. Note that the surface number densities of metal-poor GCs in the inner regions are factors of 2 – 5 lower than those of the metal-rich GCs in ETGs with the strongest UV upturns such as M87 and NGC 4649. It is important to realize that this difference between the metal-poor and metal-rich GC systems in these galaxies is not due to differences in GC evaporation rates. First, as already mentioned in Section 4.1.1, the radial distribution of metal-rich GCs on larger radial scales (10 – 100 kpc) is consistent with that of the galaxy light whereas that of the metal-poor GCs is significantly more shallow. Secondly, the observed structural parameters of the GCs in these galaxies indicate that the evaporation rates of the metal-rich GCs are actually higher than those of the metal-poor GCs at a given projected . As shown by Goudfrooij & Fall (2016), the evaporation rate of tidally limited GCs scales with their mass density as , where is the mean density of a GC within its half-mass radius (see also McLaughlin & Fall 2008). Figure 9 depicts the rolling mean value of versus for the metal-poor and metal-rich GCs in the six ACSVCS galaxies also shown in Figure 8. Note that is systematically higher in metal-rich GCs than in metal-poor GCs. Statistically, the evaporation rate as measured by in metal-rich GCs is larger than that in metal-poor ones by a factor at a given among these six galaxies.
Even though the massive metal-poor GCs in M87 are brighter in the FUV than their metal-rich counterparts by a factor 2 on average (see Figure 4), the metal-rich GCs have significantly higher surface number densities as well as higher evaporation rates than the metal-poor GCs in the central regions of the ETGs with the strongest UV upturns. It follows that the FUV emission is due mainly to metal-rich GCs in our scenario. This is consistent with the observed anticorrelations between radial gradients of and metallicity within ETGs as mentioned above.
6.2. Light-element Abundance Ratios in ETGs
If the scenario proposed here is correct, an important implication would be that the He-enhanced populations responsible for the UV upturn in ETGs would show light-element abundance ratios similar to those observed in massive GCs, i.e., enhancements in [Na/Fe] and [N/Fe] accompanied by (likely more metallicity-dependent, see Ventura et al., 2013) depletions of [C/Fe] and [O/Fe].
Specifically, the amplitude of light-element abundance variations in GCs is known to scale with GC mass (see Section 1), so that the largest such variations would be found in regions where the mass fraction of stars originating from massive GCs is highest. In the current scenario, that occurs where and are highest, i.e., the same regions where the UV upturn is strongest—the inner regions of ETGs, while the amplitude of these abundance variations would decrease toward the outer regions of ETGs. Interestingly, some recent spectroscopic studies do show evidence for this. Using stacked SDSS spectra of ETGs, Schiavon (2007) found a strong correlation between [N/Fe] and galaxy luminosity, while van Dokkum et al. (2017) used deep spatially resolved spectroscopy of six ETGs and found that [Na/Fe] increases toward the galaxy centers within (see also Sarzi et al., 2018), while [O/Fe] decreases. These results are just as expected in the current scenario where the He enhancement is due to dissolution of massive GCs in the central regions. In this respect, a clear prediction from the current scenario is that future spectroscopic studies will also find radial gradients in [N/Fe] that increase toward galaxy centers in massive ETGs, and that such radial gradients have the largest amplitudes in ETGs with the strongest UV upturns.
6.3. Interpretation of Correlations between UV Upturn and Galaxy Properties
If indeed the range of among ETGs is mainly caused by He-rich EHB stars that were formed in massive GCs, among which most were subsequently dissolved in the inner regions of giant ETGs, can we understand the previously known relations between and galaxy properties such as those shown in panels (a) – (e) of Figure 1?
First of all, the anticorrelation between and [/Fe] can be understood, at least qualitatively, by the results of Puzia et al. (2006) who found that massive GCs in ETGs typically have very high [/Fe] values, higher than those of the diffuse light of their parent galaxies. Hence, the higher the values of and/or average for a given ETG, the higher the resulting [/Fe], as observed. Similarly, the anticorrelation between and central velocity dispersion arises in this scenario due to the strong correlation between ETG luminosity (and thus likely mass as well) and the value of of its GC system (see Section 5.1.3 and Johnson et al. 2017), in conjunction with the fact that (see Equation 2). This would also indirectly cause the anticorrelation between and [/H], given the well-known mass-metallicity relation among ETGs (e.g., Ferrarese et al., 2006). The anticorrelation between and age would arise in part due to the age dependence of the production rate of EHB stars due to stellar evolution, and in part because the more massive ETGs (with higher values of and ) typically have older SSP ages. Finally, the strong Burstein et al. (1988) anticorrelation between and Mg2 can be explained by the sensitivities of the Mg2 index to age, [/H], and [/Fe], all of which anticorrelate with (see also Jeong et al., 2012).
Zaritsky et al. (2015) recently reported a correlation between the strength of the UV upturn in ETGs and the stellar mass-to-light ratio inferred from SED fitting, suggesting that differences in the low-mass end of the stellar IMF are related to the nature of the EHB stars responsible for the FUV flux in ETGs. In the context of the scenario on the nature of the UV upturn presented here, the relation found by Zaritsky et al. arises for the same reasons as that of the relation between and ETG luminosity or mass, i.e., a scenario in which the central regions in massive ETGs contain relatively high mass fractions from massive galaxy building blocks, which formed their stars earlier and with higher SFR surface densities than less massive ones. Those very high SFR surface densities are also thought to cause the steep stellar IMFs at sub-solar masses found in the central regions of massive ETGs, specifically through strong turbulence (high Mach numbers), which causes cloud fragmentation to occur at relatively small scales (Hopkins, 2013).
7. Summary and Conclusions
Prompted by the recent finding of FUV-bright massive GCs in M87, the central dominant galaxy in the Virgo cluster of galaxies (Sohn et al., 2006; Kaviraj et al., 2007), we investigate the idea that there is a physical connection between the UV upturn in ETGs and He-enhanced stellar populations in massive GCs. We study the dependencies of the strength of the UV upturn in ETGs on the GC specific frequency and other galaxy properties, mainly using results from the literature. We find that anticorrelates strongly with , the specific frequency of red (metal-rich) GCs in ETGs. This anticorrelation appears to be causal, in that ETGs with high values of consistently lie “above” linear fits to the previously known anticorrelations between and Mg2, age, [/H], and central velocity dispersion .
Guided by the observed depletion of surface number densities of metal-rich GCs in the inner regions of massive ETGs, which is where the UV upturn is known to occur, we explore the hypothesis that the UV upturn is produced mainly by He-enhanced populations formed within massive (mainly metal-rich) GCs that are subsequently disrupted by dynamical evolution in the strong tidal fields in the inner regions of ETGs during the Gyr of their lifespan, using the observed FUV luminosities seen in the surviving massive GCs in M87 as proxies.
Adopting a Schechter (1976) function parameterization of GCMFs in conjunction with simulations of dynamical evolution of GCs, we find that the ranges of observed colors and FUV luminosities among ETGs are entirely consistent with our hypothesis if the initial masses of GCs responsible for the bulk of the FUV output were . (This value for is formally an underestimate, since it does not account for the effects of rapid mass loss mechanisms during the first yr after GC formation.) This lower limit of the initial mass of GCs responsible for the UV upturn is consistent with the masses of the FUV-bright GCs currently seen in M87. Specifically, we find that the colors of the ETGs with the weakest UV upturns and lowest values of are consistent with GCs that were formed in environments featuring relatively low characteristic Schechter truncation masses (), likely associated with regions with relatively low SFR surface densities. Conversely, the colors of the ETGs with the strongest UV upturns and highest values are consistent with GC systems with , likely having formed in vigorously star-forming environments. Importantly, the values of necessary to explain the range of seen among ETGs are consistent with the values of found from evolved Schechter function fits of the GC luminosity functions of those ETGs. Furthermore, we find that this range of found among ETGs also explains the correlation between and in that GCMFs with larger values of have wider GCMFs, which translates to larger values of due to the way is defined.
If the scenario proposed here is correct, an important implication would be that the He-enhanced populations responsible for the UV upturn in ETGs should show light-element abundance ratios similar to those observed within massive GCs, i.e., enhancements of [Na/Fe] and [N/Fe] accompanied by depletions of [C/Fe] and [O/Fe]. Encouragingly, a recent spectroscopic study of massive ETGs by van Dokkum et al. (2017) does show evidence for radial gradients of [Na/Fe] and [O/Fe] in the sense predicted by this scenario. As such, we predict that future studies will also find radial gradients in [N/Fe] that increase toward galaxy centers in massive ETGs, and that such radial gradients have the largest amplitudes in ETGs that have the strongest UV upturns.
Our findings suggest that the nature of the UV upturn in ETGs and the variation of its strength among ETGs are causally related to that of helium-rich populations in massive GCs, rather than intrinsic properties of field stars in massive galactic spheroids. The observed ranges of both and among ETGs can be explained by the observed range in of their GC systems, which in turn can be explained by a range of SFR surface density occurring in the progenitors of the present-day ETGs, with the more massive ETGs containing higher mass fractions from more massive protogalaxies, which formed their stars earlier and with higher SFR surface densities than the less massive ones.
Appendix A A Comparison of Metallicities of Metal-rich GCs in M87 with the Underlying Field Population
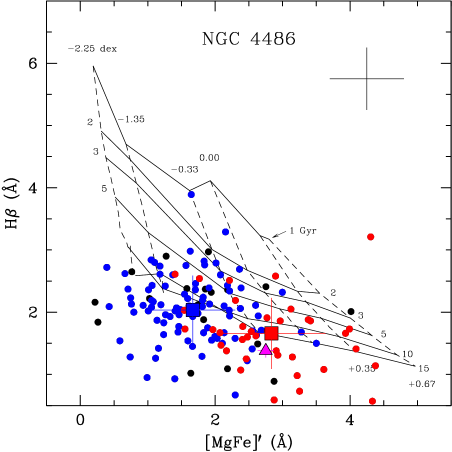
For the specific case of GCs in M87, the available spectroscopic data in the literature (Cohen et al., 1998) are, unfortunately, strongly dominated by GCs at large galactocentric distances, and thus by metal-poor GCs. Furthermore, the S/N ratio of a significant fraction of the GC spectra of Cohen et al. (1998) are not high enough to derive ages and metallicities at the 50% accuracy level (S/N 30 per Å, see Puzia et al. 2005), thus providing only marginal constraints on the age and metallicity of these GCs. To reduce the resulting uncertainty on the assignment of GCs targeted by Cohen et al. (1998) as “metal-poor” versus “metal-rich,” we use the (where is Johnson ) colors from Strom et al. (1981), whose GC target list was used by Cohen et al. (1998). The selection of metal-poor (or metal-rich) GCs was made by selecting GCs bluer (or redder) than the color associated with the metallicity corresponding to the dip in between the blue and red peaks in the bimodal color distribution in the high-quality ACSVCS photometry of M87 (, Peng et al., 2006). In this context, we use BC03 model SEDs for an age of 12 Gyr and a Chabrier (2003) IMF, and derive model colors by using the synphot package within IRAF/STSDAS. The resulting color to discriminate metal-poor from metal-rich GCs in M87 is 1.75. To evaluate mean metallicities for the metal-poor and metal-rich GCs, we use the indices H and [MgFe]′, respectively, and compare them to predictions of the SSP models of Thomas et al. (2003). Figure 10 shows H versus [MgFe]′ for the GCs in M87 from Cohen et al. (1998). The metal-poor and metal-rich GCs selected as such by means of their colors from Strom et al. (1981) are shown with blue and red circles, respectively. Since the uncertainties are significant for the individual GCs, we also indicate inverse-variance-weighted average indices for the metal-poor and metal-rich GCs selected as mentioned above (see large blue and red squares in Figure 10). Note that [/H] for the weighted average metal-rich GC, for which with a median of 181′′. For comparison, we overplot H and [MgFe]′ for the diffuse light of M87 at , the outermost data point from Davies et al. (1993) and Sarzi et al. (2018). Note that the age and metallicity of the latter are consistent with those of the average metal-rich GC in M87 to within 1 . We conclude that the available spectroscopic observations of M87 and its GCs are consistent with previous evidence for other ETGs (see Goudfrooij & Kruijssen 2013 and references therein) in that the mean metallicities of metal-rich GCs and the underlying field stars in giant ETGs are consistent with each other.
References
- Adams & Myers (2001) Adams, F. C., & Myers, P. 2001, ApJ, 533, 744
- Ashman & Zepf (1992) Ashman, K. M., & Zepf, S. E., 1992, ApJ, 384, 50
- Ashman et al. (1994) Ashman, K. M., Bird, C. M., & Zepf, S. E. 1994, AJ, 108, 2348
- Bassino et al. (2006) Bassino, L. P., Richtler, T., & Dirsch, B., 2006, MNRAS, 367, 156
- Bastian et al. (2012) Bastian, N., Konstantopoulos, I. S., Trancho, G., et al. 2012, A&A, 541, A25
- Baumgardt et al. (2008) Baumgardt, H., Kroupa, P., & Parmentier, G. 2008, MNRAS, 384, 1231
- Bekki (2012) Bekki, K. 2012, ApJ, 747, 78
- Bertola (1980) Bertola, F. 1980, Highlights of Astronomy, 5, 311
- Binney & Tremaine (1987) Binney, J., & Tremaine, S. 1987, Galactic Dynamics, Princeton Series in Astrophysics (Princeton, NJ: Princeton University Press)
- Boselli et al. (2005) Boselli, A., Cortese, L., Deharveng, J. M., et al. 2005, ApJ, 629, L29
- Brodie & Strader (2006) Brodie, J. P., & Strader, J. 2006, ARA&A, 44, 193
- Brodie et al. (2012) Brodie, J. P., Usher, C., Conroy, C., et al. 2012, ApJ, 759, L33
- Brown et al. (1997) Brown, T. M., Ferguson, H. C., Davidsen, A. F., & Dorman, B. 1997, ApJ, 482, 685
- Brown et al. (2010) Brown, T. M., Sweigart, A. V., Lanz, T., et al. 2010, ApJ, 718, 1332
- Brown et al. (2016) Brown, T. M., Cassisi, S., D’Antona, F., et al. 2016, ApJ, 822, 44
- Bruzual & Charlot (2003) Bruzual, G. A., & Charlot, S., 2003, MNRAS, 344, 1000
- Bureau et al. (2011) Bureau, M., Jeong, H., Yi, S. K., et al. 2011, MNRAS, 414, 1887
- Burgarella et al. (2001) Burgarella, D., Kissler-Patig, M., & Buat, V. 2001, AJ, 121, 2647
- Burstein et al. (1987) Burstein, D., Davies, R. L., Dressler, A., et al. 1987, ApJS, 64, 601
- Burstein et al. (1988) Burstein, D., Bertola, F., Buson, L. M., Faber, S. M., & Lauer, T. R. 1988, ApJ, 328, 440
- Caloi & D’Antona (2007) Caloi, V., & D’Antona, F. 2007, A&A, 463, 949
- Caon et al. (1993) Caon, N., Capaccioli, M., & D’Onofrio, M. 1993, MNRAS, 265, 1013
- Cardelli et al. (1989) Cardelli, J. A., Clayton, G. C., & Mathis, J. S. 1989, ApJ, 345, 245
- Carretta et al. (2010) Carretta, E., Bragaglia, A., Gratton, R. G., et al. 2010, A&A, 505, 117
- Carter et al. (2011) Carter, D., Pass, S., Kennedy, J., Karick, A. M., & Smith, R. J. 2011, MNRAS, 414, 3410
- Cassisi et al. (2017) Cassisi, S., Salaris, M., Pietrinferi, A., & Hyder, D. 2017, MNRAS, 464, 2341
- Chabrier (2003) Chabrier, G. 2003, PASP, 115, 763
- Chandar et al. (2010) Chandar, R., Whitmore, B. C., & Fall, S. M. 2010, ApJ, 713, 1343
- Chung et al. (2011) Chung, C., Yoon, S.-J., & Lee, Y.-W. 2011, ApJ, 740, L45
- Chung et al. (2017) Chung, C., Yoon, S.-J., & Lee, Y.-W. 2017, ApJ, 842, 91
- Code & Welch (1979) Code, A. D., & Welch, G. A. 1979, ApJ, 229, 95
- Cohen et al. (1998) Cohen, J. G., Blakeslee, J. P., & Rhyzov, A. 1998, ApJ, 496, 808
- Conroy (2012) Conroy, C. 2012, ApJ, 758, 21
- Conroy & van Dokkum (2012) Conroy, C., & van Dokkum, P. G. 2012, ApJ, 760, 71
- Côté et al. (2004) Côté, P., Blakeslee, J. P., Ferrarese, L., et al. 2004, ApJS, 153, 223
- Davies et al. (1993) Davies, R. L., Sadler, E. M., & Peletier, R. F. 1993, MNRAS, 262, 650
- D’Ercole et al. (2008) D’Ercole, A., Vesperini, E., D’Antona, F., McMillan, S. L. W., & Recchi, S. 2008, MNRAS, 391, 825
- de Zeeuw et al. (2002) de Zeeuw, P. T., Bureau, M., Emsellem, E., et al. 2002, MNRAS, 329, 513
- Dinescu et al. (1999) Dinescu, D. I., Girard, T. M., & van Altena, W. F. 1999, AJ, 117, 1792
- Dirsch et al. (2005) Dirsch, B., Schuberth, Y., & Richtler, T., 2005, A&A, 433, 43
- Dorman et al. (1995) Dorman, B., O’Connell, R. W., & Rood, R. T. 1995, ApJ, 442, 105
- Dotter et al. (2007) Dotter, A., Chaboyer, B., Jevremoić, D., et al. 2007, AJ, 134, 376
- Eisenhardt et al. (2007) Eisenhardt, P. R., De Propris, R., Gonzalez, A. H., et al. 2007, ApJS, 169, 225
- Elmegreen & Efremov (1997) Elmegreen, B. G., & Efremov, Yu. N. 1997, ApJ, 480, 235
- Fall & Zhang (2001) Fall, S. M., & Zhang, Q. 2001, ApJ, 561, 751
- Ferrarese et al. (2006) Ferrarese, L., Côté, P., Jordán, A., et al. 2006, ApJS, 164, 334
- Forbes (2005) Forbes, D. A. 2005, ApJ, 635, L137
- Forbes et al. (1998) Forbes, D. A., Grillmair, C. J., Williger, G. M., Elson, R. A. W., & Brodie, J. P. 1998, MNRAS, 293, 325
- Forbes et al. (2006) Forbes, D. A., Sánchez-Blázquez, P., Phan, A. T. T., et al. 2006, MNRAS, 366, 1230
- Geisler et al. (1996) Geisler, D., Lee, M. G., & Kim, E. 1996, AJ, 111, 1529
- Genzel et al. (2010) Genzel, R., Tacconi, L. J., Gracia-Carpio, J., et al. 2010, MNRAS, 407, 2091
- Georgiev et al. (2010) Georgiev, I. Y., Puzia, T. H., Goudfrooij, P., & Hilker, M. 2010, MNRAS, 406, 1967
- Gnedin & Ostriker (1997) Gnedin, O. Y., & Ostriker, J. P. 1997, ApJ, 474, 223
- Goudfrooij et al. (1994a) Goudfrooij, P., Hansen, L., Jørgensen, H. E., et al. 1994a, A&AS, 104, 179
- Goudfrooij et al. (1994b) Goudfrooij, P., Nørgaard-Nielsen, H. U., Hansen, L., & Jørgensen, H. E. 1994b, A&AS, 105, 341
- Goudfrooij & Trinchieri (1998) Goudfrooij, P., & Trinchieri, G. 1998, A&A, 330, 123
- Goudfrooij et al. (2001) Goudfrooij, P., Alonso, M. V., Maraston, C., & Minniti, D. 2001, MNRAS, 328, 237
- Goudfrooij et al. (2007) Goudfrooij, P., Schweizer, F., Gilmore, D., & Whitmore, B. C. 2007, AJ, 133, 2737
- Goudfrooij et al. (2011) Goudfrooij, P., Puzia, T. H., Chandar, R., & Kozhurina-Platais, V. 2011, ApJ, 737, 4
- Goudfrooij & Kruijssen (2013) Goudfrooij, P., & Kruijssen, J. M. D. 2013, ApJ, 762, 107
- Goudfrooij & Kruijssen (2014) Goudfrooij, P., & Kruijssen, J. M. D. 2014, ApJ, 780, 43
- Goudfrooij & Fall (2016) Goudfrooij, P., & Fall, S. M. 2016, ApJ, 833, 8
- Gratton et al. (2012) Gratton, R., Carretta, E., & Bragaglia, A. 2012, A&A Rev., 20, 50
- Greggio & Renzini (1990) Greggio, L., & Renzini, A. 1990, ApJ, 364, 35
- Han et al. (2007) Han, Z., Podsiadlowski, Ph., & Lynas-Gray, A. E. 2007, MNRAS, 380, 1098
- Hansen et al. (1985) Hansen, L., Nørgaard-Nielsen, H. U., & Jørgensen, H. E. 1985, A&A, 149, 442
- Harris & van den Bergh (1981) Harris, W. E., & van den Bergh, S. 1981, AJ, 86, 1627
- Harris et al. (2007) Harris, W. E., Harris, G. L. H., Layden, A. C., & Wehner, E. M. H. 2007, ApJ, 666, 903
- Harris et al. (2010) Harris, W. E., Spitler, L. R., Forbes, D. A., & Bailin, J. 2010, MNRAS, 401, 1965
- Harris et al. (2013) Harris, W. E., Harris, G. L. H., & Alessi, M. 2013, ApJ, 772, 82
- Harris et al. (2017) Harris, W. E., Ciccone, S. M., Eadie, G. M., et al. 2017, ApJ, 835, 101
- Hills (1980) Hills, J. G. 1980, ApJ, 235, 986
- Hopkins (2013) Hopkins, P. F. 2013, MNRAS, 433, 170
- Jennings et al. (2014) Jennings, Z. G., Strader, J., Romanowsky, A. J., et al. 2014, AJ, 148, 32
- Jeong et al. (2012) Jeong, H., Yi, S. K., Bureau, M.. et al. 2012, MNRAS, 423, 1921
- Johnson et al. (2017) Johnson, L. C., Seth, A. C., Dalcanton, J. J., et al. 2017, ApJ, 839, 78
- Jordán et al. (2007) Jordán, A., McLaughlin, D. E., Côté, P., et al. 2007, ApJS, 171, 101
- Jordán et al. (2009) Jordán, A., Peng, E. W., Blakeslee, J. P., et al. 2009, ApJS, 180, 54
- Jordán et al. (2015) Jordán, A., Peng, E. W., Blakeslee, J. P., et al. 2015, ApJS, 221, 13
- Kaviraj et al. (2007) Kaviraj, S., Sohn, S. T., O’Connell, R. W., et al. 2007, MNRAS, 377, 987
- King (1962) King, I. 1962, AJ, 67, 471
- Kroupa (2001) Kroupa, P. 2001, MNRAS, 322, 231
- Kruijssen (2015) Kruijssen, J. M. D. 2015, MNRAS, 454, 1658
- Kundu et al. (1999) Kundu, A., Whitmore, B. C., Sparks, W. B., et al. 1999, ApJ, 513, 733
- Kuntschner (2000) Kuntschner, H. 2000, MNRAS, 315, 184
- Kuntschner et al. (2010) Kuntschner, H., Emsellem, E., Bacon, R., et al. 2010, MNRAS, 408, 97
- La Barbera et al. (2013) La Barbera, F., Ferreras, I., Vazdekis, A., et al. 2013, MNRAS, 433, 3017
- Lada & Lada (2003) Lada, C. J., & Lada, E. A. 2003, ARA&A, 41, 57
- Lauer et al. (2005) Lauer, T. R., Faber, S. M., Gebhardt, K., et al. 2005, AJ, 129, 2138
- Law et al. (2009) Law, D. R., Steidel, C. C., Erb, D. K., et al. 2009, ApJ, 697, 2057
- Law et al. (2012) Law, D. R., Steidel, C. C., Shapley, A. E., et al. 2012, ApJ, 759, 29
- Lee & Goodman (1995) Lee, H. M., & Goodman, J. 1995, ApJ, 443, 109
- Li et al. (2017) Li, H., Gnedin, O. Y., Gnedin, N.Y., et al. 2017, ApJ, 834, 69
- Martel et al. (2004) Martel, A. R., Ford, H. C., Bradley, L. D., et al. 2004, AJ, 128. 2758
- Martin et al. (2005) Martin, D. C., Fanson, J., Schiminovich, D., et a. 2005, ApJ, 619, L1
- Masegosa et al. (2011) Masegosa, J., Márquez, I., Ramirez, A., & González-Martín, O. 2011, A&A, 527, A23
- McDermid et al. (2014) McDermid, R. M., Cappelari. M., Alatalo, K., et al. 2014, ApJ, 792, L37
- McLachlan & Basford (1988) McLachlan, G. J., & Basford, K. E. 1988, Mixture Models: Inference and Application to Clustering (New York: M. Dekker)
- McLaughlin & Fall (2008) McLaughlin, D. E., & Fall, S. M. 2008, ApJ, 679, 1272
- Miller & Lotz (2007) Miller, B. W., & Lotz, J. M. 2007, ApJ, 670, 1074
- Milone (2015) Milone, A. P. 2015, MNRAS, 446, 1672
- Milone et al. (2017) Milone, A. P., Piotto, G., Renzini, A., et al. 2017, MNRAS, 464, 3636
- Moore et al. (2006) Moore, B., Diemand, J., Madau, P., Zemp, M., & Stadel, J. 2006, MNRAS, 368, 563
- Morrissey et al. (2005) Morrissey, P., Schiminovich, D., Barlow, T. A., et al. 2005, ApJ, 619, L7
- O’Connell (1999) O’Connell, R. W. 1999, ARA&A, 37, 603
- O’Connell et al. (1992) O’Connell, R. W., Bohlin, R. C., Collins, N. R., et al. 1992, ApJ, 395, L45
- Ohl et al. (1998) Ohl, R. G., O’Connell, R. W., Bohlin, R. C., et al. 1998, ApJ, 505, L11
- Park & Lee (1997) Park, J.-H., & Lee, Y.-W. 1997, ApJ, 476, 28
- Peacock et al. (2015) Peacock, M. B., Strader, J., Romanowsky, A. J., & Brodie, J. P. 2015, ApJ, 800, 13
- Peacock et al. (2017) Peacock, M. B., Zepf, S. E., Kundu, A., & Chael, J. 2017, MNRAS, 464, 713
- Peletier et al. (1990) Peletier, R. F., Davies, R. L., Illingworth, G. D., Davis, L. E., & Cawson, M. 1990, AJ, 100, 1091
- Peng et al. (2006) Peng, E. W., Jordán, A., Côté, P., et al. 2006, ApJ, 639, 95
- Peng et al. (2008) Peng, E. W., Jordán, A., Côté, P., et al. 2008, ApJ, 681, 197
- Persson et al. (1979) Persson, S. E., Frogel, J. A., & Aaronson, M. 1979, ApJS, 39, 61
- Piotto et al. (2007) Piotto, G., Bedin, L. R., Anderson, J., et al. 2007, ApJ, 661, L53
- Portegies Zwart et al. (2010) Portegies Zwart, S. F., McMillan, S. L. W., & Gieles, M. 2010, ARA&A, 48, 431
- Puzia et al. (2005) Puzia, T. H., Kissler-Patig, M., Thomas, D., et al. 2005, A&A, 439, 997
- Puzia et al. (2006) Puzia, T. H., Kissler-Patig, M., & Goudfrooij, P. 2006, ApJ, 648, 383
- Puzia et al. (2014) Puzia, T. H., Paolillo, M., Goudfrooij, P., et al. 2014, ApJ, 786, 78
- Rejkuba et al. (2014) Rejkuba, M., Harris, W. E., Greggio, L., et al. 2014, ApJ, 791, L2
- Renzini et al. (2015) Renzini, A., D’Antona, F., Cassisi, S., et al. 2015, MNRAS, 454, 4197
- Rhode & Zepf (2004) Rhode, K. L., & Zepf, S. E. 2001, AJ, 127, 302
- Rich et al. (1997) Rich, R. M., Sosin, C., Djorgovski, S., et al. 1997, ApJ, 484, L25
- Rich et al. (2005) Rich, R. M., Salim, S., Brinchmann, J., et al. 2005, ApJ, 619, L107
- Roediger et al. (2014) Roediger, J. C., Courteau, S., Graves, G., & Schiavon, R. P. 2014, ApJS, 210, 10
- Salpeter (1955) Salpeter, E. E. 1955, ApJ, 121, 161
- Sánchez-Blázquez et al. (2006) Sánchez-Blázquez, P., Gorgas, J., Cardiel, N., & González, J. J. 2006, A&A, 457, 787
- Sarzi et al. (2018) Sarzi, M., Spiniello, C., La Barbera, F., Krajnović, D., & van den Bosch, R. 2018, submitted to MNRAS (arXiv:1711.0898)
- Schechter (1976) Schechter, P. 1976, ApJ, 203, 297
- Schiavon (2007) Schiavon, R. P. 2007, ApJS, 171, 146
- Schiavon et al. (2013) Schiavon, R. P., Caldwell, N., Conroy, C., et al. 2013, ApJ, 776, L7
- Schlegel et al. (1998) Schlegel, D. J., Finkbeiner D. P., & Davis M. 1998, ApJ, 500, 525
- Sikkema et al. (2006) Sikkema, G., Peletier, R. F., Carter, D., Valentijn, E. A., & Balcells, M. 2006, A&A, 458, 458
- Smith et al. (2012a) Smith, R. J., Lucey, J. R., & Carter, D. 2012a, MNRAS, 421, 2982
- Smith et al. (2012b) Smith, R. J., Lucey, J. R., & Carter, D. 2012b, MNRAS, 426, 2994
- Sneden et al. (1992) Sneden, C., Kraft, R. P., Prosser, C. F., & Langer, G. E. 1992, AJ, 104, 2121
- Sohn et al. (2006) Sohn, S. T., O’Connell, R. W., Kundu, A., et al. 2006, AJ, 131, 866
- Spiniello et al. (2014) Spiniello, C., Trager, S., Koopmans, L. V. E., & Conroy, C. 2014, MNRAS, 438, 1483
- Spitzer (1987) Spitzer, L. Jr. 1987, Dynamical Evolution of Globular Clusters (Princeton: Princeton University Press)
- Spolaor et al. (2006) Spolaor, M., Forbes, D. A., Hau, G. K. T., Proctor, R. N., & Brough, S. 2008, MNRAS, 385, 667
- Strader et al. (2011) Strader, J., Romanowsky, A. J., Brodie, J. P., et al. 2011, ApJS, 197, 33
- Strom et al. (1981) Strom, S. E., Forte, J. C., Harris, W. E., et al. 1981, ApJ, 245, 416
- Tacconi et al. (2013) Tacconi, L. J., Neri, R., Genzel, R., et al. 2013, ApJ, 768, 74
- Tailo et al. (2017) Tailo, M., D’Antona, F., Milone, A. P., et al. 2017, MNRAS, 465, 1046
- Tantalo et al. (1996) Tantalo, R., Chiosi, C., Bressan, A., & Fagotto, F. 1996, A&A, 311, 361
- Thomas et al. (2003) Thomas, D., Maraston, C., & Bender, R. 2003, MNRAS, 339, 897
- Thomas et al. (2005) Thomas, D., Maraston, C., Bender, R., & Mendes de Oliveira, C. 2005, ApJ, 621, 673
- Trager et al. (1998) Trager, S. C., Worthey, G., Faber, S. M., Burstein, D., & González, J. J. 1998, ApJS, 116, 1
- van Dokkum & Conroy (2010) van Dokkum, P. G., & Conroy, C. 2010, Nature, 468, 940
- van Dokkum & Franx (1995) van Dokkum, P. G., & Franx, M. 1995, AJ, 110, 2027
- van Dokkum et al. (2017) van Dokkum, P. G., Conroy, C., Villaume, A., Brodie, J. P., & Romanowsky, A. J. 2017, ApJ, 841, 68
- Vazdekis et al. (2010) Vazdekis, A., Sánchez-Blázquez, P., Falcón-Barroso, J., et al. 2010, MNRAS, 404, 1639
- Ventura et al. (2013) Ventura, P., Di Criscienzo, M., Carini, R., & D’Antona, F. 2013, MNRAS, 431, 3642
- Vesperini et al. (2009) Vesperini, E., McMillan, S. L. W., & Portegies Zwart, S. 2009, ApJ, 698, 615
- Whitmore et al. (2014) Whitmore, B. C., Chandar, R., Bowers, A. S., et al. 2014, AJ, 147, 78
- Yi (2008) Yi, S. 2008, in “Hot Subdwarf Stars and Related Objects”, eds. U. Heber, S. Jeffery, & R. Napiwotzki (ASP: San Francisco), p. 3
- Yi et al. (1997) Yi, S., Demarque, P., & Oemler, A. 1997, ApJ, 486, 201
- Zaritsky et al. (2015) Zaritsky, D., Gil de Paz, A., & Bouquin, A. Y. K. 2015, MNRAS, 446, 2030
- Zhang & Fall (1999) Zhang, Q., & Fall, S. M. 1999, ApJ, 527, L81