[KON]
KON]Konkoly Observatory of the Hungarian Academy of Sciences
Konkoly Thege M. út 13-15, Budapest, Hungary
Big Signals, Small Signals, Systematics
Abstract
We examine the role of instrumental systematics in the search for small amplitude signal components in the presence of large amplitude signals. Current analyses of variable stars dealing with the above situation seem to ignore the effects of systematics, albeit the consideration of systematics is quite routine in the field of extrasolar planets. We show that simultaneous filtering of the large amplitude component and the systematics leads to residuals with much better potentials to detect any hidden small amplitude components. The method is illustrated by selected examples from the Kepler database.
1 Introduction
With continuing data acquisition and developing instrumentation, the search for small amplitude signals in astronomical time series remains an important focus point in variable star astronomy (see, e.g., Breger, 1966, on the early detection of the mag amplitude variation of the Scuti star Cep). Until the photometric space missions CoRoT and Kepler, ground-based facilities usually provided time series with a precision of %–% per data point. Although this could have already been sufficient to access the sub-millimagnitude regime, except for the data gathered by coordinated observations (e.g., WET111Whole Earth Telescope, http://www.physics.udel.edu/gp/darc/wet/ and DSN222Delta Scuti Network, https://www.univie.ac.at/tops/dsn/intro.html), or, by long- time monitoring (e.g., OGLE333Optical Gravitational Lensing Experiment, http://ogle.astrouw.edu.pl/), this goal was rarely attainable. The situation has somewhat changed with the advent of wide field surveys in search for extrasolar transiting planets (e.g., WASP444Wide Angle Search for Planets,
North: http://www.superwasp.org/,
South: http://www.superwasp.org/waspsouth.htm,
HAT555Hungarian-made Automated Telescope,
North: https://hatnet.org/,
South: https://hatsouth.org/,
KELT666Kilodegree Extremely Little Telescope,
North: http://www.astronomy.ohio-state.edu/keltnorth/Telescope.html,
South: https://my.vanderbilt.edu/keltsouth/). Nevertheless, these surveys still remained in the regime of precision of a few mmag per data point (but, because of the increased data volume, allowing to detect sub-mmag stellar variability in a large number of objects – see Holdsworth, 2017).
The quantum leap that has led to the long-waited photometric discovery of solar-type oscillations, both in giants and in main sequence stars (De Ridder et al., 2009; Chaplin et al., 2011), would have not been possible without the space missions. At the same time, large amplitude variables also attract a great deal of interest, since, in principle, they could also be the target of a high level of scrutiny similar to those showing solar-type pulsations or planetary transits. Indeed, as it was shown by the first discovery of the small amplitude modes in the large amplitude Scuti star AI Vel by Walraven et al. (1992), small amplitude pulsations may occur in classical pulsators. Several other studies on large amplitude pulsators, made on space- and ground-based data, have led to the discovery of this type of small amplitude variabilities (e.g., Gruberbauer et al., 2007; Moskalik & Kołaczkowski, 2009).
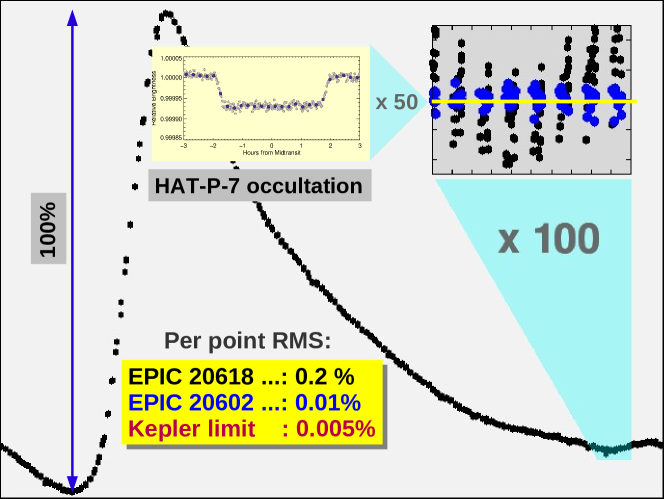
In Fig. 1,777The inset on HAT-P-7 in Fig. 1 has been reproduced from the tutorial of Andrew Vanderburg at https://www.cfa.harvard.edu/avanderb/tutorial/tutorial2.html we illustrate the enormity of the precision of the Kepler data with respect to the size of the light variation of a monoperiodic RR Lyrae star in the K2/C03 field. The figure also shows that a ‘constant’ star of the same brightness from the same field has a much smaller scatter. The purpose of this contribution is to highlight this difference and investigate possible sources of this discrepancy.
2 Systematics and Large-Amplitude Signals
When the range of variability spans through six orders of magnitude and the quality of the data allows us to investigate the full range, small effects, usually not considered under ‘normal’ circumstances, may lead to incorrect signal representation and loss of components.
The simplest case is the error introduced by applying an imprecise pre-whitening frequency. We generated a time series on the timestamps of EPIC 206027866 from K2/C03 by using the Fourier decomposition of the light curve of the well-known RR Lyrae star RR Cet. We added a Gaussian noise of % corresponding to a RMS of ppm on a h time base, in a broad agreement with the current precision of the K2 data (e.g., Vanderburg & Johnson, 2014). The frequency of the input signal was set equal to c/d, whereas the trial frequency was purposely larger by c/d (corresponding to a period difference of d). By performing a full Fourier fit (i.e., using the same number of harmonics we employed in the signal generation), we got the result shown in Fig. 3. In spite of the tiny phase shift of through the time span of days, the residual is much larger than the noise level and (obviously) biased toward the steeply varying part of the light curve. The improper fit results in a long chain of pre-whitening cycles and may lead to the misinterpretation of the data.
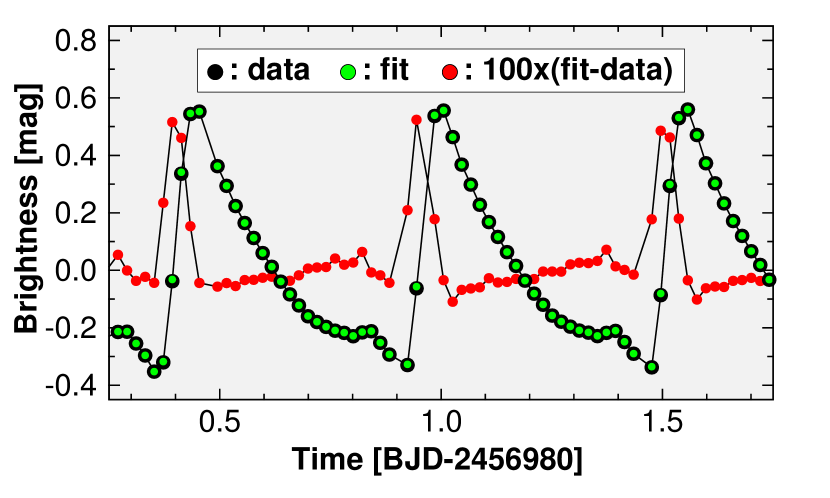
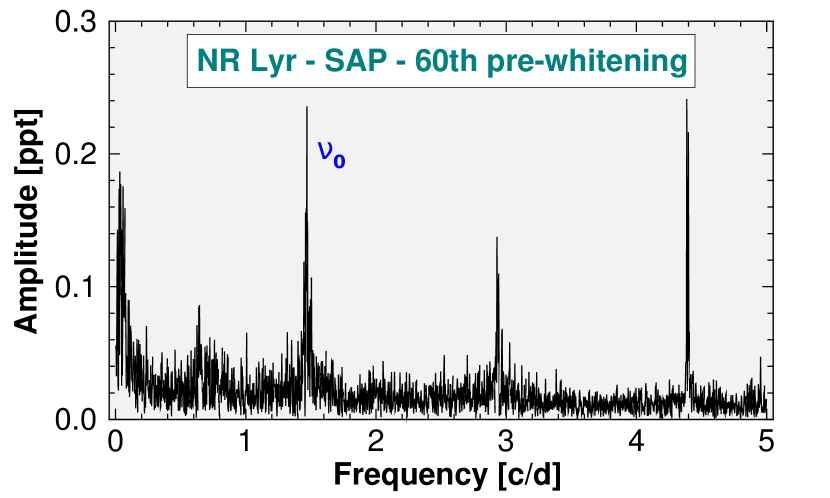
The need for repeated pre-whitenings of frequencies near the known frequency components of the large-amplitude variables is a quite general attribute of studies using space-based observations (see the note on the frequency fit by Kurtz et al., 2016, in the analysis of the triple-mode RR Lyrae star EPIC 201585823). In addition to the white noise component, as a result of instrumental systematics, we also have red noise. On the top of these there might be a real period change of unknown size on unknown time scales. Fig. 3 shows the severity of this issue on the example of a supposedly monoperiodic RR Lyrae star from the original Kepler field. We employed the simple aperture photometry (SAP) as implemented by Benkő (2018). Since the data did not pass through the Kepler Pre-search Data Conditioning (PDC, see Smith et al., 2012) pipeline, one suspects instrumental effects as a possible source of the remaining power. This noise source interacts with the true signal and leaves traces of itself via the well-known convolution theorem:
| (1) |
where denotes the Fourier transform, stands for the observed, for the true signal, and denotes the instrumental signal response (e.g., pixel sensitivity) function.
One of the possible reasons why stellar variability studies have the tendency of avoiding data passed through some post-processing aimed for cleaning the signal from systematics, is that the methods cause various degrees of degradation in the original signal. This can, in principle, be alleviated by making the signal search assuming a complete model (Foreman-Mackey et al., 2015; Aigrain et al., 2015; Angus et al., 2016), but it is computationally far more intensive and leads to somewhat lower detection efficiency than methods following the “clean first then analyze” rule (Kovács et al., 2016). However, the situation is quite different in the presence of large amplitude signals. The periods of these signals are usually quite accurately known (at least to a first approximation) and can be comfortably filtered out from the time series, before getting into the more delicate analysis of the low amplitude components.
Briefly, using the framework of the Trend Filtering Algorithm (TFA, Kovács et al., 2005), we first fit the data by satisfying the Least Squares condition for , built up from the residuals between the data {} and the signal model {}, containing both the co-trending set {} and the Fourier components {} of the known large amplitude signal:
| (2) | |||||
| (3) |
With the {}, {} coefficients determined from the minimization of , we can pre-whiten the data with this first estimate of {} and search for new signals in the residuals. Please note that this method will also introduce some degradation of the unknown signal, because (as it is being unknown) it is not included in the model. Nevertheless, as many successful applications have shown over the past, this is still a quite efficient way of searching for faint signals primarily affected by systematics.
3 An Example on the Method at Work
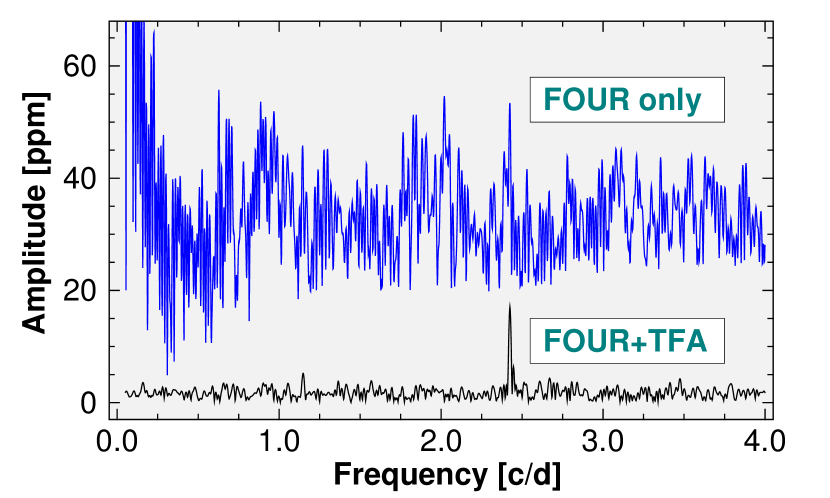
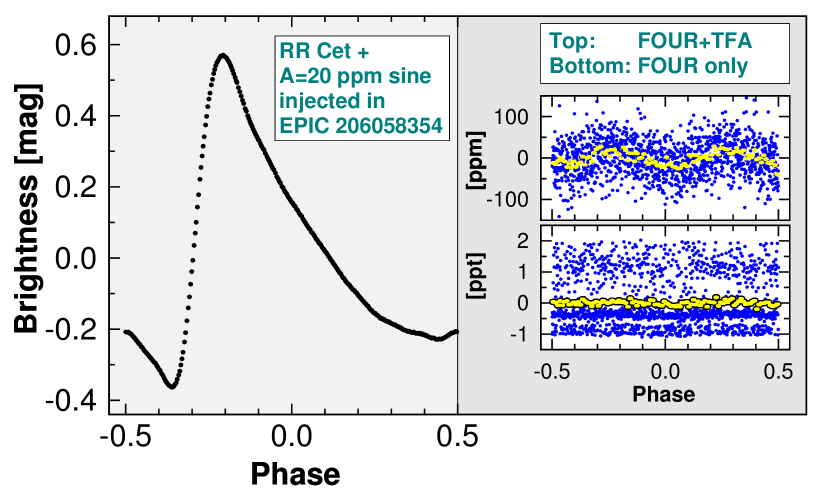
We tested several stars from the K2/C03888We used the data processed by Self Flat Fielding (SFF, see Vanderburg & Johnson, 2014) as given at https://www.cfa.harvard.edu/avanderb/k2.html database by injecting the signal of RR Cet in the non-variable target light curves based on the analysis of Armstrong et al. (2016) from Campaigns 0–4. Then, a shallow signal with an amplitude of ppm and frequency of c/d was added (to simulate a hypothetical first overtone component with a characteristic period ratio of ). Following Kovács et al. (2005), we used TFA template light curves selected on a quasi-uniform grid covering the field by the brightest members of the field. Exact RR Cet frequencies were employed to avoid additional complications mentioned in Sect. 2.
In general, we got a strong confirmation of the expected signal detection capability of the idea of the full (FourierTFA) filtering of the data by the large amplitude component prior to the search for additional, small amplitude components. In Figs. 5 and 5 we show the result of one of our tests performed on EPIC 206058354, a star exhibiting apparently no variability above the total range of mag. We see that simple Fourier filtering does not result in a successful detection. Most of the SFF-filtered data contain small trends and signs of variabilities. The high power content at low frequencies is due to these variations. With the application of TFA we can filter out these effects (many of them may have instrumental origins).
4 Conclusions
In this contribution we indicated the need of using the methodology of data analysis developed in the field of extrasolar planets for searching shallow signals also in other variability studies. The drawback of the systematics filtering is the unavoidable distortion of the signal component that becomes more severe in the signal-dominated regime, whereas it leads only to a relatively small loss of signal power in the systematics-dominated regime. Here the systematics are filtered out more effectively, thereby allowing a considerable gain in signal detection efficiency. The natural extension of the method to signals with partially known signal constituents is briefly described here. In the light of our increasing complex picture on large amplitude pulsators – e.g., the mystery of the low amplitude modes detected in double-mode pulsators (Smolec et al., 2017), the signature of granulation in Cepheids (Derekas et al., 2017) or the low limit of the Blazhko modulation (Benkő & Szabó, 2015; Kovacs, 2016) – we think it is increasingly important to go to the limit allowed by the extremely high quality data supplied by the current and future space observatories.
Acknowledgements.
We thank the organizers for their hard work in making this meeting pleasant and memorable. This research has made use of the NASA Exoplanet Archive, which is operated by the California Institute of Technology, under contract with the National Aeronautics and Space Administration under the Exoplanet Exploration Program.References
- Aigrain et al. (2015) Aigrain, S., et al., Precise time series photometry for the Kepler-2.0 mission, MNRAS 447, 2880 (2015), 1412.6304
- Angus et al. (2016) Angus, R., Foreman-Mackey, D., Johnson, J. A., Systematics-insensitive Periodic Signal Search with K2, ApJ 818, 109 (2016), 1505.07105
- Armstrong et al. (2016) Armstrong, D. J., et al., K2 variable catalogue - II. Machine learning classification of variable stars and eclipsing binaries in K2 fields 0-4, MNRAS 456, 2260 (2016), 1512.01246
- Benkő (2018) Benkő, J. M., On the connection between almost periodic functions and Blazhko light curves, MNRAS 473, 412 (2018), 1709.02143
- Benkő & Szabó (2015) Benkő, J. M., Szabó, R., The Blazhko Effect and Additional Excited Modes in RR Lyrae Stars, ApJ 809, L19 (2015), 1507.06814
- Breger (1966) Breger, M., A Variable Star with an Extremely Short Period, ApJ 146, 958 (1966)
- Chaplin et al. (2011) Chaplin, W. J., et al., Ensemble Asteroseismology of Solar-Type Stars with the NASA Kepler Mission, Science 332, 213 (2011), 1109.4723
- De Ridder et al. (2009) De Ridder, J., et al., Non-radial oscillation modes with long lifetimes in giant stars, Nature 459, 398 (2009)
- Derekas et al. (2017) Derekas, A., et al., The Kepler Cepheid V1154 Cyg revisited: light curve modulation and detection of granulation, MNRAS 464, 1553 (2017), 1609.05398
- Foreman-Mackey et al. (2015) Foreman-Mackey, D., et al., A Systematic Search for Transiting Planets in the K2 Data, ApJ 806, 215 (2015), 1502.04715
- Gruberbauer et al. (2007) Gruberbauer, M., et al., MOST photometry of the RRdLyrae variable AQLeo: two radial modes, 32 combination frequencies and beyond, MNRAS 379, 1498 (2007), 0705.4603
- Holdsworth (2017) Holdsworth, D. L., Pulsating stars in SuperWASP, in European Physical Journal Web of Conferences, European Physical Journal Web of Conferences, volume 152, 01006 (2017)
- Kovacs (2016) Kovacs, G., The Blazhko phenomenon, Commmunications of the Konkoly Observatory Hungary 105, 61 (2016), 1512.05722
- Kovács et al. (2005) Kovács, G., Bakos, G., Noyes, R. W., A trend filtering algorithm for wide-field variability surveys, MNRAS 356, 557 (2005), astro-ph/0411724
- Kovács et al. (2016) Kovács, G., Hartman, J. D., Bakos, G. Á., Periodic transit and variability search with simultaneous systematics filtering: Is it worth it?, A&A 585, A57 (2016), 1510.05133
- Kurtz et al. (2016) Kurtz, D. W., et al., EPIC 201585823, a rare triple-mode RR Lyrae star discovered in K2 mission data, MNRAS 455, 1237 (2016), 1510.03347
- Moskalik & Kołaczkowski (2009) Moskalik, P., Kołaczkowski, Z., Frequency analysis of Cepheids in the Large Magellanic Cloud: new types of classical Cepheid pulsators, MNRAS 394, 1649 (2009), 0809.0864
- Nemec et al. (2011) Nemec, J. M., et al., Fourier analysis of non-Blazhko ab-type RR Lyrae stars observed with the Kepler space telescope, MNRAS 417, 1022 (2011), 1106.6120
- Smith et al. (2012) Smith, J. C., et al., Kepler Presearch Data Conditioning II - A Bayesian Approach to Systematic Error Correction, PASP 124, 1000 (2012), 1203.1383
- Smolec et al. (2017) Smolec, R., et al., Petersen diagram revolution, in European Physical Journal Web of Conferences, European Physical Journal Web of Conferences, volume 152, 06003 (2017), 1703.03029
- Vanderburg & Johnson (2014) Vanderburg, A., Johnson, J. A., A Technique for Extracting Highly Precise Photometry for the Two-Wheeled Kepler Mission, PASP 126, 948 (2014), 1408.3853
- Walraven et al. (1992) Walraven, T., Walraven, J., Balona, L. A., Discovery of additional pulsation modes in AI Velorum, MNRAS 254, 59 (1992)