Towards radiologist-level cancer risk assessment
in CT lung screening using deep learning
Key Points
Question:
How does a deep learning model for Lung Cancer Screening perform as compared to radiologists, how well do deep learning algorithms generalize across multiple datasets and how should we train these algorithms?
Finding:
A deep learning model demonstrates stable performance across three low-dose lung cancer screening datasets (NLST, LHMC, and Kaggle competition data), better performance than the widely used PanCan model, improved performance compared to the state-of-the-art represented by the winners of the Kaggle Data Science Bowl challenge on lung cancer screening, and comparable performance to a panel of six radiologists. Our findings also demonstrate the importance of a good nodule detector and confirms that the training for nodule detection and malignancy score prediction can be two separate processes.
Meaning:
The results suggest that a deep learning algorithm may be helpful to radiologists in their practice as a decision support tool or second opinion, but this will require further validation in a clinical setting.
Abstract
Importance:
Lung cancer is the leading cause of cancer mortality in the US, responsible for more deaths than breast, prostate, colon and pancreas cancer combined and it has been recently demonstrated that low-dose computed tomography (CT) screening of the chest can significantly reduce this death rate.
Objective:
To compare the performance of a deep learning model to state-of-the-art automated algorithms and radiologists as well as assessing the robustness of the algorithm in heterogeneous datasets.
Design, Setting, and Participants:
Three low-dose CT lung cancer screening datasets from heterogeneous sources were used, including National Lung Screening Trial (NLST, n=3410), Lahey Hospital and Medical Center (LHMC, n=3174) data, Kaggle competition data (from both stages, n=1595+505) and the University of Chicago data (UCM, a subset of NLST, annotated by radiologists, n=197). Relevant works on automated methods for Lung Cancer malignancy estimation have used significantly less data in size and diversity. At the first stage, our framework employs a nodule detector; while in the second stage, we use both the image area around the nodules and nodule features as inputs to a neural network that estimates the malignancy risk for the entire CT scan. We trained our algorithm on a part of the NLST dataset, and validated it on the other datasets, ensuring there is no patient overlap between the train and validation sets.
Exposures:
Two stage deep learning algorithms for lung cancer malignancy assessment.
Main outcome measures:
A binary classifier for malignancy assessment of a low-dose CT lung cancer screening exam at a patient level, evaluated by Area Under receiver operating characteristic Curve (AUC) in the three datasets.
Results, Conclusions, and Relevance:
The proposed deep learning model: (a) generalizes well across all three data sets, achieving AUC between 86% to 94%; (b) has better performance than the widely accepted PanCan Risk Model, achieving 11% better AUC score; (c) has improved performance compared to the state-of-the-art represented by the winners of the Kaggle Data Science Bowl 2017 competition on lung cancer screening; (d) has comparable performance to radiologists in estimating cancer risk at a patient level. Moreover, the results demonstrate that nodule detection and malignancy assessment can be two independent processes.
Introduction
Lung cancer is the leading cause of cancer mortality in the US, responsible for more deaths than breast, prostate, colon and pancreas cancer combined [1]. Average five year survival for lung cancer is approximately 18.1% (see e.g. [2]), much lower than other cancer types due to the fact that symptoms of this disease usually only become apparent when the cancer is already at an advanced stage. However, early stage lung cancer (stage I) has a five-year survival of 60-75%. Recently, the National Lung Screening Trial (NLST) demonstrated that lung cancer mortality can be reduced by at least 20% using a screening program of high-risk populations with low-dose computed tomography (CT) of the chest annually [3]. A greater mortality reduction has been recently reported in the European Nelson trial [4]. More complete implementation of such lung cancer screening (LCS) programs at a national level could result in a large volume of CT lung screening (CTLS) scans that need to be assessed by radiologists since the insurance mandated high-risk criteria are met by millions of Americans [5]. This highlights the potential utility of image analysis tools that can help radiologists to assess malignancy risk associated with a CTLS scan and make recommendations for further work-up, e.g. pulmonologic, oncologic or surgical evaluation.
Initial research papers on automated nodule detection were published almost 3 decades ago [6, 7], with most of the efforts focusing on chest-radiography and CT scans. More recent works [8, 9] have employed machine learning methods such as combinations of several classifiers [10, 11]. In a recent data challenge (Lung Nodule Analysis LUNA16 [12]), the best performing algorithms have been almost exclusively based on deep learning. Several neural network architectures rely on 2D and 3D convolutional networks to detect nodules (see e.g., [13, 14, 15, 16, 17, 18, 19, 20]). On the topic of nodule malignancy estimation, several recent works rely (at least partially) on deep learning, e.g. [21, 22, 23, 24, 15, 25, 26, 27, 28, 29]. The majority of previous studies evaluate the malignancy at the nodule level, rather the patient (full volume) level which is considered in this paper. This is beneficial for two reasons, firstly, it allows us to train a model with less information, using only patient outcomes and secondly, it allows us to evaluate the consequences of model performance at patient level. McWilliams et al. [30] have proposed the PanCan risk model that uses 9 image and patient features in order to estimate the cancer malignancy risk of a nodule. Moreover, a recent study [31] has shown that the PanCan Risk Model performs better than Lung-RADSTM [32] and the National Comprehensive Cancer Network (NCCN) Lung Cancer Screening Guidelines version 1.2016 [33], hence highlighting it as a useful benchmark model for our experimental validation.
Recently, a data science competition (Kaggle, Data Science Bowl 2017 [34]) was organized on the topic of lung cancer screening that attracted a significant attention from the research community. The authors of the winning entry [35] proposed a 3D convolutional network for nodule detection, using LUNA16 dataset and additional manual nodule annotations of the Kaggle dataset to train their nodule detector. Subsequently, five detected nodules were used as inputs for the malignancy risk assessment network.
In this paper, we propose a two-stage Machine Learning framework that estimates the cancer risk associated with a given CTLS scan. The first stage employs a detector [36, 35] that identifies nodules contained within a scan. The second stage employs a neural network inspired by the ResNet architecture [37], regularized using dropout [38] that performs the cancer risk assessment of the whole CTLS scan. Our framework is evaluated against three criteria (i) Robustness: we show that our framework achieves consistent performance across different low-dose CT datasets, (ii) Performance against state-of-the-art (SOTA): we show that our framework has improved performance over state-of-the-art models, and (iii) Performance compared to radiologists: we show that our model has comparable performance to a panel of six radiologists.
Methods
Data Sets
In order to evaluate the performance of our framework, we use CTLS datasets from several sources: NLST [3], LHMC, Kaggle [34] (from both competition stages) and University of Chicago (UCM) data (NLST subset with radiologist annotations). The main data characteristics are summarized in Table 1. The CTLS datasets we have used in our analysis come from heterogeneous sources (different hospitals, image quality, reconstruction filters, etc.) and allowed us to validate the generalization capacity of our framework. We should note that for the NLST dataset we have used the diagnosed cancer CTLS scans, but only a subset of the benign cases. It should be noted that when validating our model we ensured that there was no patient overlap between the train and validation sets, for example by removing the (cancer and non-cancer) patients that are contained in the UCM dataset.
| Number of volumes | Metadata | |||||
|---|---|---|---|---|---|---|
| Dataset | Total | positive | train or valid. | nodule annotations | Lung-RADSTM classification | radiologists’ scores |
| NLST | 3410 | 680 | train | yes | no | no |
| LHMC | 3174 | 56 | valid | yes | yes | no |
| UCM | 197 | 64 | valid | yes | no | yes (for 99 volumes) |
| Kaggle (stage 1) train | 1397 | 362 | train model [35] | no | no | no |
| Kaggle (stage 1) valid | 198 | 57 | valid | no | no | no |
| Kaggle (stage 2) | 505 | 153 | valid | no | no | no |
We trained our model on the NLST data [3] (3410 volumes, containing 680 hundred diagnosed cancer cases) since this dataset has the largest number of cancer cases. The NLST-trained model was subsequently validated with the other datasets. When validating model performance for the UCM dataset, we always excluded from the NLST training data the cancer and non-cancer patients that were included in the UCM study. The lung cancer screening dataset provided by LHMC contains 3174 CTLS patient scans (with 56 cancer cases), along with a nodule lexicon table that contains detailed information about the identified nodules (such as size, location, etc.). There is only a small number of cancer cases in the LHMC dataset, but the detailed nodule information allows us to compare our framework with other models from the literature that rely on such nodule-level information [30, 32]. Furthermore, UCM has provided additional annotations for 197 volumes of the NLST data (that contain 64 cancer cases), that allow us to compare our model with radiologists’ assessment as well as the PanCan risk model. Finally, we use the data from both stages of a recent lung cancer competition (National Data Science Bowl 2017) organized and hosted by Kaggle [34]. We should note that the origin of the Kaggle dataset was not disclosed by the competition organizers. Therefore, we cannot exclude the possibility that our models that have been trained on the NLST may have an overlap with the Kaggle data. This should be taken into account when interpreting the Kaggle results only. In the first stage of the competition, 1397 CTLS volumes were provided for training data (with 362 diagnosed cancer cases) and for validation 198 CTLS volumes (with 57 diagnosed cancer cases), while in the second stage 505 volumes were provided (with 153 cancer cases). In all our datasets, cancer cases were confirmed with diagnostic tests (like biopsy), so it is almost certain that the labeling is unambiguous, however, for the non-cancer cases there is a possibility that a patient left the study and developed cancer later on.
Machine Learning Framework for Cancer Risk Assessment
Model architecture. We propose a two-stage machine learning framework for cancer risk assessment. In the first stage, we employ a nodule detector to identify the nodules that are contained in a CTLS scan while in the second stage we use the ten largest nodules identified by the nodule detector as input to a deep and wide neural network that assesses their cancer risk. The decision to use the ten largest nodules was based on the optimal performance obtained from experiments with different numbers of nodules used as input. The details of the two stages are given in the remainder of this section. The pipeline of the algorithm is shown in Figure 1.
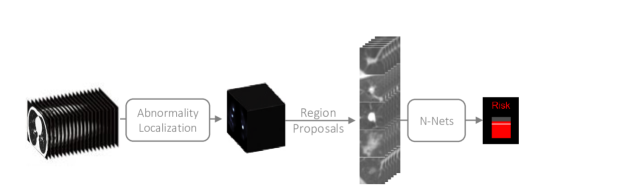
We evaluate this framework with two nodule detectors, one based on Hierarchical Machine Learning by Bergtholdt et al. [36] and another based on deep neural network semantic segmentation by Liao et al. [35]. Both are based on LUNA16 dataset [12] of confirmed nodule cases, while the later contains additional annotated cases of very big nodules (or already developed tumors) from the Kaggle dataset. More details about the nodule detectors are given in the above mentioned manuscripts [35, 36].
The nodule detector provides us with the nodule locations in all three dimensions: , and as well as additional information such as the nodule size (e.g., radius in mm), and the confidence of the suggestion - given by the nodule detector. We refer to these parameters as nodule metadata.
Based on the output from the previous stage, we can extract from the CTLS scan localized cubes of 32x32x32mm3 around a nodule (and since we employ isotropic resampling to 1mm3 each voxel corresponds to 1mm3). This gives us sufficient context for the experiments as we find that smaller or larger cubes do not improve and can even degrade performance. Additionally, during training, a random crop of 28x28x28mm3 out of the extracted 32x32x32mm3 cube is taken to ensure that the network does not see the same images in each batch iteration thus reducing overfitting. Finally, from the 3D 28x28x28mm3 cube we extract three different 2D projections, as channels, namely coronal, sagittal, and transverse, thus ending up with 3 times 28x28 input per nodule for the neural network (Figure 1).
| Layer | Properties | Previous layer(s) |
|---|---|---|
| 1. Image input | (10x3x28x28) | - Img: 10 nod, 3proj 28x28 |
| 2. Conv Layer + BN | (3x3, 8x), stride 1 | 1. |
| 3. Conv Layer + BN | (3x3, 8x), stride 1 | 2. |
| 4. Conv Layer + BN | (3x3, 8x), stride 1 | 3. |
| 5. Conv Layer + BN | (3x3, 8x), stride 1 | 1. |
| 6. Addition/Merge + BN | - | 4., 5. |
| 7. Dropout + BN | 6. | |
| 8. Dense + BN | (64) | 7. |
| 9. Dropout + BN | 8. | |
| 10. Dense + BN | (64) | 9. |
| 11. Numeric input | (10x1) | - Radius |
| 12. Numeric input | (10x1) | - , , nodule coordinates |
| 13. Numeric input | (10x1) | - confidence score |
| 14. Addition/Merge | - | 10., 11., 12., 13. |
| 15. Dense + sigmoid | (1) | 14. |
| 16. GlobalMaxPool | (10) | 15. |
Moreover, for each nodule we use additional features, such as nodule radius, and confidence score (confidence level of a detected nodule as provided by the algorithm used for nodule detection) as numeric inputs added in the penultimate level in the architecture. The nodule descriptors are obtained automatically by the nodule detector without any human intervention. In the experiments that use the SVM-based nodule detector [36] we employ one additional feature, nodule sphericity, that is not provided by the Deep Learning based nodule detector [35]. Different volumes have different number of nodules. In the experiments, we used the 10 largest nodules, when there are at least 10 nodules in the volume, otherwise all the nodules are used and the remaining “spots” are masked. We use a ResNet-like [37] deep and wide neural network for evaluating the cancer risk associated with each CTLS scan. (Deep refers to the number of layers, while wide refers to the number of inputs.) The input consists of the image part as described in the previous paragraph and the additional nodule features (e.g., radius etc.) of the nodule properties added at the penultimate layer. The network architecture is visualized in Figure 1. More details of the exact layer configuration of the neural network are given in Table 2. We used 3x3 kernels for convolutional neural network blocks with 8 channels with stride 1, intertwined with batch normalization and additional connections for realizing the ResNet-blocks (see inputs 5. and 6. in Table 2), augmented with dropout for better generalization and followed by fully connected layers (with 64 units) and sigmoid activation functions. Finally, we concatenate the last fully connected layer with the nodule metadata, making the deep neural network also wide. At the end, we perform a global max pooling aggregating over the maximum of ten branches representing the different nodules, which estimates the final cancer risk probability. We have employed the aforementioned architecture with both nodule detectors, with the only difference being the dropout rate. More precisely, when using the SVM-based nodule detector we set the dropout rate to very high values (0.7-0.9) that were necessary to obtain optimal performances, while for the Deep Learning based nodule detector [35] the dropout rate was set to a much smaller value (0.25).
Training of our model and performance evaluation. Our model relies on information about verified cancer diagnosis at the volume/scan level. This implies that our CT volumes were annotated with label 1 in cases where the patient was diagnosed with lung cancer and 0 otherwise. In this sense our data can be categorized as multi-instance weakly labeled, since our labels (cancer diagnosis) are provided for the group of nodules that are contained within a scan and not for each nodule individually.
This information was available in all datasets reported in Table 1. Using these labels at the volume level, we trained our neural network with the binary cross-entropy loss function. In the empirical results, we always evaluate the performance of our model with respect to verified cancer diagnosis at the volume level. The model that employs the DL-based nodule detector of [35], was trained using 5-fold cross-validation on the NLST data excluding all patients used in the UCM dataset and during inference the average prediction of the 5-folds was used. For the SVM-nodule model (that employs nodule detector of [36]) we have employed again the NLST data for training and we have used three model versions, one trained using 90% of the NLST training data and 0.9 dropout, one using the full NLST data excluding the full UCM patient list (197 patients) and 0.8 dropout and the full NLST data excluding the UCM subset rated by Radiologists (99 patients) and 0.7 dropout. This was done because we observed that the SVM-nodule model had reduced performance on test data (like the Kaggle dataset) when using smaller NLST subsets for training. Thus, when testing the model performance we employed the larger version possible from NSLT, i.e. we used the NLST dataset without the UCM patients only when testing for that data subset. This behavior was not observed when we employed the DL-nodule model and we were able to use a single model excluding all UCM patients from NLST without observing reduced performance in our test sets. Moreover, we should note that the convergence of our models when using high dropout rate (even 0.9) was consistent, possibly due to the fact that we used the nodule metadata at the penultimate layer of the neural network architecture. We used Adam optimizer [40] with a learning rate of .
We explored the individual contribution of the architectures attributes with various ablation experiments. Performance comparison of the different neural network architectures using the SVM-based nodule detector are given in an extended previous version of the manuscriptaaahttps://arxiv.org/abs/1804.01901v1. Namely, we tried using small to moderate dropout, using less or more global nodule features (e.g., goodness, brightness, Hounsfield units (HU), , and nodule dimensions), using only a single (largest) nodule, taking larger or smaller part around a nodule, using different architectures such as VGGs [41] and DenseNets [42]. The results suggest that there is no benefit in these architectures and the proposed one (in Table 2 and Figure 1) performs better than the alternative architectures or hyper-parameters. Similar hyper-parameter exploration was conducted for the DL-based nodule detector, resulting in the same neural network architecture with the only difference being the optimal dropout rate, which was lower (0.25 for the [35] nodule detector vs. 0.7-0.9 for the [36] nodule detector).
PanCan Risk Model
To empirically validate our framework, we employ a model developed at the Vancouver General Hospital for nodule malignancy estimation [30]. This method provides information using a single scan, and does not use information potentially available from multiple scans of the patient (that could be used, for example, to identify nodule growth). The model employs a formula, which calculates the malignancy score based on 9 numerical or boolean input parameters, including three patient features: age of a patient, gender of a patient, lung cancer family history (true or false); one clinical or image-based feature: presence of emphysema (true or false); one patient specific image-based feature: number of nodules in the CTLS scan; and four nodule specific image-based features: size of a nodule (diameter) - which is longest in-slice axis, type of the nodule (nonsolid, part-solid, or solid), location of the nodule in the upper lobe (true or false), and nodule spiculation (true or false).
| (1) |
To compare our model that produces a single risk score for each CTLS scan to the PanCan risk model that computes a risk score on a per-nodule basis, we set the CTLS scan malignancy score to be derived by the maximum malignancy score of all nodules. In our experiments this provides the best performance results for the PanCan risk model (rather than taking the mean, minimum scores etc. of a nodule per study).
Radiologists Predictions
To compare our results to radiologist performance, an observer study was conducted at UCM using 99/197 CTLS scans for which radiologists have provided a continuous numeric estimate of the cancer probability in addition to the Lung-RADSTM score. This subset consists of 20 malignant and 79 benign cases. Each selected case had to have at least one nodule within the range of 6-25mm. Besides nodule size distribution matching, the selection covered nodule types of all categories except for calcified nodules. Three senior and three junior radiologists from the thoracic imaging department participated in the study. A graphical user interface was designed for the study to capture and demonstrate relevant information to the user such as the three orthogonal views (axial, sagittal, and coronal) of the imaging focused on the slices containing the nodule as well as demographic information such as sex, age, smoking history, and family history of smoking. The user was able to measure the nodule size using the measurement tool provided. After taking all information into account, the radiologist was asked to provide the assessment of the risk for developing lung cancer in terms of a percentage number.
Results
Performance of the algorithm and comparison with the state-of-the-art
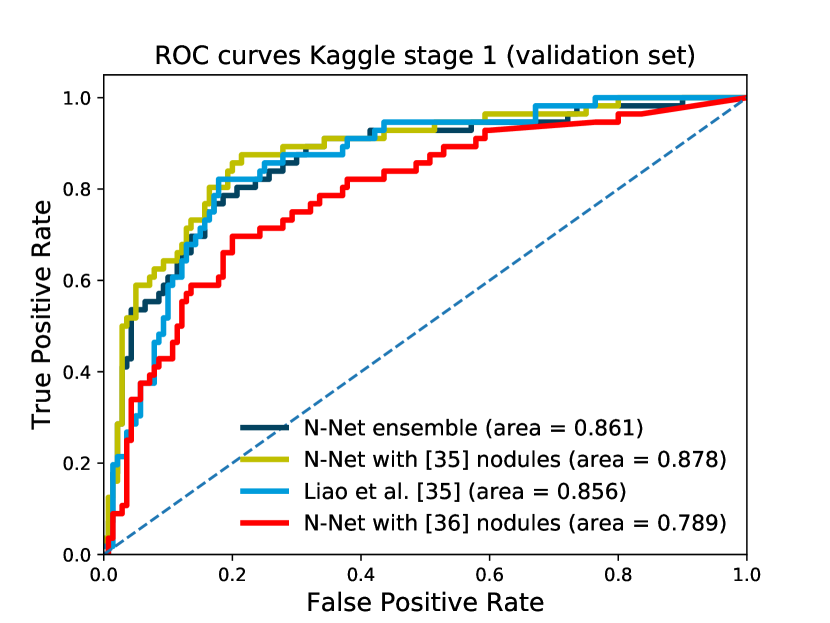
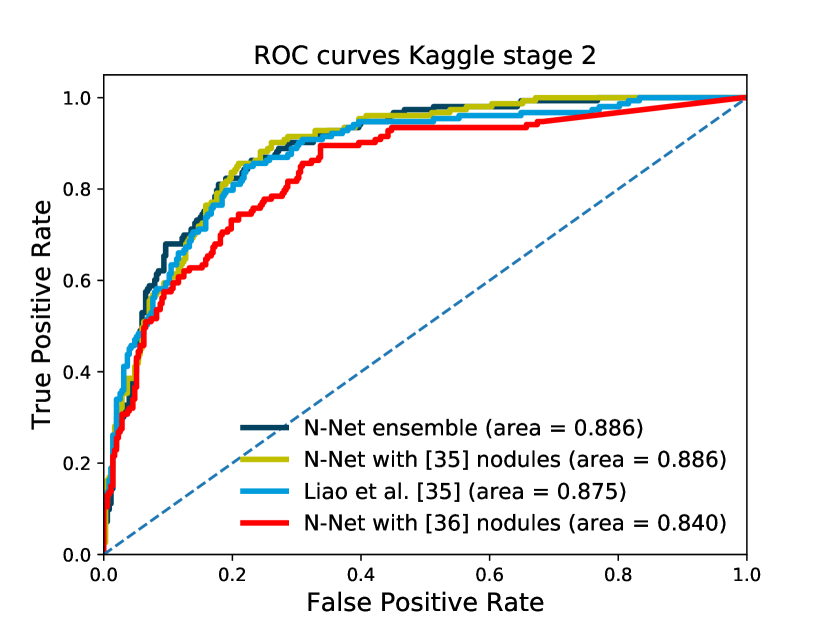
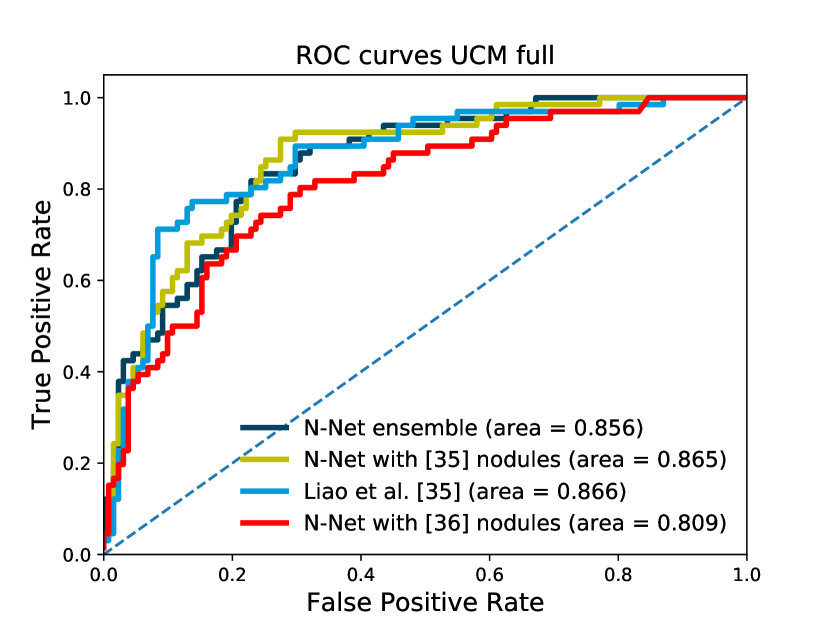
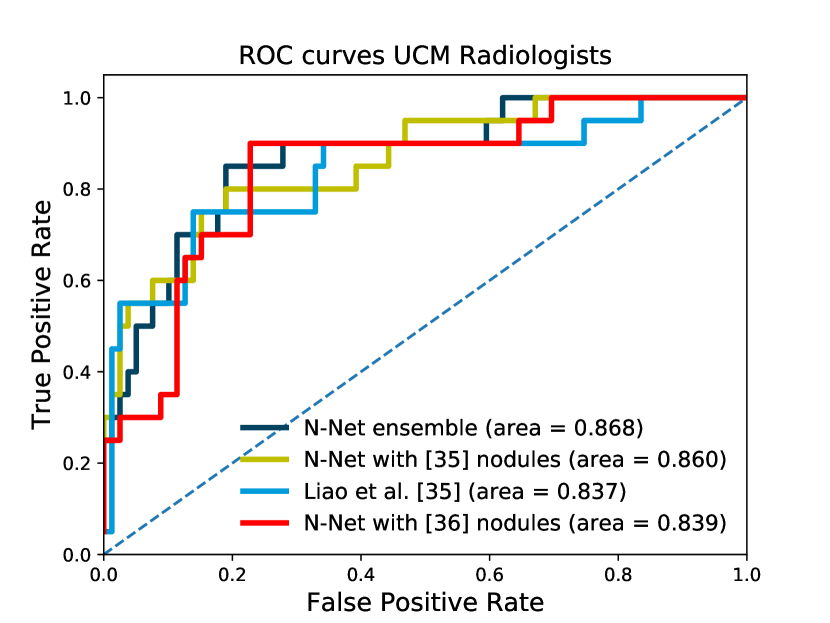
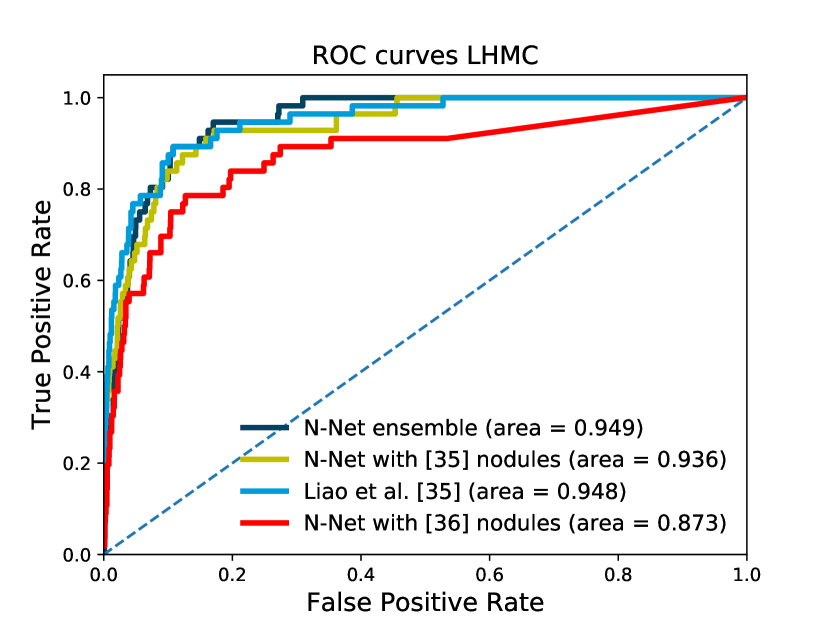
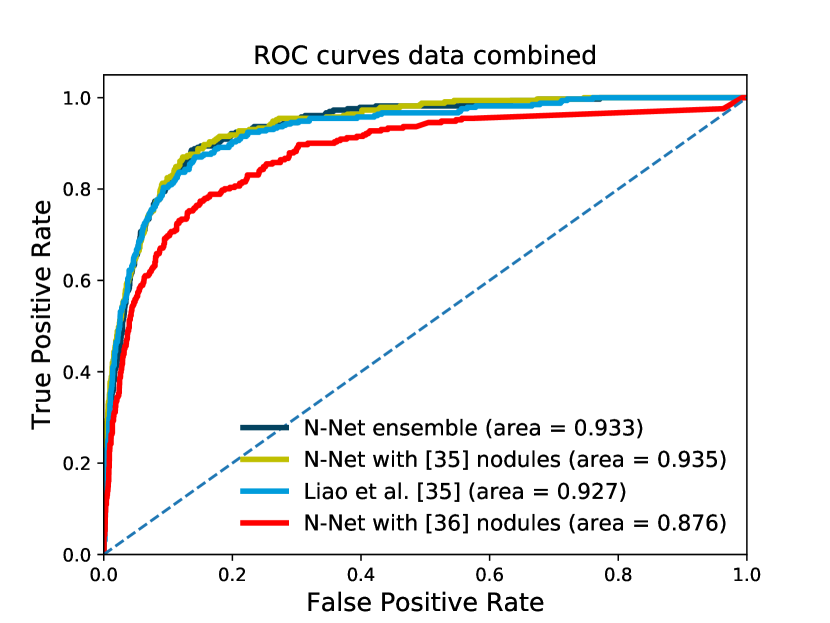
The performance of our framework was stable across the different datasets used and can achieved an AUC (Area Under the Curve) score between 86%-94% as shown in Figure 2. It is worth re-iterating that our model has been trained using only data from one dataset (NLST), but generalizes well across all different datasets that we used in the experiments. Our evaluation is more extensive than the majority of related works that commonly use smaller and less diverse datasets. The model is trained on NLST dataset and it does not require additional re-training and is just evaluated on the remaining data sets. The results also show that the performance is better than the winner of the Kaggle Data Science Bowl challenge on Lung Cancer Screening, is better than the widely used PanCan risk model and is comparable to a panel of six radiologists.
The influence of the choice of the nodule detection
In Figure 2, it can be observed that although the same neural network architecture (referred to as N-Net in the figures) was used with both nodule detectors of [35] and [36], there is a substantial performance difference. This can be attributed to the fact that the SVM-based nodule detector [36] missed a malignant nodule in some cases, especially where the nodule was already a large developed tumor (thus outside the range of nodules covered by LIDC data, where [36] was trained on). These cases, although small in number, significantly affected the ROC curves since these cancer cases were associated with a very low probability.
Comparison with radiologists performance
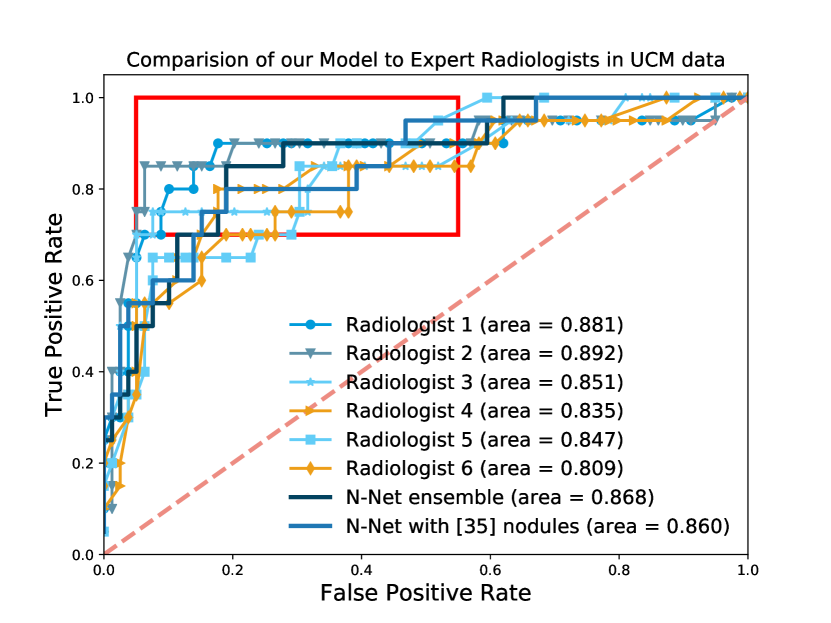
Figure 3C shows the ROC curves of our model as compared to the ROC curves obtained by the single-scan risk assessments of the 6 radiologists on the subset of 99 volumes (different patients) of the UCM data out of which 20 correspond to verified cancer cases. Our algorithm shows a comparable and often better performance than the performance of the radiologists. The predictions of the two radiologists that have slightly better AUC scores, namely Radiologists 1 and 2 in Figure 3C, have p-values [39], when compared to our methods, way higher from what is normally considered statistically significant ( and , respectively).
We highlight with a red box the area of the ROC curve where the true positive rate is at a high level, which is an important factor when performing LCS (i.e. no cancer cases are missed). It should be noted that our work is one of the few studies [28] in the literature where such a comparison to radiologists is performed.
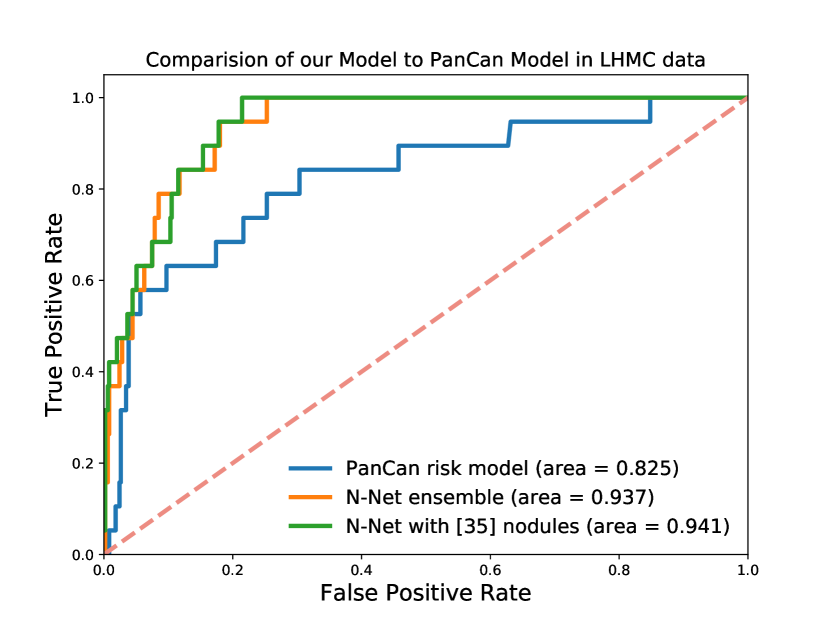
Comparison with the PanCan Risk Model
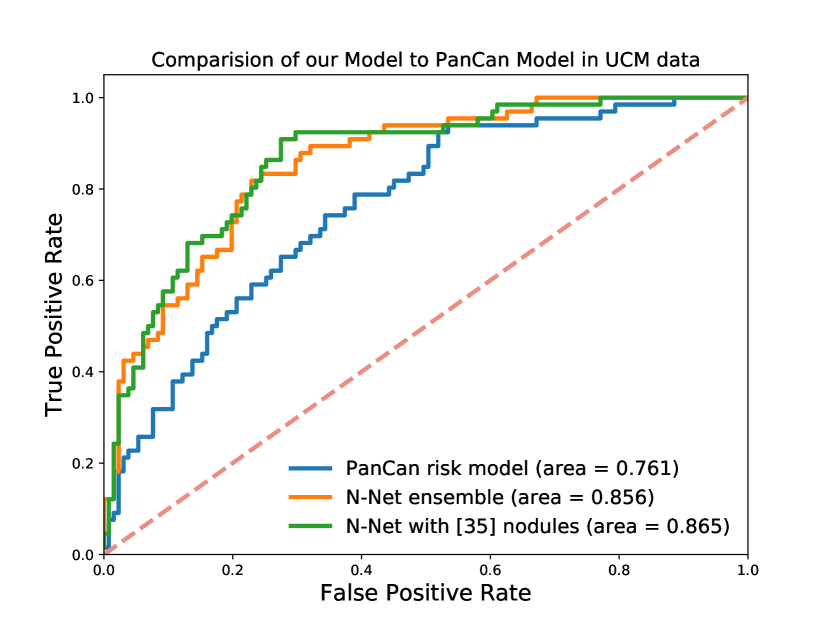
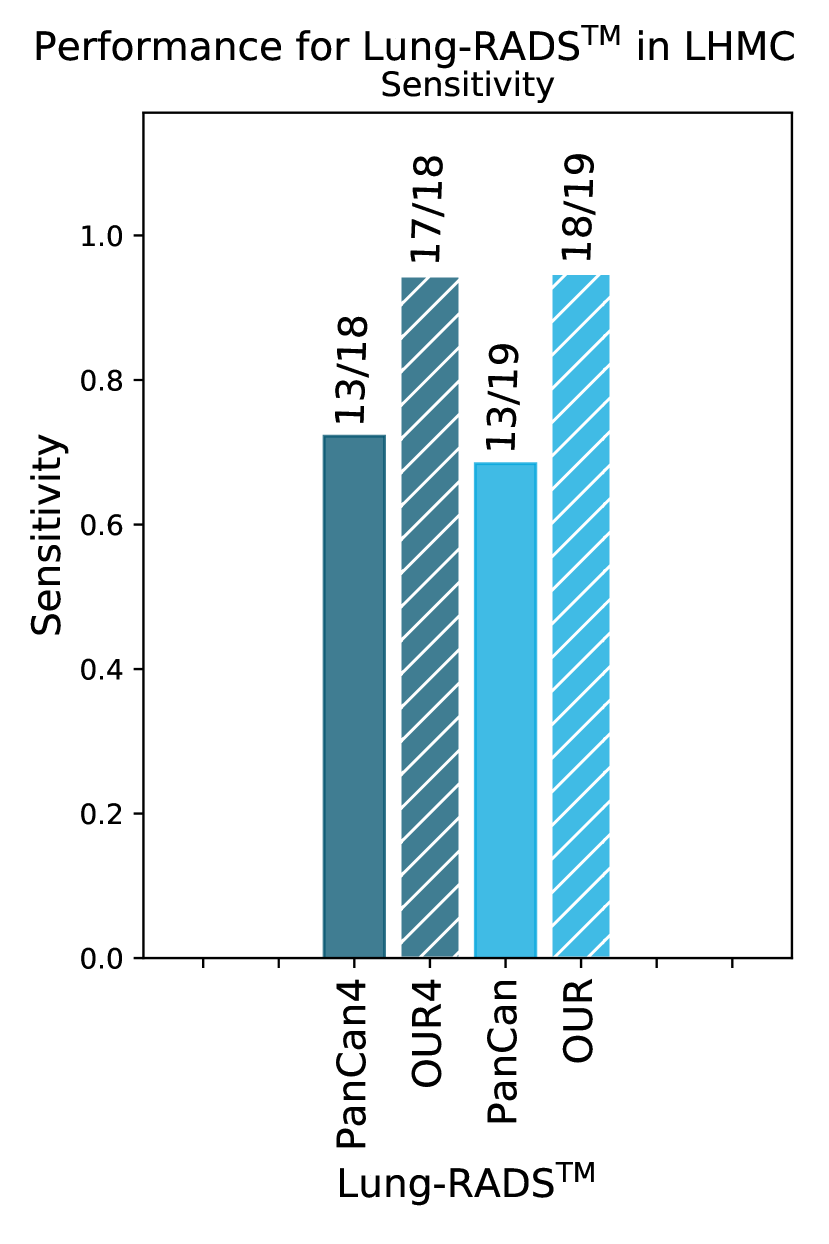
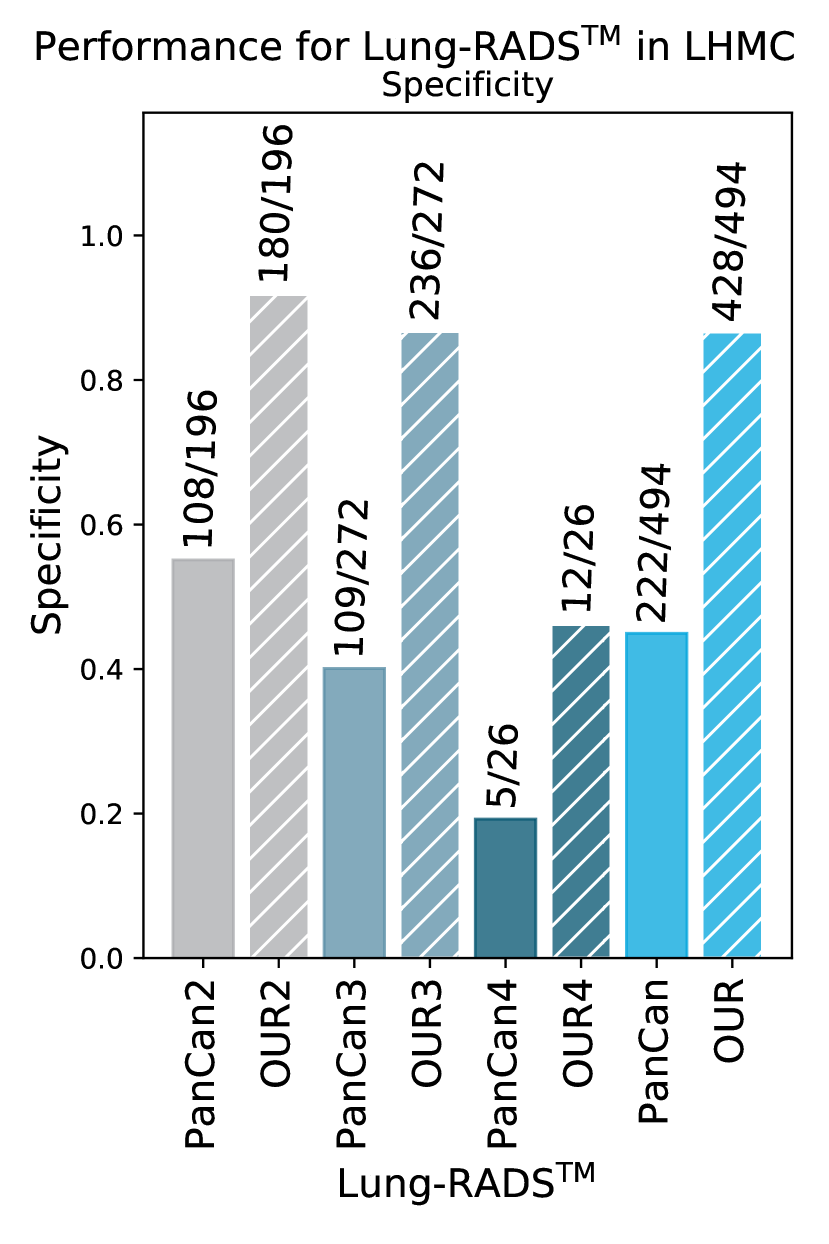
The results, presented in Figures 3A and 3B show that our proposed model significantly outperforms the PanCan risk model [30] by approximately 11% AUC for both UCM and LHMC datasets with p-values [39] and , respectively. Further, we compare our algorithm with the PanCan risk model for various Lung-RADSTM categories in the LHMC data. We performed the evaluation by comparing the sensitivity for different fixed specificity performance levels and vice versa (i.e. comparing specificity for fixed levels of sensitivity for both algorithms. These evaluations per different Lung-RADSTM categories show that our algorithm performs better than the PanCan risk model in terms of sensitivity and specificity (in Figure 3D and 3E).
Discussion
As we have discussed in detail in the introduction section, there are several research papers that have proposed solutions for the problems of nodule detection and nodule malignancy assessment. However, the evaluation of these models is done usually in datasets of much smaller scale that what is used in this paper. For example [20] uses a dataset of 300 CT scans to train and evaluate their model while in this study we employ 20x more scans from a combination of public and private data sources. This allows us to have more confidence about the robustness and generalization capacity of our framework. Moreover, we evaluated the performance of the DSB Kaggle competition winners [35] in all our datasets, thus allowing us to make a thorough comparison of our model performance against state-of-the-art approaches. Interestingly [35] had strong performances in most datasets thus illustrating the robustness of modern deep learning approaches and also the usefulness of data challenges and competitions to advance scientific research.
From the methodological point of view, our work contributes to a better understanding of the type of information that is needed to train highly performant Deep Learning models for cancer malignancy estimation. The two main paradigms are (i) models that employ solely nodule location information and patient outcomes (diagnosed-cancer or no-cancer) as information to train the model, (ii) models that employ additional information about nodule characteristics (such as level of spiculation, lobulation, etc.). We employ only the nodule locations and patient diagnostic outcomes to train our model. To the extent of our knowledge the only other work that relies on the same information is [35], i.e. the Kaggle DSB winner’s model that scored better against approaches that employed additional nodule characteristics. The results presented in this paper illustrate that nodule locations and patient diagnostic outcomes suffices to build high-performant deep learning models for lung cancer malignancy estimation.
Another interesting methodological question is related to whether nodule detection and malignancy estimation should be trained in a common end-to-end model or they can be two separate tasks. The model proposed in [35] is trained in an end-to-end manner, while in our work we have used a two-stage model where the training of the second stage is separate from the nodule detection. Interestingly, our results demonstrate that a two-stage approach can be very successful and both nodule detectors of [35] and [36] performed very well on datasets that they have not seen before (like NLST and LHMC). Our results can lead to interesting follow-ups, since patient diagnosis results can be retrieved from patient records and do not have the level of ambiguity that is sometimes associated with radiologist reports. Moreover, the availability of a substantial number of nodule detectors as a result of the LUNA16 challenge means that a clinical research center that performs lung cancer screening has the potential to build and validate their own lung cancer screening model based on the principles outlined in this work.
Conclusion
Lung cancer malignancy risk assessment is an important research topic that has recently attracted a lot of attention due to the fact that there are nearly 10,000,000 people in the US alone that fit the high-risk criteria for CTLS. This illustrates the need to develop tools to help radiologists evaluate the CTLS scans and protect the patients without lung cancer from the risks associated with unnecessary care escalation.
In this paper, we propose a two-stage framework for cancer risk assessment that is shown to have (i) robust performance across three low-dose CT dataset, (ii) improved performance compared to SOTA models and (iii) comparable performance to a panel of six radiologists. As a focus for further work, one can consider the differences in model performance across different image quality settings such as reconstruction filters (soft-tissue, sharp, etc.). One can potentially improve performance by limiting the neural networks’ training and subsequently the prediction on a unique set of reconstruction filters or consider domain adaptation methods to optimize performance across different image quality data.
References
- [1] Siegel, R., Ma, J., Zou, Z. & Jemal, A. Cancer statistics, 2014. \JournalTitleCA: A Cancer Journal for Clinicians 64, 9–29 (2014).
- [2] NAACC Review. 2018 state of lung cancer report. https://www.naaccr.org/2018-state-lung-cancer-report/ (2018).
- [3] The National Lung Screening Trial Research Team. Reduced lung-cancer mortality with low-dose computed tomographic screening. \JournalTitleNew England Journal of Medicine 365, 395–409 (2011). DOI 10.1056/NEJMoa1102873. PMID: 21714641.
- [4] International Association for the study of Lung Cancer (IASLC). IASLC 19th World Conference on Lung Cancer (Collection of abstracts). https://luna16.grand-challenge.org/ (2018). An optional note.
- [5] de Koning HJ, R, M., SK, P. & et al. Benefits and harms of computed tomography lung cancer screening strategies: A comparative modeling study for the u.s. preventive services task force. \JournalTitleAnnals of Internal Medicine 160, 311–320 (2014).
- [6] Preteux, F. A Non-Stationary Markovian Modeling for the Lung Nodule Detection in CT, 199–204 (Springer Berlin Heidelberg, Berlin, Heidelberg, 1991).
- [7] Benedict Lo, S., Lin, J., Freedman, M. & Ki Mun, S. Computer-assisted diagnosis of lung nodule detection using artificial convoultion neural network. vol. 1898, 1898 – 1898 – 11 (1993).
- [8] Messay, T., Hardie, R. C. & Rogers, S. K. A new computationally efficient cad system for pulmonary nodule detection in ct imagery. \JournalTitleMedical Image Analysis 14, 390 – 406 (2010).
- [9] Camarlinghi, N. et al. Combination of computer-aided detection algorithms for automatic lung nodule identification. \JournalTitleInternational Journal of Computer Assisted Radiology and Surgery 7, 455–464 (2012).
- [10] J. Suárez-Cuenca, J., Guo, W. & Li, Q. Automated detection of pulmonary nodules in ct: False positive reduction by combining multiple classifiers. In Proc. SPIE Medical Imagings, vol. 7963 (2011).
- [11] Murphy, K. et al. A large-scale evaluation of automatic pulmonary nodule detection in chest ct using local image features and k-nearest-neighbour classification. \JournalTitleMedical Image Analysis 13, 757 – 770 (2009). Includes Special Section on the 12th International Conference on Medical Imaging and Computer Assisted Intervention.
- [12] Challenge. LUng Nodule Analysis 2016. https://luna16.grand-challenge.org/ (2018).
- [13] Dou, Q., Chen, H., Yu, L., Qin, J. & Heng, P. A. Multilevel contextual 3-d cnns for false positive reduction in pulmonary nodule detection. \JournalTitleIEEE Transactions on Biomedical Engineering 64, 1558–1567 (2017).
- [14] Shen, W. et al. Learning from experts: Developing transferable deep features for patient-level lung cancer prediction”, booktitle=”medical image computing and computer-assisted intervention – miccai 2016: 19th international conference, athens, greece, october 17-21, 2016, proceedings, part ii. 124–131 (Springer International Publishing, Cham, 2016).
- [15] Setio, A. A. A. et al. Pulmonary nodule detection in ct images: False positive reduction using multi-view convolutional networks. \JournalTitleIEEE Transactions on Medical Imaging 35, 1160–1169 (2016).
- [16] Li, W., Cao, P., Zhao, D. & Wang, J. Pulmonary nodule classification with deep convolutional neural networks on computed tomography images. \JournalTitleComputational and Mathematical Methods in Medicine 6215085 (2016).
- [17] Sun, W., Zheng, B. & Qian, W. Computer aided lung cancer diagnosis with deep learning algorithms. vol. 9785, 9785 – 9785 – 8 (2016).
- [18] Teramoto, A., Fujita, H., Yamamuro, O. & Tamaki, T. Automated detection of pulmonary nodules in pet/ct images: Ensemble false-positive reduction using a convolutional neural network technique. \JournalTitleMedical Physics 43, 2821–2827 (2016).
- [19] Shin, H. C. et al. Deep convolutional neural networks for computer-aided detection: Cnn architectures, dataset characteristics and transfer learning. \JournalTitleIEEE Transactions on Medical Imaging 35, 1285–1298 (2016).
- [20] Anirudh, R., Thiagarajan, J.-J., Bremer, T. & Kim, H. Lung nodule detection using 3d convolutional neural networks trained on weakly labeled data (2016).
- [21] Litjens, G. et al. A survey on deep learning in medical image analysis. \JournalTitleMedical Image Analysis 42, 60 – 88 (2017).
- [22] Ciompi, F. et al. Automatic classification of pulmonary peri-fissural nodules in computed tomography using an ensemble of 2d views and a convolutional neural network out-of-the-box. \JournalTitleMedical Image Analysis 26, 195 – 202 (2015).
- [23] van Ginneken, B., A. A. Setio, A., Jacobs, C. & Ciompi, F. Off-the-shelf convolutional neural network features for pulmonary nodule detection in computed tomography scans. In 2015 IEEE 12th International Symposium on Biomedical Imaging (ISBI), 286–289 (2015).
- [24] Hua, K.-L. and Hsu, C.-H. and Chusnul Hidayati, S. and Cheng, W.-H. and Chen, Y.-J. Computer-aided classification of lung nodules on computed tomography images via deep learning technique. \JournalTitleOncoTargets and Therapy 8, 2015–2022 (2015).
- [25] Cheng, J.-Z. et al. Computer-aided diagnosis with deep learning architecture: Applications to breast lesions in us images and pulmonary nodules in ct scans. \JournalTitleScientific Reports 6 (2016).
- [26] Shen, W., Zhou, M., Yang, F., Yang, C. & Tian, J. Multi-scale convolutional neural networks for lung nodule classification. In Ourselin, S., Alexander, D. C., Westin, C.-F. & Cardoso, M. J. (eds.) Information Processing in Medical Imaging: 24th International Conference, IPMI 2015, Sabhal Mor Ostaig, Isle of Skye, UK, June 28 - July 3, 2015, Proceedings, 588–599 (Springer International Publishing, Cham, 2015).
- [27] Chen, S. et al. Automatic scoring of multiple semantic attributes with multi-task feature leverage: A study on pulmonary nodules in ct images. \JournalTitleIEEE Transactions on Medical Imaging 36, 802–814 (2017).
- [28] van Riel, S. J. et al. Malignancy risk estimation of pulmonary nodules in screening cts: Comparison between a computer model and human observers. \JournalTitlePLOS ONE 12, 1–15 (2017).
- [29] Ciompi, F. et al. Towards automatic pulmonary nodule management in lung cancer screening with deep learning. \JournalTitleScientific Reports 7 (2017).
- [30] McWilliams, A. et al. Probability of cancer in pulmonary nodules detected on first screening ct. \JournalTitleNew England Journal of Medicine 369, 910–919 (2013). PMID: 24004118.
- [31] van Riel, S. J. et al. Malignancy risk estimation of screen-detected nodules at baseline ct: comparison of the pancan model, lung-rads and nccn guidelines. \JournalTitleEuropean Radiology 27, 4019–4029 (2017).
- [32] Lung-RADS Version 1.0 Assessment Categories. https://www.acr.org/~/media/ACR/Documents/PDF/QualitySafety/Resources/LungRADS/AssessmentCategories.pdf. Accessed: 2017-10-25.
- [33] National Comprehensive Cancer Network (NCCN) Guidelines, Version 1.2016, Lung Cancer Screening, Release date June 23, 2015. https://www.nccn.org/professionals/physician_gls/f_guidelines.asp#detection. Accessed: 2017-10-25.
- [34] Kaggle competition. Data science bowl 2017: Can you improve lung cancer detection? https://www.kaggle.com/c/data-science-bowl-2017 (2017).
- [35] Liao, F., Liang, M., Li, Z., Hu, X. & Song, S. Evaluate the malignancy of pulmonary nodules using the 3d deep leaky noisy-or network. \JournalTitlearXiv preprint arXiv:1711.08324 (2017).
- [36] Bergtholdt, M., Wiemker, R. & Klinder, T. Pulmonary nodule detection using a cascaded svm classifier. In Proc.SPIE, vol. 9785, 9785 – 9785 – 11 (2016).
- [37] He, K., Zhang, X., Ren, S. & Sun, J. Deep residual learning for image recognition. In 2016 IEEE Conference on Computer Vision and Pattern Recognition (CVPR), 770–778 (2016).
- [38] Srivastava, N., Hinton, G., Krizhevsky, A., Sutskever, I. & Salakhutdinov, R. Dropout: A simple way to prevent neural networks from overfitting. \JournalTitleJournal of Machine Learning Research 15, 1929–1958 (2014).
- [39] Everitt, B. & Skrondal, A. The Cambridge Dictionary of Statistics (Cambridge University Press, 2010).
- [40] Kingma, D. P. & Ba, J. Adam: A method for stochastic optimization. In 3rd International Conference on Learning Representations, ICLR 2015, San Diego, CA, USA, May 7-9, 2015, Conference Track Proceedings (2015).
- [41] Simonyan, K. & Zisserman, A. Very deep convolutional networks for large-scale image recognition. \JournalTitleCoRR abs/1409.1556 (2014).
- [42] Huang, G., Liu, Z., van der Maaten, L. & Q. Weinberger, K. Densely connected convolutional networks. In Proceedings of the IEEE Conference on Computer Vision and Pattern Recognition (2017).
Author contributions
Mr. Trajanovski and Mr. Mavroeidis had full access to the data and can take responsibility for the integrity of the data and the accuracy of the data analysis. Mr. Trajanovski and Mr. Mavroeidis affirm that the manuscript is an honest, accurate, and transparent account of the study being reported; that no important aspects of the study have been omitted; and that any discrepancies from the study as planned (and, if relevant, registered) have been explained.
Concept and design: Trajanovski, Mavroeidis, Leon Swisher, Gebrekidan Gebre
Acquisition, analysis, or interpretation of data: Trajanovski, Mavroeidis, Leon Swisher, Gebrekidan Gebre, Veeling, Wiemker, Klinder, Tahmasebi, Regis, Wald, McKee, Flacke, MacMahon, Pien.
Statistical analysis: Trajanovski, and Mavroeidis.
Drafting of the manuscript: Trajanovski, Mavroeidis, and Leon Swisher
Critical revision of the manuscript for important intellectual content: Trajanovski, Mavroeidis, Leon Swisher, Gebrekidan Gebre, Veeling, Wiemker, Klinder, Tahmasebi, Regis, Wald, McKee, Flacke, MacMahon, and Pien Supervision: Mavroeidis, and Pien.
Additional information
Competing financial interests. The authors declare no competing financial interests.