Band Gap tunability in One-dimensional system
Abstract
The ability to tune the gaps of direct bandgap materials has tremendous potential for applications in the fields of LEDs and solar cells. However, lack of reproducibility of bandgaps due to quantum confinement observed in experiments on reduced dimensional materials, severely affects tunability of their bandgaps. In this letter, we report broad theoretical investigations of direct bandgap one-dimensional functionalized isomeric system using their periodic potential profile, where bandgap tunability is demonstrated simply by modifying the potential profile by changing the position of the functional group in a periodic supercell. It is verified for known synthetic, as well as natural polymers (biological and organic), and also for other one-dimensional direct bandgap systems. This insight would greatly help experimentalists in designing new isomeric systems of various bandgap values for polymers and one-dimensional inorganic systems for LEDs applications, and for effectively harvesting energy in solar cells.
1 Introduction
One-dimensional materials are in focus amongst the current research areas for their remarkable physical properties arising as a consequence of the reduced dimensionality. However, lack of control over reproducibility of bandgap values in one-dimensional materials [1, 2, 3] is one of the challenges for its electronic applications like LEDs and LASER diodes, as it affects their bandgap tunability. Several theoretical studies have been reported to tune the bandgap of one-dimensional materials using various methods like strain, functionalization at the edges, doping, etc. [4, 5, 6], however, the methods lack in control over the bandgap values. Since, bandgap is one of the most important factors while selecting a material for an electronic application; therefore, different direct bandgap materials have been explored for LEDs and LASER applications, e.g., Aluminium gallium nitride (AlGaN) for ultraviolet LEDs (below 400 nm), while Aluminium gallium arsenide (AlGaAs) for infrared LEDs (above 760 nm). Therefore, it would be of great interest if bandgap of a given material can be tuned, and this quest has been extended to polymers. Several experimental and theoretical studies on bandgap in polymers [7, 8, 9, 10, 11, 12, 13] have been reported aimed at their applications in organic LEDs [14, 15, 16] and solar cells [17, 18, 19, 20, 21, 22, 9]. However, different values of bandgap noticed in experiments on isomeric polymers [23, 24, 25] and also in theoretical studies [12, 25, 26, 27] suggest that bandgaps may be tuned in one-dimensional system, if the underlying physics is understood. The fact that the work so far reported on bandgaps in isomeric polymers having the same functional group is still inconclusive [25, 26, 27], motivated us to investigate and define the driving elements of different bandgaps seen in the isomeric systems. Once we understand the mechanism behind this, we may be in a position to tune the bandgaps of such materials as per our requirements.
In this work, investigations are carried out on one-dimensional isomeric polymers (synthetic and natural), and nanoribbons having the same functional groups. Since, polymers are large chain of monomers, therefore they are considered as one-dimensional periodic systems for band structure calculations [28, 29, 30, 31, 32]. Band structure calculations are performed using Density Functional Theory (DFT) as implemented in Vienna ab initio simulation package (VASP) [33]. Generalized gradient approximation (GGA) [34] is used for exchange-correlation of electron-electron interactions as implemented in projected augmented wave (PAW) formalism [35]. Further, a vacuum layer of at least Å is used to avoid interlayer interactions. The system is relaxed until a force on each atom in the unit cell is less than 0.001 eV.Å-1. k-mesh of size is used in Monkhorst-Pack formalism for momentum space sampling.
2 Results and discussions
For investigating and defining the driving element of different bandgaps in isomeric systems, first example of low bandgap synthetic polymer polydithienyl naphthodithiophenes (DThNDT) is considered. It exists in two isomeric forms, poly(anti-DThNDT) and poly(syn-DThNDT) [25] having periodic unit cell of length 14.681 Å, and 13.113 Å, respectively [Figure 1 (a)]. Cut-off energy of 500 eV is used for band structure calculations. Ground state energy calculated per atom for poly(anti-DThNDT) and poly(syn-DThNDT) are - 7.034 eV and - 7.003 eV, respectively, which are in close proximity being isomers.

Given the one-dimensional nature of polymers, their band structures are plotted from to X point [Figure 1 (b)]. Direct bandgaps are observed at point for both the polymers of poly(anti-DThNDT) and poly(syn-DThNDT) with bandgaps of 0.518 eV and 1.681 eV, respectively. Bandgap for poly(anti-DThNDT) is smaller than that of poly(syn-DThNDT), which is in agreement with the experimental report [25]. Band structures for these isomeric polymers are significantly different, even though they have same chemical formula, and practically the same ground state energy.
The polymers are one-dimensional systems with a repeating unit cell (monomer), therefore their bandgap may be related to their one-dimensional periodic potential profile similar to that of Kronig-Penney model. Since, potential is a scalar quantity, therefore average of potentials in the periodic direction of isomeric unit cell may be considered for comparative analysis of bandgap values. Average potential profile for poly(anti-DThNDT) and poly(syn-DThNDT) are plotted in the periodic direction as shown in Figure 2.

The periodic average potential profiles of poly(anti-DThNDT) and poly(syn-DThNDT) are quite different to each other, and even to ideal rectangular potentials of Kronig-Penney model [36]. Since a system prefers to stay in its ground state; therefore the deepest potential well at global minimum in the periodic potential profiles are considered for comparative analysis of bandgap values [37] for isomeric systems. The global minimum for poly(anti-DThNDT) is located at 9.849 Å, enclosed between two crests (barriers) located at 9.058 Å and 11.432 Å, while global minimum for poly(syn-DThNDT) is located at 5.517 Å, enclosed between two crests (barriers) located at 4.466 Å and 6.480 Å. From Figure 2, it can be seen that shape of the potential wells in the potential profile looks like inverse Gaussians, consisting of both well and barrier width. Therefore for simplifying the calculations, potential well is considered as square well potential of equal width for well and barrier (half of the distance between crests of the potential well). Since, depth of the deepest potential well at global minimum ‘’, and its corresponding width ‘’ are finite and non-zero, distinct from the KP model (where and for finite value of ) [36]. Hence, Schrödinger equation needs to be solved for the periodic square well potential of finite width and depth at global minimum to get first order bandgap, which may be correlated with the bandgap calculated using DFT. The energy eigenvalues corresponding to Schrödinger wave equation for an electron of mass ‘’ and energy ‘’ (where ) in a square well periodic potentials of finite depth ‘’ and width ‘’ can be obtained by solving the transcendental equation
| (1) |
where,
| (2) |
and,
| (3) |
For isomeric polymers of polydithienyl naphthodithiophenes (DThNDT) , width and depth of the deepest potential well at global minimum for poly(anti-DThNDT) are 1.187 Å and 0.212 eV, respectively, while for poly(syn-DThNDT) are 1.007 Å and 0.299 eV, respectively (Figure 2). Using these values in equation 1, it is found that poly(syn-DThNDT) has larger bandgap than that of poly(anti-DThNDT), which is in agreement with bandgap values calculated using DFT, and experimental reports [25]. Therefore, it is concluded that bandgap of one-dimensional isomeric systems may be correlated with depth and width of the potential well at global minimum in the periodic average potential profile.
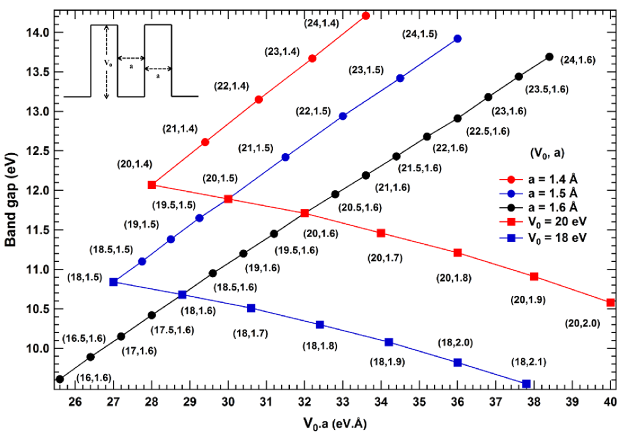
In order to find out how bandgap of one-dimensional isomeric systems may be correlated with their deepest potential well at global minimum in the periodic direction; a general correlation needs to be formulated and establish its validity for other isomeric systems. Since, isomeric systems usually would have different dimensions ( and ) of the deepest potential well at global minimum, therefore the transcendental equation 1 needs to be solved for bound states of different ‘’ varying both ‘’ and ‘’. In fact for bound states (), depth of potential well ‘’ should be greater than a critical value for a given width ‘’, which we have considered in the calculations; for example, the critical value of depth calculated for potential well is 19.04 eV for a width of 1.4 Å, while critical depth turns out to be 16.59 eV for a width of 1.5 Å. Bandgap for bound state periodic square well potential obtained from energy-momentum dispersion relations on solving the transcendental equation 1, for different ‘’ are plotted in Figure 3.
On comparing the bandgap values of two isomeric systems with their corresponding width (‘’) and depth (‘’) of potential well e.g., () and () for different product of ‘’, following correlations are derived
Case I
then
Case II
then
Case III
then
Case IV
then
Case V
In this case, sign of slopes for bandgap as a function of ‘’ may change on changing ‘’ and ‘’ w.r.t. a reference point, therefore bandgap correlation can be predicted only on solving equation 1 for corresponding ‘’ and ‘’.
For isomeric polymers of polydithienyl naphthodithiophenes (DThNDT) , the width and depth of the deepest potential well at global minimum in the periodic potential profile for poly(anti-DThNDT) are 1.187 Å (say ‘’) and 0.212 eV (say ), respectively, while for poly(syn-DThNDT) are 1.007 Å (say ‘’) and 0.299 eV (say ), respectively [Figure 2]. Since and , therefore according to correlations of Case IV, poly(syn-DThNDT) should have larger bandgap than poly(anti-DThNDT); which agrees with our band structure calculations using DFT, and other experimental reports [25]. The agreement of derived correlation with theoretical and experimental results establishes its validity.
To verify it further, the investigation is extended to other isomeric synthetic polymer polydialkylterthiophenes [see supplementary material 1] and natural polymers (biopolymers and organic polymers) [see supplementary material 2 and 3], bandgaps are found to be correlated with the dimension of the potential well at global minimum as per the derived correlations. The investigations have been extended to natural polymers for extensive validity of the correlations, even though they are insulating and of little importance to electronic applications.
On the basis of theoretical analyses, it is established that bandgap of isomeric systems are correlated with width and depth of the deepest potential well at global minimum in their periodic potential profile. From derived correlations, it may be predicted that bandgap of one-dimensional periodic system may be tuned, if width and depth of the deepest potential well in the periodic potential profile is altered on changing the position of functional group in the periodic unit cell.
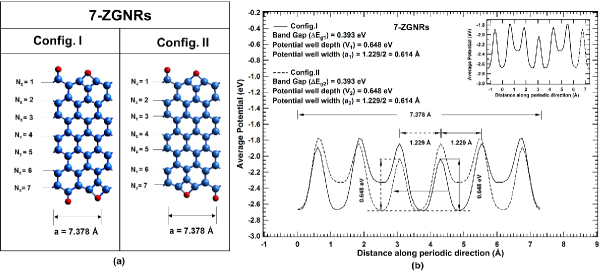
To establish the concept of bandgap tunability in one-dimensional systems; the investigation is extended to theoretical GNRs (same molecular formula for the unit cells) having the same functional group in the periodic unit cell but of different arrangements. Zigzag GNRs (ZGNRs) of the same width functionalized at the edges with oxygen atoms in two typical ways [say Config. I and Config. II as shown in Figure 4(a)] are considered for calculations. and hybridized carbon atoms are considered at edges for visible distinction of isomeric change in the periodic unit cell (7.378 Å) of zigzag GNRs. Typical edge configurations of ZGNRs ( = 7) are shown in Figure 4(a). Periodic average potential profiles corresponding to Config. I and Config. II are plotted in Figure 4(b). Even though their average potential profiles look different, their potential profiles superpose on each other on relative shifting in the periodic direction. The width and depth of potential well at global minimum for Config. I and Config. II are exactly same 0.614 Å () and 0.648 eV (). Since and , therefore according to the derived correlations (Case I), bandgap of both the configurations of ZGNRs should be equal.
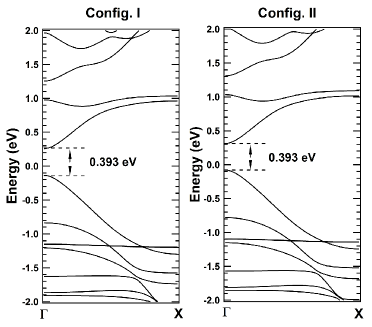
To check the validity of the correlations, band structure calculations for 7-ZGNRs are performed with cut-off energy of 450 eV. Band structures are plotted from to X point (Figure 5) for = 7. Direct bandgap of 0.393 eV is observed at point for both the configurations. It is found that bandgap values of ZGNRs for Config. I and Config. II are same, even ground state energy per atom of the unit cell calculated for both the configurations are same, - 8.762 eV. On further analyses of potential profiles of ZGNRs, the same correlations are found to be hold for other odd ZGNRs ( = 3 to 17), which are verified with the band structure calculations using DFT.
However, potential profiles of even -ZGNRs are different for both the configurations of the same functional groups, therefore bandgaps are expected to be different according to the derived correlations; and is verified from band structure calculations using DFT [See supplementary material 4 and 5], which justifies tunability of bandgap value in direct bandgap one-dimensional systems.
3 Conclusions
On the basis of theoretical analyses of one-dimensional having the same functional group in the periodic unit cell, but of different arrangements, it is observed that
-
•
Bandgap of one-dimensional systems are correlated to the depth and width of potential well at global minimum in the periodic potential profile.
-
•
The correlations derived between bandgap and dimension of periodic potential well at global minimum is verified for known isomeric systems of synthetic as well as natural polymers (biological and organic), and bandgap tunability is also established for one-dimensional nanoribbons.
Finally, it is concluded that bandgap of one-dimensional system can be tuned by changing the position of functional group in the periodic unit cell of the same material, which may be used for designing materials of different bandgap values for LEDs applications and effectively harvesting energy in solar cells; and insight may be extended to understand the different physical properties of isomers of biopolymers such as proteins.
Acknowledgements
The author thanks IIT Ropar for providing the High Performance Supercomputing facility. We also thank S. Kaur for doing some preliminary calculations related to manuscript.
References
References
- [1] Han M Y, Özyilmaz B, Zhang Y, Kim P 2007 Energy Band-Gap Engineering of Graphene Nanoribbons Phys. Rev. Lett. 98 206805.
- [2] Li X, Wang X, Zhang L, Lee S and Dai H 2008 Chemically Derived, Ultrasmooth Graphene Nanoribbon Semiconductors Science 319 1229-1232.
- [3] Tseng F, Unluer D, Holcomb K, Stan M R, and Ghosh A W 2009 Diluted chirality dependence in edge rough graphene nanoribbon field-effect transistors Appl. Phys. Lett. 94 223112.
- [4] Yan J -A, Xian L, and Chou M Y 2009 Structural and Electronic Properties of Oxidized Graphene Phys. Rev. Lett. 103 086802.
- [5] Biel B, Blase X, Triozon F, and Roche S 2009 Anomalous Doping Effects on Charge Transport in Graphene Nanoribbons Phys. Rev. Lett. 102 096803.
- [6] Lu Y and Guo J 2010 Band gap of strained graphene nanoribbons Nano Res. 3 189.
- [7] Patra D, Lee J, Lee J, Sredojevic D N, White A J P, Bazzi H S, Brothers E N, Heeney M, Fang L, Yoon M H and Al-Hashimi M 2017 Synthesis of low band gap polymers based on pyrrolo[3,2-d4,5-d’]bisthiazole (PBTz) and thienylenevinylene (TV) for organic thin-film transistors (OTFTs) J. Mater. Chem. C 5 2247-2258.
- [8] Hou J, Chen H -Y, Zhang S, Li G, and Yang Y 2008 Synthesis, Characterization, and Photovoltaic Properties of a Low Band Gap Polymer Based on Silole-Containing Polythiophenes and 2,1,3-Benzothiadiazole J. Am. Chem. Soc. 130 16144-16145.
- [9] Bundgaard E and Krebs F C 2007 Low band gap polymers for organic photovoltaics Sol. Energy Mater. Sol. Cells 91 954-985.
- [10] Chen W -C, Liu C -L, Yen C -T, Tsai F -C, Tonzola C J, Olson N, and Jenekhe S A 2004 Theoretical and Experimental Characterization of Small Band Gap Poly(3,4-ethylenedioxythiophene methine)s Macromolecules 37 5959.
- [11] Ajayaghosh A 2003 Donor-acceptor type low band gap polymers polysquaraines and related systems Chem. Soc. Rev. 32 181-191.
- [12] Hong S Y and Lee K W 2000 Small Band-Gap PolymersQuantum-Chemical Study of Electronic Structures of Degenerate -Conjugated Systems Chem. Mater. 12 155-160.
- [13] Hong S Y 2000 Zero Band-Gap PolymersQuantum-Chemical Study of Electronic Structures of Degenerate -Conjugated Systems Chem. Mater. 12 495-500.
- [14] Hamid S H and Usmani A M 1984 Applications of Polymers in Led Devices Polym.-Plast. Technol. and Eng. 22 155-176.
- [15] Yu D X 2011 Light-Emitting Devices with Conjugated Polymers Int. J. Mol. Sci. 12 1575-1594.
- [16] AlSalhi M S, Alam J, Dass L A, and Raja M 2011 Recent Advances in Conjugated Polymers for Light Emitting Devices Int. J. Mol. Sci. 12 2036-2054.
- [17] Wang C, Xu X, Zhang W, Bergqvist J, Xia Y, Meng X, Bini K, Ma W, Yartsev A, Vandewal K, Andersson M R, Inganäs O, Fahlman M, and Wang E 2016 Low Band Gap Polymer Solar Cells With Minimal Voltage Losses Adv. Energy Mater. 6 1600148.
- [18] Mori H, Nonobe H, and Nishihara Y 2016 Highly crystalline, low band-gap semiconducting polymers based on phenanthrodithiophene-benzothiadiazole for solar cells and transistors Polym. Chem. 7 1549.
- [19] Yiu A T, Beaujuge P M, Lee O P, Woo C H, Toney M F, and Fréchet J M J 2012 Side-Chain Tunability of Furan-Containing Low-Band-Gap Polymers Provides Control of Structural Order in Efficient Solar Cells J. Am. Chem. Soc. 134 2180-2185.
- [20] Woo C H, Beaujuge P M, Holcombe T W, Lee O P, and Fréchet J M J 2010 Incorporation of Furan into Low Band-Gap Polymers for Efficient Solar Cells J. Am. Chem. Soc. 132 15547-15549.
- [21] Cheng Y J, Yang S H, and Hsu C -S 2009 Synthesis of Conjugated Polymers for Organic Solar Cell Applications Chem. Rev. 109 5868-5923.
- [22] Hou J, Chen H -Y, Zhang S, Chen R I, Yang Y, Wu Y and Li G 2009 Synthesis of a Low Band Gap Polymer and Its Application in Highly Efficient Polymer Solar Cells J. Am. Chem. Soc. 131 15586-15587.
- [23] Ying L, Huang F, and Bazan G C 2017 Regioregular narrow-bandgap-conjugated polymers for plastic electronics Nat. Commun. 8 14047.
- [24] Huang Y, Xu W, Zhou C, Zhong W, Xie R, Gong X, Ying L, Huang F, and Cao Y 2016 Synthesis of medium-bandgap -Conjugated polymers based on isomers of 5-Alkylphenanthridin-6(5H)-one and 6-Alkoxylphenanthridine J. Polym. Sci., Part A: Polym. Chem. 54 2119-2127.
- [25] Casado J, Joaquín Quirante J, Hernández V, López Navarrete J T, Takimiya K, and Otsubo T 2004 Raman and Computational Study of Two Dithienyl Naphthodithiophenes Synthesis and Characterization of New Polymers Showing Low Band Gap Optical and Electroactive Features J. Phys. Chem. B 108 7611-7619.
- [26] Hong S Y and Kim S C 2003 Towards Designing Environmentally Stable Conjugated Polymers with very Small Band-Gaps Bull. Korean Chem. Soc. 24 1649-1654.
- [27] Kertesz M 1995 Structure and Electronic Structure of Low-Band-Gap Ladder Polymers Macromolecules 28 1475-1480.
- [28] Fabish T J 1979 Electronic structure of polymers Crit. Rev. Solid State Mater. Sci. 8 383-420.
- [29] Salaneck W R and Brédas J L 1994 Electronic band structure of conjugated polymers Synth. Met. 67 15-22.
- [30] Duke B J and O’Leary B 1988 The band structure of polymers Its calculation and interpretation Part 2. Calculation J. Chem. Educ. 65 379.
- [31] Duke B J and O’Leary B 1988 The band structure of polymers Its calculation and interpretation. Part 3. Interpretation J. Chem. Educ. 65 513.
- [32] Duke C B and Ford W K 1983 The electronic structure of polymers Relation to molecular architecture Int. J. Quantum Chem. 24 597-608.
- [33] Kresse G and Furthmüller J 1996 Efficiency of ab-initio total energy calculations for metals and semiconductors using a plane-wave basis set Comput. Mater. Sci. 6, 15-50.
- [34] Perdew J P, Chevary J A, Vosko S H, Jackson K A, Pederson M R, Singh D J, and Fiolhais C 1992 Atoms, molecules, solids, and surfaces: Applications of the generalized gradient approximation for exchange and correlation Phys. Rev. B 46 6671.
- [35] Kresse G and Joubert D 1999 From ultrasoft pseudopotentials to the projector augmented-wave method Phys. Rev. B 59 1758.
- [36] Kronig R de L and Penney W G 1931 Quantum Mechanics of Electrons in Crystal Lattices Proc. R. Soc. London, Ser. A 130 499-513.
- [37] Deepika, Kumar S, Shukla A, and Kumar R 2016 Origin of multiple band gap values in single width nanoribbons Sci. Rep. 6 36168.