tiny\floatsetup[table]font=tiny
Massive Stars as Major Factories of Galactic Cosmic Rays
Abstract
The identification of major contributors to the locally observed fluxes of Cosmic Rays (CRs) is a prime objective towards the resolution of the long-standing enigma of CRs. We report on a compelling similarity of the energy and radial distributions of multi-TeV CRs extracted from observations of very high energy (VHE) -rays towards the Galactic Center (GC) and two prominent clusters of young massive stars, Cyg OB2 and Westerlund 1. This resemblance we interpret as a hint that CRs responsible for the diffuse VHE -ray emission from the GC are accelerated by the ultracompact stellar clusters located in the heart of GC. The derived decrement of the CR density with the distance from a star cluster is a distinct signature of continuous, over a few million years, CR injection into the interstellar medium. The lack of brightening of the -ray images toward the stellar clusters excludes the leptonic origin of -radiation. The hard, type power-law energy spectra of parent protons continues up to 1 PeV. The efficiency of conversion of kinetic energy of stellar winds to CRs can be as high as 10 percent implying that the young massive stars may operate as proton PeVatrons with a dominant contribution to the flux of highest energy galactic CRs.
Felix Aharonian1,2,3, Ruizhi Yang2, Emma de Oña Wilhelmi4,5,6
Dublin Institute for Advanced Studies, 31 Fitzwilliam Place, Dublin 2, Ireland
Max-Planck-Institut für Kernphysik, P.O. Box 103980, D 69029 Heidelberg, Germany
Gran Sasso Science Institute, 7 viale Francesco Crispi, 67100 L’Aquila, Italy
Institute of Space Sciences (ICE/CSIC), Campus UAB, Carrer de Can Magrans s/n, 08193 Barcelona, Spain
Institut d’ Estudis Espacials de Catalunya (IEEC), 08034 Barcelona, Spain
Deutsches Elektronen Synchrotron DESY, 15738 Zeuthen, Germany
There is a consensus in the CR community that the locally detected CR protons and nuclei up to the so-called knee, a distinct feature in the CR spectrum around 1 PeV (), are produced in the Milky Way. Most likely, hundreds or more sources contribute to the flux of CRs produced at a rate [1]. Therefore, the hope of revealing the galactic factories of CRs on a source-by-source basis is not affordable, especially given that many of the CR sources are not active anymore. A more feasible approach seems to be the search for potential source populations, the best-studied representatives of which could (a) collectively provide the CR production rate in the Galaxy, and (b) explain the composition, energy spectrum and anisotropy of CRs.
The current paradigm of Galactic CRs [2] is based on the conviction that the supernovae (SNe) explosions, in general, and their remnants (SNRs), in particular, satisfy both requirements. Over many decades, this belief has been supported by phenomenological arguments and theoretical meditations. The recent observations conducted in high () and very high (VHE; ) energy bands confirm the effective acceleration of CRs in SNRs. Yet, the VHE -ray spectra reported from more than ten young supernova remnants, appeared to be steep which can be explained by the ”early” cutoffs/breaks below 10 TeV (see ”Methods” and the supplementary information). This has raised doubts in the CR community regarding the ability of SNRs to operate as CR PeVatrons.
Moreover, the theoretical developments of recent years revealed serious problems in standard schemes for boosting particles to PeV energies. In principle, Type II SN shocks propagating through the dense wind of the progenitor star can accelerate particles up to 1 PeV, but the ”PeVatron phase” could be accomplished only during the first years of the explosion (see, e.g. ref[3, 4, 5]). In this regard, the youngest known SNR in our Galaxy, SNR G1.9+0.3, is of a great interest. Despite its young age ( yr) and the shock speed ( km/s) [6], this source currently does not operate as a PeVatron, as it follows from the position of the cutoff in the spectrum of synchrotron X-rays [7]. One cannot exclude that the PeV protons have been accelerated at earlier epochs, but, because of the particle escape, the remnant is already emptied. At first glance, the early acceleration and escape of PeV protons reduces dramatically the chances of finding these PeVatrons [8]. However, in young (e.g. Tycho and Cassiopeia A) and especially very young (e.g. SN 1987a and SNR G1.9+0.3) SNRs, multi-TeV particles cannot run too far away from their remnants. For example, in the case of G1.9+0.3 located in the Galactic Center, the propagation depth of TeV protons for 100 yrs hardly could exceed cannot exceed 30 pc. For the distance to the source of 8.5 kpc, the angular size of this region is expected less than 10 arcmin, therefore the upper limit on the -ray luminosity reported by the H.E.S.S collaboration[9] can be applied to the total energy of CRs contained within pc environment around the source:
| (1) |
where is the radiative cooling time of protons through the production and decay channel; the parameter takes into account the production of -rays in interactions with involvement of nuclei of both CRs and ISM[10]. The gas density in the region surrounding G1.9+0.3 is very high, , allowing us to constrain the energy content of 0.01-1 PeV protons by erg, i.e. several orders of magnitude below the ”nominal” CR release in a SNR.
Over the last decade, the space- and ground-based telescopes have revealed many classes of galactic -ray source populations. Some of them can be considered as complementary or alternative (to SNRs) CR factories. The clusters of young stars are of particular interest. The interacting winds of massive stars have been recognized as potential CR accelerators as early as in the 1980s. The acceleration could take place in the vicinity of the stars [11, 12] or in superbubbles, multi-parsec structures caused by the collective activity of massive stars[13, 14]. The acceleration of multiple shocks can raise the maximum energy of CR protons out of 1 PeV[15, 16] which makes the stellar clusters attractive candidates for cosmic PeVatrons.
The young star clusters contain sufficient kinetic energy, supplied by interacting stellar winds, the conversion of which to CRs might be traced by secondary -rays, the products of interactions of CRs with the surrounding gas. The diffuse GeV -rays detected by Fermi LAT telescope around the compact clusters Cygnus OB2[37], NGC 3603[18] and Westerlund 2 [19] can be naturally interpreted within this scenario. Spectroscopic and morphological studies of moderately extended sources can be best performed at TeV energies with the atmospheric Cherenkov telescope arrays[20]. Diffuse TeV -ray structures have been indeed reported by the H.E.S.S collaboration in the vicinity of the stellar cluster Westerlund 1[21] as well as 30 Dor C[22] located in the Large Magellanic Cloud. In the case of Cygnus Cocoon, multi-TeV -rays have been reported as a smooth continuation of the GeV -ray spectrum up to TeV [42].
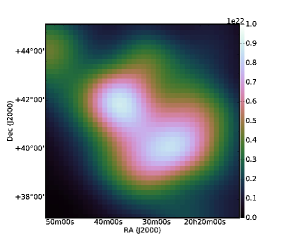
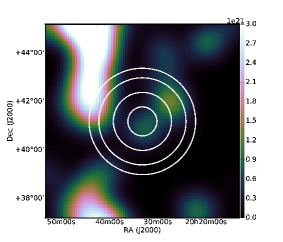
The -ray morphology combined with measurements of the atomic and molecular gas, can serve as a powerful tool for revealing the locations and the regime of operation of CR accelerators [24]. The method has been successfully applied to the diffuse TeV -ray emission of the Central Molecular Zone (CMZ) in the Galactic Centre (GC)[25]. While the hard spectra of -rays extending to energies of tens of TeV, indicate the presence of a proton PeVatron(s) in CMZ, the type radial distribution of parents protons up to pc, points to the continuous operation of proton PeVatron(s) located within the central 10 pc of GC. The supermassive black hole in the GC has been suggested as a potential source of PeV protons[25]. Below we argue that the compact stellar clusters, Arches, Quintuplet and Nuclear in GC, could be alternative sites for the CR acceleration. To support the hypothesis of association of the diffuse multi-TeV -ray emission of CMZ to the stellar clusters in GC, we explored the possibility of extraction of spatial distributions of CRs in the proximity of other clusters embedded in diffuse -ray structures.
1 Results
For Cygnus Cocoon, we analysed Fermi LAT data using the standard LAT software package. For the TeV source HESS J1646-458 linked to Westerlund 1, we used the radial profiles published by the H.E.S.S collaboration[21]. For the distribution of molecular hydrogen, we applied the data from the CO galactic survey performed by the CfA 1.2m millimetre-wave Telescope, while for the atomic hydrogen we used the data from the Leiden/Argentine/Bonn (LAB) Survey.
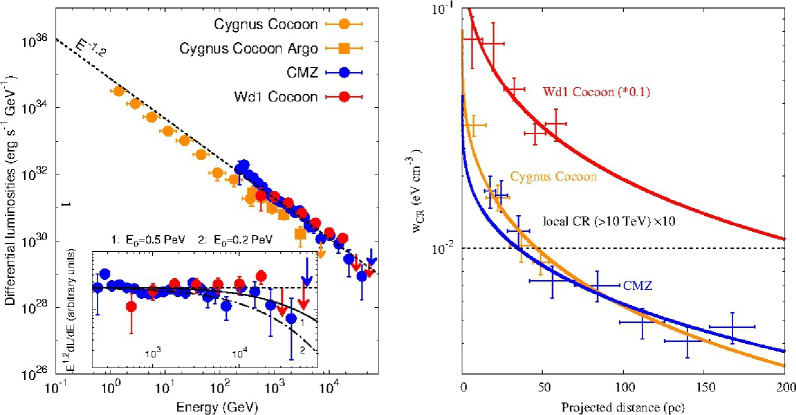
The main conclusion following from the results presented in Methods section is that the CR density declines as up to 50 pc from both stellar clusters. The results are shown in Fig.1b, together with the earlier published radial distributions of CR protons in CMZ [25]. We show the differential -ray luminosities of extended sources associated with Cyg OB2, Westerlund 1 and CMZ. The energy distributions of -rays are quite similar; type differential energy spectra with power-law index extend to 10 TeV and beyond without an indication of a break. The -rays are likely to originate from interactions of CRs with the ambient gas through the production and decay of neutral -mesons (see below). Because of the increase of the -meson production cross-section with energy, the spectrum of secondary -rays is slightly harder compared to the spectrum of parent protons, [27], thus the power-law index of the proton distribution should be .
| Source | Cyg Cocoon | CMZ | Wd 1 Cocoon |
|---|---|---|---|
| Extension (pc) | 50 | 175 | 60 |
| Age of cluster (Myr)[28] | 3–6 | 2–7 | 4–6 |
| Lkin of cluster (erg/s) | 21038 [37] | 11039 [29] | 11039 [30] |
| Distance (kpc) | 1.4 | 8.5 | 4 |
| (eV/cm3) | 0.05 | 0.07 | 1.2 |
The apparent similarity of the radial () and energy () distributions of CR protons for different stellar clusters is a hint that we observe the same phenomenon. The most natural explanation of the dependence of CR radial distribution is that relativistic particles have been continuously injected into and diffused away in the interstellar medium (ISM). Given the tight energy budget, the diffusion time cannot be much shorter than the age of the stellar cluster (see below), yr. On the other hand, the acceleration of multi-TeV CRs in an individual SNR cannot last much more than yr (see, e.g., ref[3]). Thus, to support the quasi-continuous CR injection, an unrealistically high rate of SN per 1000 yr in the cluster is required. In our view, this disfavors SNRs and gives preference to massive stellar winds as particle accelerators.
In the case of spherically symmetric diffusion, the CR density at a distance from the central source depends on the injection rate and the diffusion coefficient: , i.e., the profile is independent of the absolute value of the diffusion coefficient unless the latter varies dramatically over the scales of tens of parsecs. Generally, the diffusion coefficient is a function of energy. Typically it is presented in the form . We normalise the diffusion coefficient at TeV. Inside the accelerators and in the vicinity of powerful objects, the diffusion coefficient can significantly deviate from the average interstellar value. Because of the energy-dependence of diffusion coefficient, the initial acceleration spectrum, , outside the source is modified, , with for the burst-type injection, and for a continuous source [31].
The above relations are valid when the energy losses of CRs can be neglected. While for CR protons and nuclei this is a fully justified assumption, relativistic electrons undergo severe energy losses. However, electrons cannot be responsible for the observed -ray images. The leptonic (inverse Compton; IC) origin of -rays is excluded both at GeV and TeV energies. Firstly, the propagation of multi-TeV ( TeV) electrons in the ISM could hardly exceed 100 pc [31]. Moreover, inside a typical cluster of a radius less than 3 pc and the overall starlight luminosity of , the energy density of optical photons exceeds . Outside the cluster, decreases as , thus, up to tens of parsecs, it dominates over the average radiation density in the Galactic plane. Therefore, in the case of IC origin of -rays, we would expect a sharp increase of the - ray intensity towards a bright central source coinciding with the cluster. The brightness distributions of the observed -ray images of objects discussed in this paper do not agree with this prediction.
It is convenient to write the radial distribution of the CR density in the form
| (2) |
Below we will adopt pc, i.e. normalise the CR proton density outside but not far from the cluster. The directly derived values of for the Cygnus Cocoon, CMZ, and Wd1 cocoon, are presented in Table 1.
For the radial distribution of CRs, given in the form of Eq.(2), the total energy of CR protons within the volume of the radius is
| (3) |
For given , the main uncertainty in this estimate is related to the upper limit of integration, . If we use for the distances corresponding to the last points in Fig.1b, and the values of from Table 1, for protons with energy exceeding 10 TeV we obtain erg for Cygnus Cocoon, CMZ, and Westerlund 1 Cocoon, respectively. Note that these estimates are less biased compared to the approach based on Eq.(1). Indeed, the latter gives information only about the protons contained in the volumes visible in -rays, thus ”misses” the protons contained in low density (not detectable in -rays) gas regions. This estimate strongly depends on the value of which is determined by the brightness of the -ray image. The extensions of the large diffuse structure depend on the detector’s performance, the level of the background, etc. Thus, the content of CR protons within does not provide information about all CRs injected into ISM. The latter can be calculated by integrating Eq.(2) up to the so-called diffusion radius , the maximum distance penetrated by a particle of energy during the time . In the case of negligible energy loses of propagating particles,
| (4) |
where is the diffusion coefficient of protons in the units of , and is normalised to years. The ages of the individual clusters vary in a narrow range between 2 and 7 Myr (see Table 1). In the source neighborhood, the diffusion coefficient cannot be very large otherwise the demand on the total energy in CRs would exceed the available energy contained in the stellar winds,
| (5) |
where is the total mechanical power of the stellar winds in units of , and is the efficiency of conversion of the wind kinetic energy to relativistic protons with energy larger than 10 TeV. Substituting into Eq.(3), we obtain
| (6) |
Eq.(6) provides a direct link between two fundamental parameters characterizing the efficiency of acceleration of CRs inside the stellar cluster and their propagation in the pc vicinity of the accelerator. At 10 TeV, the diffusion coefficient in the Galactic Disk is estimated [32]. Closer to the powerful particle accelerator, the CR diffusion could be slower because of higher turbulence maintained, in particular, by CRs. If the linear size of the observed -ray image pc reflects the propagation depth of CRs, , Eq.(4) gives . For the interstellar magnetic field G, the latter is comparable to the Bohm diffusion coefficient, . It seems quite unrealistic, implying that the radius of the CR halo around Westerlund 1 most likely is significantly larger than the angular size of the resolved -ray image.
Eq.(6) gives an alternative estimate for the diffusion coefficient. The overall wind power of massive stars in Westerlund 1 is estimated , while the required energy density of TeV protons is (see Table 1). Assuming that the efficiency of acceleration of protons cannot be significantly larger than 0.01 (given that for the spectrum the content of TeV protons does not exceed 10 % of the overall CR energy above 1 GeV), we can estimate the upper limit on the diffusion coefficient around 10 TeV. From Eq.(6) follows that should be smaller, at least by a factor of 100, compared to the diffusion coefficient in the ISM, i.e., .
For this value, the size of the expanding cloud of CRs can be as large as 300 pc (see Eq.(4). Remarkably, from Fig.1b follows that even at such large distances the density of TeV CRs could exceed the locally measured CR density by two orders of magnitude. Thus one should expect an extension of enhanced -ray emission well beyond the angular size of [21], unless the gas density in this region is not anomalously low. The same is true for the Galactic Centre and the Cygnus region (see Fig. 1b). Detailed spectrometric and spatial studies of diffuse multi-TeV structures extending up to several degrees, can be provided by the Cherenkov Telescope Array (CTA) [33]. Because of the cutoff in the CR spatial distribution at , one should expect relatively sharp edges in the corresponding -ray images. For the given age of the cluster, the identification of the diffusion radius would give unambiguous information about the diffusion coefficient and, consequently, about the acceleration efficiency through Eq.(4) and Eq.(6), respectively. Regarding the observational perspectives, one should note that the chance probability of appearance of background or foreground structures in the extended gamma-ray images surrounding stellar clusters, is quite high. In the Galactic Disk, these diffuse structures can be related to unresolved sources belong the largest source populations - SNRs, Pulsar Wind Nebulae and Giant Molecular clouds. Such a problem we face, most likely, in the case of Cygnus and Wd1 Cocoons.
The spectra of CR protons inside of all three diffuse -ray sources are described by power-law energy distributions with an index . It is formed from the initial (acceleration) spectrum of protons, , but can be modified due to the energy dependent diffusion, . For the Kolmogorov type turbulence, , we arrive at a ”classical” type acceleration spectrum. One cannot, however, exclude that at energies TeV the diffusion slightly depends on the energy. Even in this extreme case the acceleration spectrum of protons would be relatively hard with . The hard -ray spectra of Westerlund 1 Cocoon and CMZ continue up to 20-30 TeV without an indication of a cutoff or a break. Correspondingly, the energy spectra of parent protons should not break at least until 0.5 PeV (see Fig.1a). This makes the clusters of massive stars potential sources of multi-TeV neutrinos with a fair chance to be detected by the cubic-km volume neutrino detectors. In particular, Westerlund 1, which has the highest -ray flux at 20 TeV, seems to be a promising target for neutrino observations [34].
2 Conclusions
The stellar clusters offer a viable solution to the long-standing problem of the origin of Galactic CRs with massive/luminous stars as major contributors to observed fluxes of CRs up to the knee around 1 PeV. In the context of available energetics and the acceleration efficiency, the population of young stellar clusters and SNRs are an equally good choice. The same is true for the speeds of outflows (stellar winds and SNR shocks) of several thousand km/s, which is a key condition for the effective utilization of the diffusive shock acceleration mechanism in the PeVatron regime.
Yet, we argue that the stellar clusters have a certain advantage compared to SNRs as long as it concerns the multi-TeV to PeV domain. Undoubtedly, the hard power-law spectra of -rays from extended regions surrounding the stellar clusters are of hadronic origin. The extension of these spectra beyond 10 TeV without an indication of a break points out that the massive stars can operate as PeVatrons. Remarkably, the potential of stellar winds (and their advantages compared to SNRs!) to accelerate protons to PeV energies, has been foreseen by Cesarsky and Montmerle [12] as early as 1983! .
In contrary, the spectra of SNRs including the prominent representatives like Tycho, Cassiopeia A and SN 1006, are steep or contain breaks at energies below 10 TeV. As a result, a suspicion is mounting among the experts that SNRs do not operate as PeVatrons, and, thus, this source population alone cannot be responsible for the overall flux of galactic CRs. This conclusion does not concern the lower energy band, where SNRs can make a major contribution. Interestingly, if both source populations convert the available mechanical energies of the stellar winds and SN shocks to CRs with similar (10 % or so) efficiencies, but different acceleration spectra ( for stellar clusters and for SNRs), one should expect a dominance of SNRs in the sub-TeV and the stellar clusters in multi-TeV bands of the spectrum of Galactic CRs. In this case, one may expect a spectral change in the transition region which can be a possible explanation of the hardening observed directly of the CR spectrum above 200 GeV [26]. Note that both source populations are in a good agreement with the conclusion derived from the reported content of heavy isotopes, that the CR acceleration in our Galaxy takes place in regions populated by massive OB stars and SN explosions[35, 36].
To conclude, the multi-TeV -ray observations provide evidence that the clusters of massive stars operating as PeVatrons may substantially contributing to the flux of galactic CRs. The extension of spectrometric and morphological -ray measurements up to 100 TeV in the energy spectrum and up to several degrees in the angular size, from regions surrounding powerful stellar clusters would provide crucial information about the origin of CRs in general, and the physics of proton PeVatrons, in particular. Such observations with the Cherenkov Telescope Array will be available in coming years.
3 Fermi data analysis of Cygnus Cocoon
For the analysis of Fermi LAT data, we have selected observations towards the Cygnus region for a period of more than 9 years (MET 239557417 – MET 532003684), and used the standard LAT analysis software package v10r0p5(http://fermi.gsfc.nasa.gov/ssc) The version of the post-launch instrument response functions (IRFs) was used, and both the front and back converted photons were selected.
For the region-of-interest (ROI), a square area centred on the point of , has been chosen. The observations with ”rock angles” larger than were excluded. In order to reduce the effect of the Earth albedo background, we also excluded the time intervals when the parts of the ROI were observed at zenith angles . Also, for the spatial analysis, given the crowded nature of the region and the large systematic errors due to a poor angular resolution at low energies, we selected only photons with energies exceeding 10 GeV at which the angular resolution is significanty improved achieving to . Note that this energy cut dramatically reduces the possible contribution of pulsars which are bright only at energies below a few GeV.
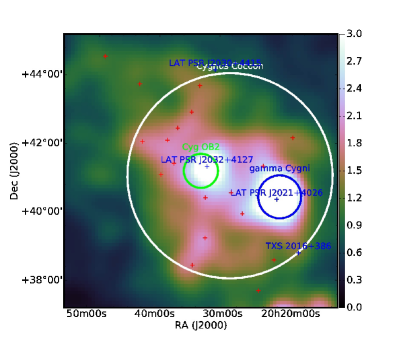
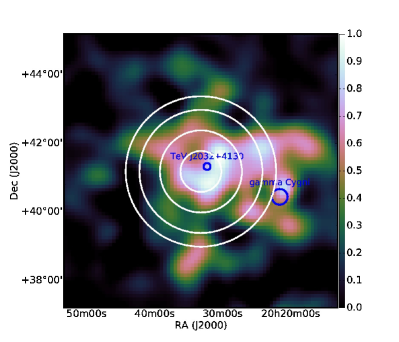
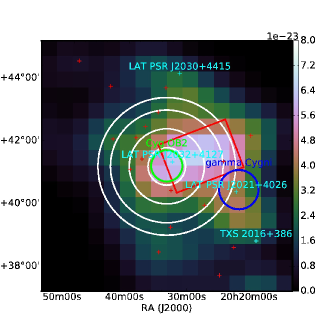
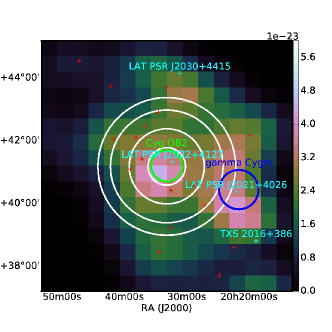
The -ray count map above 10 GeV in the region around Cygnus Cocoon is shown on the left panel of Supplementary Figure.1. We performed a binned likelihood analysis by using the tool gtlike. The point sources listed in the 3rd Fermi source catalog (3FGL) [39] are also shown; the identified sources are shown with blue crosses, while the red crosses indicate the positions of non-identified objects in the 3FGL catalog. We also added the background models provided by the Fermi collaboration (gll_iem_v06.fits and _P8R2_SOURCE_V6_v06.txt for the galactic and the isotropic diffuse components, respectively( available at http://fermi.gsfc.nasa.gov/ssc/data/access/lat/BackgroundModels.html). In the analysis, the normalisations and the spectral indices of sources inside the FOV were left free. We used the 2-D gaussian template provided by Fermi Collaboration to model the extended emission from the Cygnus Cocoon. We varied the position and the radius of the Cygnus Cocoon template but did not find a significant improvement. Therefore, for derivation of the energy spectrum we use the 2D gaussian template provided by the Fermi LAT Collaboration. In the ROI two TeV sources are also detected [41], Gamma Cygni and TeV J2032+415. We note that both of them are already identified in the 3FGL catalog and included in this analysis. The position of both sources are shown in the right panel of Supplementary Figure 1.
To derive the spectrum we divided the energy interval into 10 logarithmically spaced bands and applied the tools gtlike to each of these bands. The results are consistent with the results reported in [37]. The larger photon statistics and the new data reduction tools allow significant extension of the spectrum, up to 500 GeV. In the following study both statistical and systematic errors (due to the systematic uncertainties of the effective area [39]) are included in the following analysis. The spectrum above 1 GeV is well fitted with a power law with a photon index of and integrated flux of . The detected spectrum extends to 500 GeV without an indication of a cut-off or a break. Correspondingly, the parent protons should have a power-law spectrum with a slightly larger ( spectral index up to ) [27].
We should note that multi-TeV -rays have been claimed from the Cygnus Cocoon by the MILAGRO [41] and ARGO [42] collaborations. The comparison of spectral points from different experiments requires a special and non trivial treatment given the statistical and systematic uncertainties concerning the energy measurements, as well as the different extensions of the regions from which the -rays have been detected. Nevertheless, for the sensitivities of these detectors, the reported fluxes could hardly appear below the extrapolation of the Fermi LAT spectrum of Cygnus Cocoon.
4 Radial distribution of Cosmic rays
The brightness distribution of -rays is shaped by the product of spatial distributions of CRs and the gas density. In the ISM, the dense gas complexes are distributed rather chaotically. Therefore, the probability of detection of an ”ordered” -ray image is small. In particular, the type smooth radial distributions of CRs originating from the young star clusters Cyg OB2 is derived from quite irregular -ray images. The position of the star cluster Cyg OB2 is significantly shifted from the centre of the surrounding -ray image (see Supplementary Figure 1).
The comparison of the spatial distributions of the -ray brightness derived in the previous sections and the gas density derived in the supplementary informations does not show linear correlation which one would expect in the case of homogeneously distributed parent CRs. To investigated the CR distribution, we produce the radial profile of the the -ray emissivity, which is proportional to the CR density.
4.1 Cygnus Cocoon
As the reference point we take the position of the stellar cluster Cygnus OB2. As noted above, Cygnus OB2 is not symmetrically located inside the -ray image of the Cygnus Cocoon. Its choice as the reference point is motivated by the hypothesis that the massive OB stars of this cluster are the main producers of CRs responsible for the -ray emission.
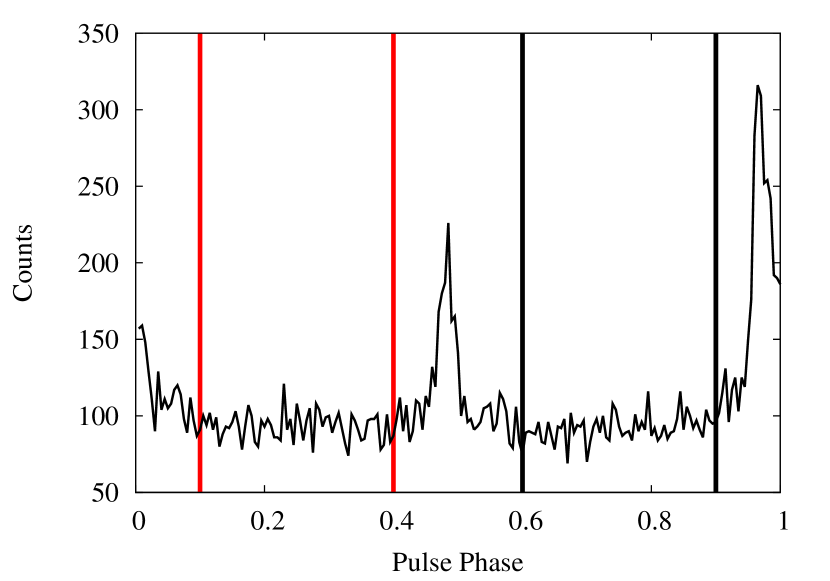
The -ray flux is derived above 10 GeV, using the standard likelihood analysis, for five rings centred on Cygnus OB2 within the following angular radii: [0:0.4]∘, [0.4:0.8]∘, [0.8:1.4]∘ [1.4:1.8]∘ and [1.8:2.2]∘. We note that the presence of the bright -ray pulsar LAT PSR J2023+4127 close to Cygnus OB2 may introduce additional contamination. To minimise the impact of this pulsar, we performed the so-called pulsar gating analysis. Namely, we produced the phase-folded light curve of LAT PSR J2023+4127 using the ephemeris corresponding to the time interval from MJD 54658 to 56611 (see https://confluence.slac.stanford.edu/display/GLAMCOG/LAT+Gamma-ray+Pulsar+Timing+Models). To obtain the light curve, we adopted a aperture without applying any background subtraction above 1 GeV. The resulted light curve is shown in Supplementary Figure 6. It shows two peaks located at the phases 0.5 and 0.95, respectively. Therefore, in order to remove the pulsed emission, the -ray data have been selected only for the phase intervals [0.1,0.4] and [0.6,0.9]. In this way, we dramatically reduce the impact of the bright -ray pulsar, albeit at the expense of reduction of the -ray photon statistics by 40%.
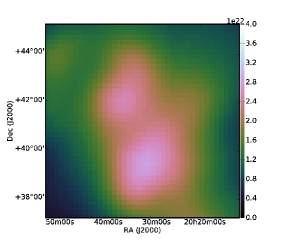
The total gas column density is contributed by the molecular, neutral atomic and ionised hydrogen components as discussed in the supplementary informations. The comparison of spatial distributions of the -ray intensity and the overall gas column density gives the radial profile of -ray emissivity, and consequently provides direct information about the profile of the CR density.
The derived radial profile of the -ray emissivity is shown in Supplementary Figure 7 together with two curves corresponding to (i) the the homogeneous distribution of CRs which is formed in the case of an impulsive injection event, and (ii) type distribution of CRs, which is expected in the case of continuous injection of CRs into ISM. The latter distribution is favoured, with a /ndf of 0.99 versus a /ndf of 31.0, compared to the case of homogeneous distribution of CRs. Due to the projection effect, the curves shown in Supplementary Figure 7 have the form , where is the radial distance and is the size of the emission region. Here we assume a spherical symmetry for the -ray emission region and integrate the density in the line of sight inside the region.
We note that the TeV source TeV J2032+415 [40] coincides in position with the pulsar LAT PSR J2023+4127 and may contaminate the most inner bin. This source has been recently identified as a variable gamma-ray source, with a flux level (above 200 GeV) increased by a factor of 2 in a recent flare event [40]. However, even without the first bin the type distribution of CRs are strongly favored, the /ndf is 0.8 compared with a /ndf of 15.6 in the homogeneous CR distribution case.
To test the possible azimuthal variation of the profile we also divided the rings into south and north hemisphere and derive the radial profile therein, respectively. The derived profile are plotted in Supplementary Figure 2. We note that due to limited statistics for each hemisphere we have three bins. The profile are also consistent with the 1/r profile with the error bars.
4.2 Westerlund 1 Cocoon
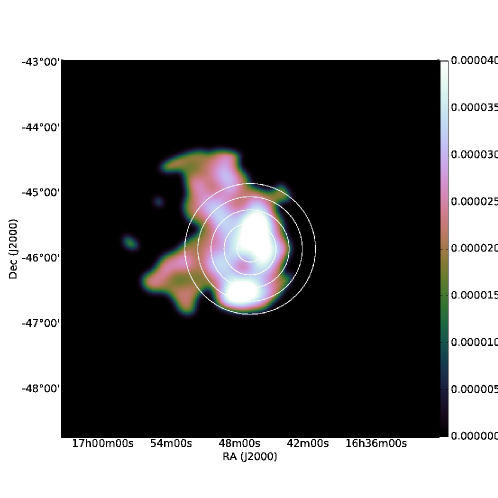
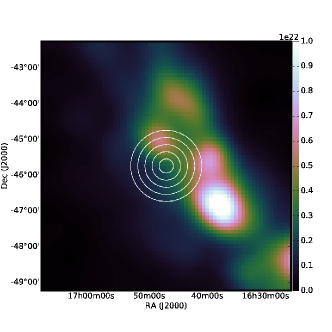
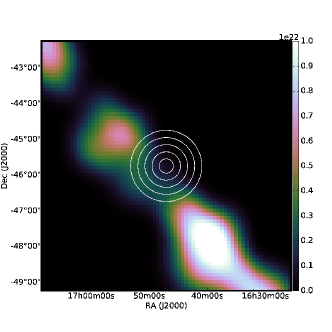
We use the H.E.S.S published results for the radial profile of the VHE -ray excess [21]. Due to the limited angular resolution of the gas maps we rebinned the H.E.S.S radial profile to a binsize of . We show the H.E.S.S excess map in Supplementary Figure 4. The figure is derived using the public data stored in the H.E.S.S website (https://www.mpi-hd.mpg.de/hfm/HESS/pages/publications/auxiliary/AA537_A114.html). To minimize the contamination from the nearby TeV source HESS J1640-465/J1641-463 we omit all points beyond . The determination of gas mass is described in supplementary informations. The results of the radial distribution of -ray emissivities (per H-atom) are shown in Supplementary Figure 8. As in the case for Cygnus Cocoon, type distribution of CRs are strongly favored, the /ndf is 0.9 compared with a /ndf of 11.2 in the homogeneous CR distribution case.
4.3 Central molecular zone (CMZ)
The -ray observations towards CMZ, as well as the corresponding gas distribution have been studied comprehensively in the H.E.S.S collaboration paper[25]. Here we use the radial profiles obtained in that work.
4.4 Normalized emissivity maps
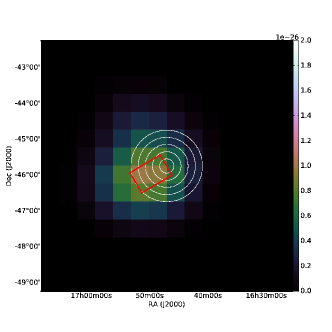
The gamma-ray emissivity per H atom, i.e., normalized to the gas density, depends linearly on the CR density. Thus the normalized emissivity map contains direct information about the spatial 2D distribution of the CR density. An ideal plan would be the one with statistically significant signal in pixels with a size comparable to the angular resolution of the gamma-ray detector. Unfortunately, because of lack of adequate photon statistics, the production of statistically significant maps with a meaningful grid cell currently is impossible both at GeV and TeV energies. In Supplementary Figure 9 we show the emissivity maps of the Wd 1 and Cygnus Cocoons. The normalized emissivity maps are derived by dividing the Wd 1 HESS excess map and the Cygnus Cocoon Fermi LAT residual map by the corresponding gas maps, respectively. Because of the limited photon statistics, the derived emissivity maps are dominated by Poisson noises. Indeed, For Cygnus Cocoon, the analysis of the Fermi LAT data gives a statistically significant signal integrated over the source occupying . For the grid cell size of , this implies that on average the photon statistics in each cell is less than half percent of the overall statistics. Correspondingly, on average, the significance of the signal in each cell cannot exceed . The same is true for the Wd1 Cocoon. In contrast, the ring templates do reveal statistically significant detection in all chosen rings; see Supplementary table 1 and table 2. In these tables, we also show the gamma-ray luminosities, the photon indices, the total mass of the gas and the derived CR density in the rings in the Cygnus and Wd1 Cocoons. It should be noted that the CR distribution from continuous sources follows the exact type contribution only in the case of negligible changes of the diffusion coefficient over the tens of parsecs. Otherwise one may expect a deviation from the dependence as well as anomalies in certain directions. The presence of such anomalies in data, however, should not necessarily be interpreted as a result of variation of the diffusion coefficient. Because of the large, up to several degrees, extensions, the gamma-ray images of the cocoons around the stellar clusters can be contaminated by random diffuse structures. The reason could the foreground or background sources, e.g., Supernova Remnants, Giant Molecular Clouds and Pulsar Wind Nebulae, especially in the crowded regions of the Galactic Disk, This seems the case of both Cygnus Cocoon and the Wd1 Cocoon. One can see this in the emissivity maps shown by red boxes in Supplementary Figure 9. For Westerlund 1 the excess region occupies about 18% of the total area of the source. The excess gamma-ray flux is about 10% of the total emission corresponding to 30 mCrab at 1 TeV. For Cygnus Cocoon, the excess region occupies 19% of the source and the integrated flux above 1 GeV is . This emission could be related to the wind nebula of the pulsar LAT PSR J2023+4127. For the distance to the pulsar of 1.3 kpc, the gamma-ray luminosity corresponding to the the ”excess” flux is about 3 % of the spin-down luminosity of the pulsar, .
So far, we have included these excess regions in the data analysis. To understand the impact of these regions on the result, we re-analyzed the data for both sources but now excluding the excess areas from the treatment, and re-calculating the radial distributions of CR protons. For Cygnus Cocoon, this is done by adding a box shaped template (labled as red box in the left panel of Supplementary Figure 9), and redoing the likelihood fitting. We also added the emissivity map after subtracting this additional component in the bottom panel of Supplementary figure 10. After the excess has been removed, the map shows a general symmetry around the central cluster. We fit this map with an universal profile ( after projection). We then subtracted the best-fit profile from the emissivity map to derived the residual emissivity map. We quantify the deviation from the profile by dividing the residual emissivity map by the best-fit profile. We found the root mean square of the deviation is 0.25. For most pixels the deviation is below 30%, which can be attributed to Poission noises.
For Westerlund 1 we removed the excess region ( red box in the top right panel of Supplementary Figure 9) and calculated the emissivities from the map directly. In both cases the ”dark” gas component is taken into account. The results shown in Supplementary figure 10, are still consistent with the profile. We show the results in Supplementary figure 10. For the Cygnus Cocoon, the fitted /ndf to a profile is 0.80, implying an improvement compared with the fitting to the whole region. For Westerlund 1 the derived /ndf is 1.1, which is slightly worse than the profile of the entire area but still provides a perfect fit.
4.5 CR density
To derive the CR density, we used the following expression,
| (7) |
where is the mass of the relevant region and accounts for the presence of nuclei heavier than hydrogen in both cosmic rays and interstellar matter. depends on the chemical composition of CRs and the ambient gas, and typically varied between [43, 44, 10]. The -ray luminosity, mass estimates and resulted CR densities for all regions of the Cygnus and Wd 1 Cocoons are presented in Supplementary Table 1and 2.
5 Gas distribution
To evaluate the total gas around the selected clusters, we used several tracers: CO maps from the galactic survey performed by Dame et.al [45]; HI from the Leiden/Argentine/Bonn (LAB) Survey; and dust maps from the Planck archival data base [52]. For the CO data, we use the standard assumption of a linear relationship between the velocity-integrated CO intensity, , and the column density of molecular hydrogen, N(H2), adopting for the conversion factor [46]. For the HI data we use the equation
| (8) |
where K is the brightness temperature of the cosmic microwave background radiation at 21cm, and . For , we truncate to ; is chosen to be 150 K.
To account for neutral gas, which may not be always traced by CO and/or HI observations (e.g. in optical thick clouds), we used an additional method provided by infrared observations. To evaluate the column density in such cases, we used the relation between the dust opacity and the column density given by the following expression (Eq. (4) of ref.[52], ).
| (9) |
where is the dust opacity as a function of the wavelength , is the reference dust emissivity measured in low- regions, is the integrated brightness temperature of the CO emission, and is the conversion factor. The substitution of the latter into Eq. (9) gives
| (10) |
Here for the dust emissivity at , we use cm2 taken from Table 3 of ref.[52].
The missing gas can be evaluated then by examining the residual maps resulting from fitting the total dust opacity map as a linear combinartion of the HI and CO maps. The fit is then iterated, including the residual map until convergence is achieved.
This method is similar to the derivation of the templates used by the Fermi LAT collaboration [38], but instead of the extinction maps we use the dust opacity maps. Indeed, has nearly perfect linear correlation with the dust opacity, especially in higher column regions [53]. Thus our method and the method used in ref.[38] should give similar results.
Note, however, that the lack of information about velocity (or distance) implies an overestimation of the gas, integrated for the whole line of sight. For fairness we show results both with and without the dark component.
The Cygnus region is located inside the Local Arm, although the Perseus and the outer arms also contribute to the total gas content in the line of sight. To select the gas content related to Cygnus Cocoon itself, we separate, following [49], two regions contributing to the total gas. In the and CO maps, we assign the gas with to be Local arm and those with to be outer arms. The gas content related to the local arms are regarded to be connected with extended -ray emission in Cygnus Cocoon. The gas mass is derived in the region defined by the -ray 2D template.
The Cygnus region harbours huge amount of gas. To determine the column density, we use the Planck free-free map [47]. First, we convert the emission measure (EM) in the Planck map into the free-free intensity by using the conversion factor in Table 1 of [50]. Then, we used Eq. (5) of [48] to calculate the column density from the intensity of free-free emission. One should note that the derived column density is inversely proportional to the electron density which is chosen here to be [48] as a fiducial value. Summing all gas phase the total mass amounts to . For the radius of the Cygnus Cocoon of 70 pc, the average gas density is estimated between 10 to , given the approximately 50% uncertainty in the mass estimate. We also note that the component only contributes about 20% of the total gas content, the exclusion of this component does not alter the results of the next section.
6 Supernova Remnants: the main contributors to Galactic CR?
SNRs are widely believed to be the main suppliers of Galactic CRs. This conviction is based on two sound arguments: (1) the availability of sufficient energy in the form of supernova explosions to support the required CR production rate in the Galaxy, and (2) adequate conditions in young SNRs for acceleration of relativistic particles through the mechanism of Diffusive Shock Acceleration (DSA). Yet, despite the extensive experimental and theoretical studies of CRs over the last several decades, the SNR paradigm of the origin of galactic CRs should be still confirmed.
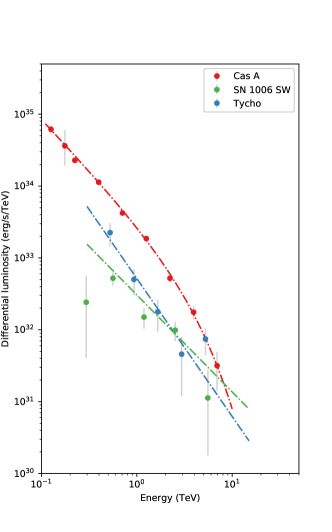
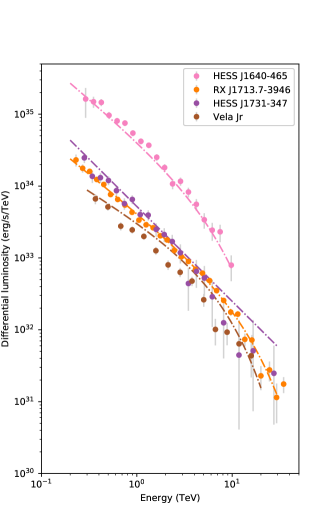
The direct measurements of CRs are important, but they cannot address the principal question regarding the localisation and identification of particle accelerators. Therefore, the ultimate solution to this long-standing problem can be found only by astronomical means. The acceleration of CRs in SNRs and their subsequent interactions with the ambient matter make these objects potentially detectable sources of -rays and neutrinos [54].Indeed, over the last 20 years, many young and mid-age SNRs have been detected in GeV and TeV bands. In Supplementary Figure 11 we show the spectral measurements (in the form of differential luminosities) of several prominent representatives of young SNRs at energies above 100 GeV [55, 56, 57, 57, 58, 59, 60, 61, 62]. Most of them show a shell-like morphology supporting the general predictions of DSA and, thus, establishing the SNR shocks as effective particle accelerators.
The very fact of detection of VHE -rays does not yet prove the dominant role of SNRs in the production of galactic CRs. VHE -rays from young SNRs demonstrate the effective acceleration of particles up to energies of 100 TeV, but it is not yet clear that the detected -rays are of hadronic origin. In SNRs, in addition to the -ray production in interactions of CR protons and nuclei with the surrounding gas, an equally important process is the Inverse Compton (IC) scattering of ultra-relativistic electrons on the 2.7K CMB and infrared photons. For this reason, the origin of -radiation detected from all SNRs is under intense debates. The interpretations within the leptonic and hadronic scenarios have ‘contras’ and ‘pros’ . Within the uncertainties of the principal parameters, both models can satisfactorily fit the broad-band -ray spectra [63].
‘Leptonic or hadronic’ It is one of the key issues of current interpretations of -ray observations of SNRs. But it still does not address a more fundamental question whether SNRs are the major contributors to the Galactic Cosmic Rays. Actually, there are two questions to be addressed: (i) whether SNRs can produce cosmic rays with overall energy close to erg, (ii) if yes, whether they can be responsible for the locally observed CR flux up to the “knee” around 1 PeV.
The positive answer to the hadronic origin of -radiation would not imply a positive answer to the first question as well. Although the total energy budget in CRs derived from -ray data in some SNRs is close to erg, in some others it is estimated significantly lower. One should notice that the estimates of depends on the ambient gas density ( and, therefore, contain an order of magnitude uncertainties. Concerning the second question, the term “PeVatron” implies an object accelerating protons with a hard ( type) energy spectrum without a break up to PeV. The spectrum of secondary -rays almost mimics the spectrum of the parent protons but is shifted towards low energies by a factor of 20-30. Thus, a detection of -rays with a hard-power-law energy spectrum extending several tens of TeV would imply an unambiguous detection of a PeVatron. So far, the observations of young SNRs did not reveal such hard multi-TeV energy spectra. Only a few SNRs have been detected above 10 TeV, but in all cases we see steep spectra, typically with a slope between 2.5 and 3 (see Supplementary Figure 11). This can be interpreted either large power-law indices or early cutoffs in the proton spectra (typically less than tens of TeV) implying that the spectra of parent protons do not extend much beyond 100 TeV. This, to a certain extent, unexpected result is a hint that either the young SNRs do not accelerate CR protons to PeV energies or the production of PeV protons takes place in objects belong a sub-class of SNRs which so far have not been detected in -rays. The first option would imply the inability of SNRs to play the major role in the production of galactic CRs. The second option leaves a room for ”accommodation” of SNRs in the scheme of galactic CRs. But it means that only a small fraction of SNRs contribute to CRs, at least at highest energies. Consequently, one should assume that the efficiency of conversion of energy in these objects should significantly exceed the ”nominal” 10 percent value.
References
- [1] Drury, L. O. Origin of Cosmic Rays. Astroparticle Physics 39-40,52–60 (2012).
- [2] Blasi, P. The origin of galactic cosmic rays. Astron. Astrophys.Rev. 21, 70 (2013).
- [3] A. Bell, K. Schure, B. Reville and G. Giacinti, Cosmic ray acceleration and escape from supernova remnants. Mon. Not. R. Astron. Soc. 431, 415 (2013)
- [4] Cardillo, M., Amato, E., & Blasi, P. On the cosmic ray spectrum from type II supernovae expanding in their red giant presupernova wind. Astroparticle Physics,69 , 1 (2015)
- [5] Zirakashvili, V. N., & Ptuskin, V. S. Type IIn supernovae as sources of high energy astrophysical neutrinos. Astroparticle Physics, 78, 28 (2016)
- [6] Borkowski, K. J., Reynolds, S. P., Green, D. A., et al., Radioactive Scandium in the Youngest Galactic Supernova Remnant G1.9+0.3. Astrophys. J.Lett., 724, L161 (2010)
- [7] Aharonian, F., Sun, X.-. na . & Yang, R.-. zhi . Energy distribution of relativistic electrons in the young supernova remnant G1.9+0.3. Astron. Astrophys., 603, A7 (2017)
- [8] Cristofari, P., Gabici, S., Terrier, R., & Humensky, T. B. On the search for Galactic supernova remnant PeVatrons with current TeV instruments. Mon. Not. R. Astron. Soc., 479, 3415 (2018)
- [9] A. Abramowski et al. [H.E.S.S. Collaboration], TeV -ray observations of the young synchrotron-dominated SNRs G1.9+0.3 and G330.2+1.0 with H.E.S.S. Mon. Not. R. Astron. Soc. 441, 1, 790 (2014)
- [10] Kafexhiu, E., Aharonian, F., Taylor, A. M. & Vila, G. S. Parametrization of gamma-ray production cross-sections for pp interactions in a broad proton energy range from the kinematic threshold to PeV energies. Phys. Rev. D, 90, 123014 (2014).
- [11] Casse, M. & Paul, J. A. Local gamma rays and cosmic-ray acceleration by supersonic stellar winds. Astrophys. J. 237, 236–243 (1980).
- [12] Cesarsky, C. J. & Montmerle, T. Gamma rays from active regions in the galaxy - The possible contribution of stellar winds. Space Sci. Rev. 36, 173–193 (1983).
- [13] Bykov, A. M. Nonthermal particles and photons in starburst regions and superbubbles. Astron. Astrophys.Rev. 22, 77 (2013)
- [14] Parizot, E., Marcowith, A., van der Swaluw, E., Bykov, A. M. & Tatischeff, V. Superbubbles and energetic particles in the Galaxy. I. Collective effects of particle acceleration. Astron. Astrophys. 424, 747–760 (2004).
- [15] Bykov, A. M. & Toptygin, I. N. Interstellar turbulence and the kinetics of cosmic rays. Akademiia Nauk SSSR Izvestiia Seriia Fizicheskaia 46,1659–1662 (1982).
- [16] Klepach, E. G., Ptuskin, V. S. & Zirakashvili, V. N. Cosmic ray acceleration by multiple spherical shocks. Astroparticle Physics 13,161–172 (2000).
- [17] Ackermann, M. et al. A Cocoon of Freshly Accelerated Cosmic Rays Detected by Fermi in the Cygnus Superbubble. Science 334, 1103– (2011).
- [18] Yang, R.-z. & Aharonian, F. Diffuse -ray emission near the young massive cluster NGC 3603. Astron. Astrophys. 600, A107 (2017).
- [19] Yang, R.-z., de Oña Wilhelmi, E. & Aharonian, F. Diffuse gamma-ray emission in the vicinity of young star cluster Westerlund 2. Astron. Astrophys. 611, A77 (2018).
- [20] Aharonian, F., Buckley, J., Kifune, T. & Sinnis, G. High energy astrophysics with ground-based gamma ray detectors. Reports on Progress in Physics 71,096901 (2008).
- [21] Abramowski, A. et al. Discovery of extended VHE -ray emission from the vicinity of the young massive stellar cluster Westerlund 1. Astron. Astrophys. 537, A114 (2012).
- [22] Abramowski, A. et al. The exceptionally powerful TeV -ray emitters in the Large Magellanic Cloud. Science 347, 406–412 (2015).
- [23] Bartoli, B. et al. Identification of the TeV Gamma-Ray Source ARGO J2031+4157 with the Cygnus Cocoon. Astrophys. J. 790, 152 (2014).
- [24] Aharonian, F. A. & Atoyan, A. M. On the emissivity of ^0^-decay gamma radiation in the vicinity of accelerators of galactic cosmic rays. Astron. Astrophys. 309, 917–928 (1996).
- [25] Abramowski, A. et al. Acceleration of petaelectronvolt protons in the Galactic Centre. Nature 531, 476–479 (2016).
- [26] Aguilar, M., Aisa, D., Alpat, B. & et al. Precision Measurement of the Proton Flux in Primary Cosmic Rays from Rigidity 1 GV to 1.8 TV with the Alpha Magnetic Spectrometer on the International Space Station. Phys. Rev. Lett. 114, 171103 (2015).
- [27] Kelner, S., Aharonian, F. A. & Bugayov, V. Energy spectra of gamma-rays, electrons and neutrinos produced at proton-proton interactions in the very high energy regime. Phys. Rev. D 74, 034018 (2006).
- [28] Figer, D. F. Young Massive Clusters. InBresolin, F.,Crowther, P. A. & Puls, J. (eds.) Massive Stars as Cosmic Engines, vol. 250 of IAU Symposium, 247–256 (2008).
- [29] Muno, M. P. et al. Diffuse, Nonthermal X-Ray Emission from the Galactic Star Cluster Westerlund 1. Astrophys. J. 650, 203–211 (2006).
- [30] Hußmann, B. The Quintuplet cluster - A young massive cluster study based on proper motion membership. Ph.D. thesis Universität Bonn (2014).
- [31] Atoyan, A. M., Aharonian, F. A. & Völk, H. J. Electrons and positrons in the galactic cosmic rays. Phys. Rev. D 52, 3265–3275 (1995).
- [32] Strong, A. W., Moskalenko, I. V. & Ptuskin, V. S. Cosmic-Ray Propagation and Interactions in the Galaxy. Annu. Rev. Nuc. Part. Sci. 57,285–327 (2007).
- [33] Actis, M., Agnetta, G., Aharonian, F., et al. Design concepts for the Cherenkov Telescope Array CTA: an advanced facility for ground-based high-energy gamma-ray astronomy . Experimental Astronomy, 32, 193 (2011)
- [34] Bykov, A. M., Ellison, D. C., Gladilin, P. E. & Osipov, S. M. Ultrahard spectra of PeV neutrinos from supernovae in compact star clusters. Mon. Not. R. Astron. Soc. 453, 113–121 (2015).
- [35] Ellison, D. C., Drury, L. O., & Meyer, J.-P. Galactic Cosmic Rays from Supernova Remnants. II. Shock Acceleration of Gas and Dust. Astrophys. J., 487, 197 (1997)
- [36] Binns, W. R., Israel, M. H., Christian, E. R., et al. Observation of the 60Fe nucleosynthesis-clock isotope in galactic cosmic rays. Science, 352, 677 (2016)
- [37] Ackermann, M. et al. A Cocoon of Freshly Accelerated Cosmic Rays Detected by Fermi in the Cygnus Superbubble. Science 334, 1103– (2011).
- [38] F. Acero et al. Development of the Model of Galactic Interstellar Emission for Standard Point-Source Analysis of Fermi Large Area Telescope Data. Astrophys. J.Suppl. 223, no. 2, 26 (2016)
- [39] The Fermi-LAT Collaboration. Fermi Large Area Telescope Third Source Catalog. Astrophys. J.Suppl., 218, 23 (2015)
- [40] Mirzoyan, R. & Mukherjee, R. TeV gamma-ray emission from PSR J2032+4127/ MT91 213 at periastron. The Astronomer’s Telegram 10971 (2017).
- [41] Abdo, A. A. et al. Spectrum and Morphology of the Two Brightest Milagro Sources in the Cygnus Region: MGRO J2019+37 and MGRO J2031+41. Astrophys. J. 753, 159 (2012).
- [42] Bartoli, B. et al. Identification of the TeV Gamma-Ray Source ARGO J2031+4157 with the Cygnus Cocoon. Astrophys. J. 790, 152 (2014).
- [43] Dermer, C. D. Secondary production of neutral pi-mesons and the diffuse galactic gamma radiation. Astron. Astrophys. 157, 223–229 (1986).
- [44] Mori, M. Nuclear enhancement factor in calculation of galactic diffuse gamma-rays: A new estimate with dpmjet-3. Astroparticle Physics 31,341 – 343 (2009).
- [45] Dame, T. M., Hartmann, D. & Thaddeus, P. The Milky Way in Molecular Clouds: A New Complete CO Survey. Astrophys. J. 547, 792–813 (2001).
- [46] Bolatto, A. D., Wolfire, M. & Leroy, A. K. The CO-to-H2 Conversion Factor. Annu. ReV. Astron. Astrophys. 51, 207–268 (2013).
- [47] Planck Collaboration et al. Planck 2015 results. X. Diffuse component separation: Foreground maps. Astron. Astrophys. 594, A10 (2016).
- [48] Sodroski, T. J. et al. A Three-dimensional Decomposition of the Infrared Emission from Dust in the Milky Way. Astrophys. J. 480, 173–187 (1997).
- [49] Ackermann, M. et al. The cosmic-ray and gas content of the Cygnus region as measured in gamma rays by the Fermi Large Area Telescope. Astron. Astrophys. 538,A71 (2012).
- [50] Finkbeiner, D. P. A Full-Sky H Template for Microwave Foreground Prediction. Astrophys. J.Suppl. 146, 407–415 (2003).
- [51] Grenier, I. A., Casandjian, J.-M., & Terrier, R. Unveiling Extensive Clouds of Dark Gas in the Solar Neighborhood. Science 307, 1292 (2005)
- [52] Planck Collaboration, Ade, P. A. R., Aghanim, N., et al. Planck early results. XIX. All-sky temperature and dust optical depth from Planck and IRAS. Constraints on the ”dark gas” in our Galaxy. Astron. Astrophys., 536, A19 (2011)
- [53] Planck Collaboration, Abergel, A., Ade, P. A. R., et al. Planck 2013 results. XI. All-sky model of thermal dust emission. Astron. Astrophys., 571, A11 (2014).
- [54] Drury, L. O., Aharonian, F. A. & Voelk, H. J. The gamma-ray visibility of supernova remnants. A test of cosmic ray origin. Astron. Astrophys. 287, 959–971 (1994).
- [55] Abramowski, A. et al. HESS J1640-465 - an exceptionally luminous TeV -ray supernova remnant. Mon. Not. R. Astron. Soc. 439, 2828–2836 (2014).
- [56] H.E.S.S. Collaboration et al. A new SNR with TeV shell-type morphology: HESS J1731-347. Astron. Astrophys. 531, A81 (2011).
- [57] Aharonian, F. et al. Discovery of Gamma-Ray Emission From the Shell-Type Supernova Remnant RCW 86 With Hess. Astrophys. J. 692, 1500–1505 (2009).
- [58] Aharonian, F. et al. H.E.S.S. Observations of the Supernova Remnant RX J0852.0-4622: Shell-Type Morphology and Spectrum of a Widely Extended Very High Energy Gamma-Ray Source. Astrophys. J. 661, 236–249 (2007).
- [59] Aharonian, F. et al. Primary particle acceleration above 100 TeV in the shell-type supernova remnant RX J1713.7-3946 with deep HESS observations. Astron. Astrophys. 464, 235–243 (2007).
- [60] Aharonian, F. et al. A detailed spectral and morphological study of the gamma-ray supernova remnant RX J1713.7-3946 with HESS. Astron. Astrophys. 449, 223–242 (2006).
- [61] Archambault, S. et al. Gamma-Ray Observations of Tycho’s Supernova Remnant with VERITAS and Fermi. Astrophys. J. 836, 23 (2017).
- [62] Ahnen, M. L. et al. A cut-off in the TeV gamma-ray spectrum of the SNR Cassiopeia A. Mon. Not. R. Astron. Soc. 472, 2956–2962 (2017).
- [63] Aharonian, F. A. Gamma rays from supernova remnants. Astroparticle Physics 43,71–80 (2013).


.


| Region | (10 GeV) () | mass () | ( | index | significance () |
|---|---|---|---|---|---|
| 0.8 | 12.2 | ||||
| 2.4 | 11.2 | ||||
| 4.0 | 10.1 | ||||
| 3.3 | 8.3 |
| Region | (1 TeV) () | mass () | |
|---|---|---|---|
| 0.1 | |||
| 0.3 | |||
| 0.73 | |||
| 1.20 | |||
| 1.03 |